ObjectivesTo determine secular trends in anthropometric indices (fat-mass, fat-free
mass, external skeletal robustness) in young adults and examine possible relationships
between them.
Methods Anthropometric data (body height, body mass; skinfold thickness (SFT) –
triceps, abdominal, thigh; circumferences (C) – waist, upper arm, thigh; width – elbow,
knee) of young adults aged 20-25 years (N=5303; males 1985, females 3318) were used from
the Slovenian (data)Base of Anthropometric Measurements from 1960 to 2023. Multiple
linear regressions were performed.
ResultsThe most significant positive secular trends (p<0.0001) were observed
in males for abdominal SFT (B=0.151, R2=0.169) and thigh SFT (B=0.131,
R2=0.142). In females, similar trend was observed in waist C (B=0.111;
R2=0.107). The most significant negative secular trend (p<0.001) was
observed in muscle area of lower limbs in both sexes (males: B=-0.427,
R2=0.000; females: B=-0.875, R2=0.300). Based on multiple linear
regression analysis, body height and overall body mass were the most important factors
influencing the observed decline in external skeletal robustness, with the latter being
assessed with frame index according to elbow and knee width.
ConclusionOver the last 60 years, a positive secular trend was observed in body
height and body fat, while a negative trend was noted in muscle mass. Increases in body
height and overall body mass had the most significant impact on the observed decrease in
assessed external skeletal robustness over time.
Keywords: secular trend, external skeletal robustness, body fat, muscle area, anthropometric characteristics, young adults’
Conflict of interest: There are no
conflicts of interest.
Citation: Zdešar Kotnik, K. / Golja, P. / Robič Pikel, T. (2024). Secular trends in anthropometric characteristics and their associations with
external skeletal robustness among Slovenian young adults’ population. Human Biology and Public Health 1. https://doi.org/10.52905/hbph2024.1.76.
Copyright: This is an open access article distributed under the terms of the Creative Commons Attribution License which permits unrestricted use, distribution, and reproduction in any medium, provided the original author and source are credited.
Over the past six decades, Slovenian young adults have grown taller, gained
fat, lost muscle mass, and their external skeletal robustness diminished.
Contents
Abbreviations
ANOVA: one-way analysis of variance
B: unstandardized beta
BAM: (data)Base of Anthropometric Measurements
BFP: percentage of body fat
BMI: body mass index
C: circumferences
CI: confidence interval
FI: frame index
FI.elbow: frame index from elbow width
FI.knee: frame index from knee width
ISAK: The International Society for the Advancement of Kinanthropometry
N: number of subjects
OW: overweight
P: value of statistical significance
R2: adj. and adjusted R-squared R2 adj.
SFT: skinfold thickness
TMA: thigh muscle area
UMA: upper arm muscle area
Introduction
The term secular trend in human growth refers to a
long-term, noticeable, and consistent change in body characteristics of a population over an
extended period of time (i.e., several decades or even centuries) (Bogin 2021a). It illustrates the complex interplay of genes, physiology,
and environment in determining the size and shape of individuals from one generation to the
next (Cole 2003). The direction and rate of secular
trends of population groups generally correspond to the standard of living (assessed with,
for example, gross domestic product per capita, access to health care, and nutrition) within
a country (Bogin 2021a), which was traditionally
used as an indicator of population’s public health.
It has been noted that average body height has already reached a plateau in
several countries, for example in Northern European countries (e.g. Netherland, Finland,
Denmark, and Sweden), the UK, India, and Bangladesh (NCD
Risk Factor Collaboration 2016; Fudvoye and
Parent 2017). However, over the same period, a shift toward an increase in body
mass over height can be observed. Due to environmental and behavioural changes (Caballero 2007; Temple
2023), the global epidemic of overweight and obesity began in the 1980s in
developed countries (Ng et al. 2014; Cole 2003; Garrido-Miguel et al. 2019; Afshin et al.
2017).
The main mechanism for the development of obesity is energy imbalance, in
which excessive caloric intake exceeds the energy expenditure (e.g., through physical
activity). This imbalance leads to the accumulation of body fat and often to a decrease in
lean body mass which can affect the robustness of the skeleton (Rietsch et al. 2013a; Lizana and
Hormazabal-Peralta 2020). External skeletal robustness is a term that refers to the
skeletal strength as reflected by its size and shape (Stock and Shaw 2007) and it is described with body frame size. Body frame size is
frequently assessed with the diameter of certain bone structures, with elbow width according
to the height being the most often used proxy for the body frame size (Frisancho 1990; La Guzman-de Garza
et al. 2022). Body frame size can be influenced by body composition (fat mass,
fat-free mass) and total body mass (Chumlea et al.
2002). Indeed, both muscle and fat mass, which exert dynamic loads and additional
gravitational pressure on bone, affect the bone structure and strength (Jeddi et al. 2015; Behringer et al. 2014).
Body frame size has been extensively studied in children and adolescents
(La Guzman-de Garza et al. 2022). Several studies
found a positive association between the percentage of body fat (BFP) and the external
skeletal robustness measured with body frame size (La
Guzmán-de Garza et al. 2017; Leonard et al.
2004; Musálek et al. 2018; Rietsch et al. 2013a; Martinez et al. 1995; Vispute et al.
2023; Lizana and Hormazabal-Peralta 2020).
In contrast, some studies in children and adolescents aged 6 to 12 years showed opposite
results, although this was not true for all examined ages of children (Scheffler 2010). Furthermore, a study conducted by Kryst et al. (Kryst et al. 2021) demonstrated that normal-weight
individuals had greater bone and muscle mass, which also resulted in better scores on most
fitness tests (e.g., relative dynamometric strength) compared to their overweight/obese
peers (Kryst et al. 2021). The amount of fat mass
also appears to have a negative impact on the skeletal robustness in normal-weight obese
individuals (thus in those with normal BMI but excess total body fat and low lean body
mass). Namely, the results of the Musálek et al. (Musálek
et al. 2018) study showed poorer skeletal robustness of the lower extremities in
normal-weight obese children. Furthermore, Deng et al. (Deng et al. 2021) proposed that higher lean body mass is associated with higher
bone mineral density, while higher BFP seems to have a negative effect on bone mineral
density in children and adolescents.
There are a few studies that explore skeletal robustness and its associations
with body fatness in the adult population. The study of Martinez et al. (Martinez et al. 1995) demonstrated that body frame size
is positively associated with the amount of subcutaneous fat (independent of age and sex) in
children, adolescents, as well as in young adults, which is in direct contrast with the
observations of Scheffler (Scheffler 2010).
However, the study by Glauber et al. (Glauber et al.
1995) demonstrated that the most important factor associated with higher bone
mineral density was body mass, especially for weight-bearing bones (such as the hip bone and
the vertebrae), as compared to height, hip-to-waist ratio, elbow width, and body fat
percentage.
Changes in body height (Cole 2003;
Fudvoye and Parent 2017) and overweight/obesity
(Afshin et al. 2017; Garrido-Miguel et al. 2019) have been widely studied worldwide.
However, studies on changes in other body characteristics and body proportions, as well as
on the effects of excessive body fat accumulation on growth, are limited and results are
inconsistent. Therefore, using a (data)Base of Anthropometric Measurements (BAM) of the
Slovenian student population (Golja and Robič Pikel
2021), we aimed to reveal secular trends of anthropometric indices (fat mass,
fat-free mass, skeletal robustness) of young adults and examine possible relationship
between them. We hypothesized that body size of young Slovenian adults (students) changed
over last 63 years as follows: (1) average body height and body fat mass (as assessed with
skinfold thickness and waist circumference) increased; (2) skeletal robustness (as assessed
with frame index) decreased and (3) skeletal robustness is negatively associated with body
fatness.
Sample and methods
Study sample
The data for the present study were obtained from an extensive
anthropometric data collection, that was established over years from measurements
performed on Slovenian males and females of the (mostly) student population – (data)Base
of Anthropometric Measurements (BAM) (Golja and Robič
Pikel 2021; Robič Pikel 2022). Briefly,
the Department of Biology of the Biotechnical Faculty of the University of Ljubljana,
Slovenia, has been performing systematic anthropometric measurements on young adults
(mostly students) annually since the 1930s. Most of the measurements were performed on
subjects who enrolled in one of the study programmes of the University of Ljubljana,
mainly those of the Biotechnical Faculty or Faculty of Education. In the decade 1960-69,
data were also obtained as a part of preventive health care activities for students at the
University of Ljubljana. In addition, BAM also includes data that have been collected as a
part of different master’s and doctoral degree theses. For this purpose,
colleagues/acquaintances of the students are sometimes invited to participate – these
subjects are in the same age group than the students, but do not necessarily study
themselves. Subjects have provided written informed consent and the use of all collected
anonymized anthropometric data was approved by the National Ethics Committee of the
Republic of Slovenia (KME 104/12/10).
To achieve the aims of the present study, anthropometric data of young
adults (mainly students) were collected from BAM for the subjects measured between 1960
and 2023. The recruited subjects were enrolled in one of the study programmes of the
University of Ljubljana and came from different parts of the Republic of Slovenia. The
sample was thus not randomised. Since slightly different measurements were performed in
different time periods, only correctly performed measurements were selected for the
present analysis.
Measurements
Anthropometric characteristics were measured in accordance with
anthropometric standards (Lohman 1988). Body
height was measured with a stadiometer to the nearest 0.1cm. During the measurement,
subjects stood barefoot, with their back straight, hands relaxed next to their body, feet
and knees together, heels touching the stadiometer, and head held in the Frankfurt
horizontal plane. After year 2020, we started to measure body height according to the
International Society for the Advancement of Kinanthropometry (ISAK) standard, which is,
in comparison to the standards set by Lohman et al. (Lohman 1988), a stretched body height. Body mass was measured with a certified
medical scale to the nearest 0.1kg. During the measurement, subjects stood still over the
center of the scale, with the body mass evenly distributed over both feet (Lohman 1988).
Skinfold thickness (SFT) (triceps, thigh, and abdominal) was measured on
the right side of the body with skinfold caliper to the nearest 0.1mm, which was a Slim
Guide caliper (HaB Essentials) before 2010, and a Harpenden caliper (HSB-BI, England)
after 2010. The measurement of each skinfold was performed three times and the median of
the measurements was taken as representative. The triceps SFT was measured vertically over
the triceps muscle midway between the acromial process of the scapula and olecranon
process of the ulna (or at the anthropometric landmark radiale after the year 2020
according to ISAK). The thigh SFT was measured vertically in the front of thigh at
mid-point between the anthropometric landmark patellare and the mid-point of inguinal
ligament. The abdominal SFT was measured vertically, 5cm to the right from the
umbilicus.
Circumferences (C) were measured with non-elastic tape to the nearest
0.1cm. Waist C was measured at a level midway between the lower rib margin and iliac crest
all around the body in horizontal position, relaxed mid-upper arm C at the same level as
triceps SFT, and thigh C at the same level as thigh SFT.
Elbow and knee width were measured with the small sliding caliper to the
nearest 0.1cm between the lateral and medial epicondyle of the humerus and femur,
respectively.
It should be noted that the measuring devices have changed over the decades
but were standard equipment at the time.
Abb – abbreviation, C – circumference, SFT – skinfold thickness
Statistical analysis
All data were analysed using IBM SPSS Statistics 22 (IBM Corp. 2022). The level of statistical significance was set to
0.05. Because the variables were normally distributed (as assessed with the normal Q-Q
plot, skewness, kurtosis, and normality test), all parametric data (body height, body
mass, BMI, triceps SFT, and thigh SFT, waist C, elbow and knee width, and frame index
according to elbow and knee) were presented as average (standard deviation), and
statistical analysis was performed using the appropriate parametric tests. To test the
differences in average value of the selected variables between the decades, one-way
analysis of variance (ANOVA) was performed. Because of the inequality of variance between
the decades, the robust Welch test was used.
To examine the secular trends of variables in question, a simple linear
regression was performed between the year of measurement as an independent variable
(outcome) and each selected variable as the dependent (predicted) variable. Results are
presented as unstandardized beta (B) and adjusted R-squared (R2 adj.).
Multiple linear regression (stepwise method) was performed to examine
whether external skeletal robustness assessed with the frame index according to elbow
width (FI.elbow) and knee width (FI.knee), was associated with the predicted variables
(height, body mass, triceps SFT, upper arm muscle area (UMA), thigh SFT, and thigh muscle
area (TMA)). When FI.elbow was used as the dependent variable, body height, body mass,
triceps SFT, and UMA were included in the model. If FI.knee was used as the dependent
variable, body height, body mass, thigh SFT, and TMA were included in the model. We
excluded all cases with standardised residuals greater than +3 or smaller than -3.
Results
Our final sample included 5,303 young adults (males N=1,985, females N=3,318)
with average age of 21.5 years (range 20- to 25-years-olds).
In Table 2, the sex structure of the
sample during the six decades is presented. Table 3
(for males) and Table 4 (for females) present
anthropometric characteristics of our sample in each decade. ANOVA revealed statistical
significance (p<0.001) between decades for each studied variable (p-values are not
presented in the table). Over the examined decades, average body height increased, with the
most significant change observed in 1980-89 and then 2000-09 compared to the other decades
in both sexes. Average body mass also increased over the decades, particularly after the
decade 2000-09.
Anthropometric characteristics for assessing overweight/obesity generally
increased over time. The most significant and consistent increase was observed for waist C
from the decade 1960-69 to the decade 2010-19 in both sexes. Average BMI significantly
increased from the decade 1960-69 to the decade 2020-23 in males, but not in females.
However, the prevalence of overweight/obesity according to BMI increased over the same
period in both sexes, from 12.5% to 20.3% in males and from 11.4% to 18.4% in females. The
observed prevalence of overweight/obesity according to BMI was not statistically significant
between males and females (p>0.05).
Muscle mass assessed with upper arm muscle area (UMA) significantly increased
in the decade 2010-19 and 2020-23, while thigh muscle area (TMA) decreased in the same
period in both sexes.
Anthropometric characteristics for assessing external skeletal robustness
(assessed with frame index) according to elbow width (FI.elbow) decreased significantly over
time, especially after the 2010-19 decade in males, and in the 2020-23 decade in females. In
males, elbow width decreased significantly after 2010-19, whereas for FI.elbow, a decrease
was already observed after 2000-09. In females, both measures were the lowest in 2010-19. No
such pattern was seen in FI.knee in males, while in females a decrease in FI.knee was more
pronounced from the decade 1960-69 to the decade 2010-19, with an observed increase in the
decade 2020-23.
Additional simple linear regression (Table 5 for males and Table 6 for females)
confirmed the above presented results. Positive secular trends were observed for body height
(1.0cm per decade in males and 0.7cm per decade in females) and body mass (1.2kg per decade
in males and 0.6kg per decade in females). Among measures assessing overweight/obesity, the
greatest positive change over time was observed in abdominal SFT (1.5mm per decade) in
males, and in waist C (1.1cm per decade) in females, while the smallest change was observed
in BMI (0.1kg/m2 per decade for males, -0.03kg/m2 per decade for females). Significant
negative secular trend was observed in muscle mass, especially in TMA (-4.3cm2 in males and
-8.8cm2 in females).
Among measures assessing skeletal robustness, a negative secular trend was
observed for both FI.elbow and FI.knee (-0.4 percentage points per decade for both measures
in males; -0.4 percentage points per decade for FI.elbow and 0.8 percentage points per
decade for FI.knee in females).
Selected measures for the assessment overweight/obesity (triceps SFT,
abdominal SFT), muscle mass (UMA, TMA), and external skeletal robustness (FI.elbow, FI.knee)
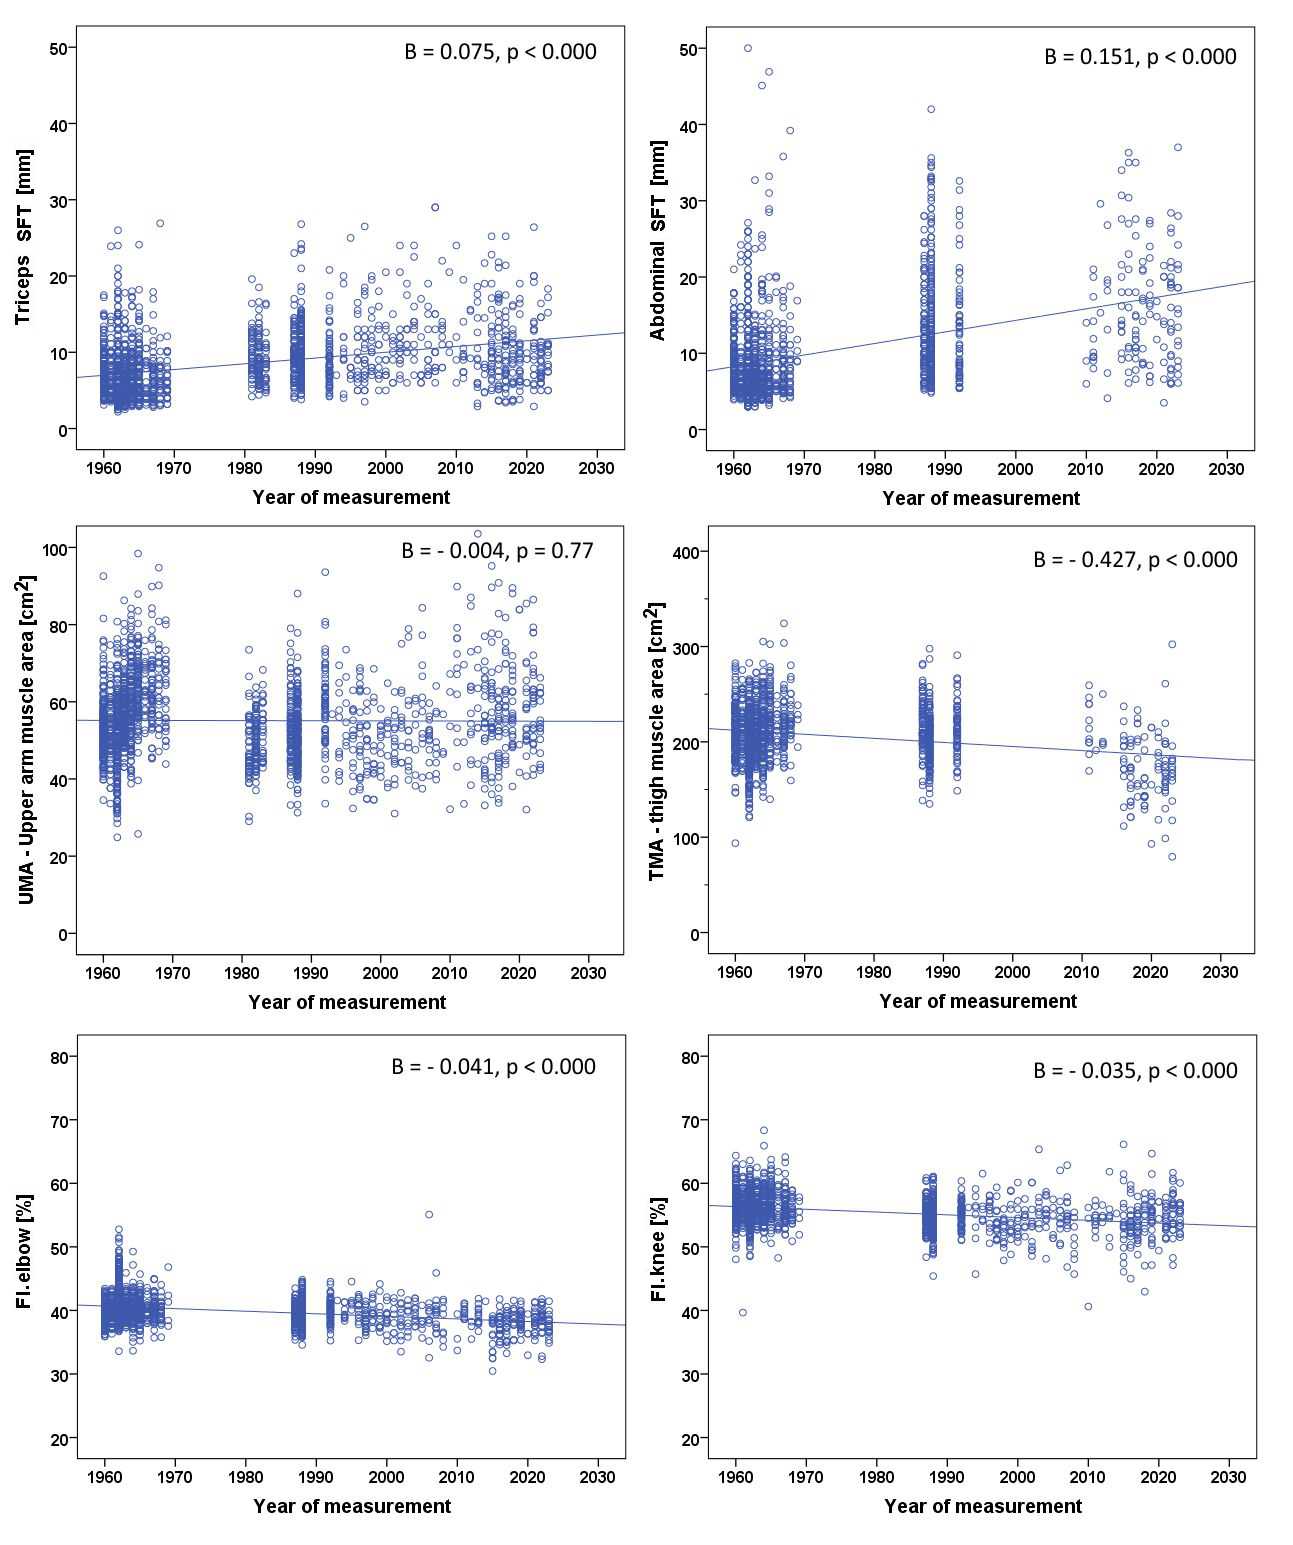
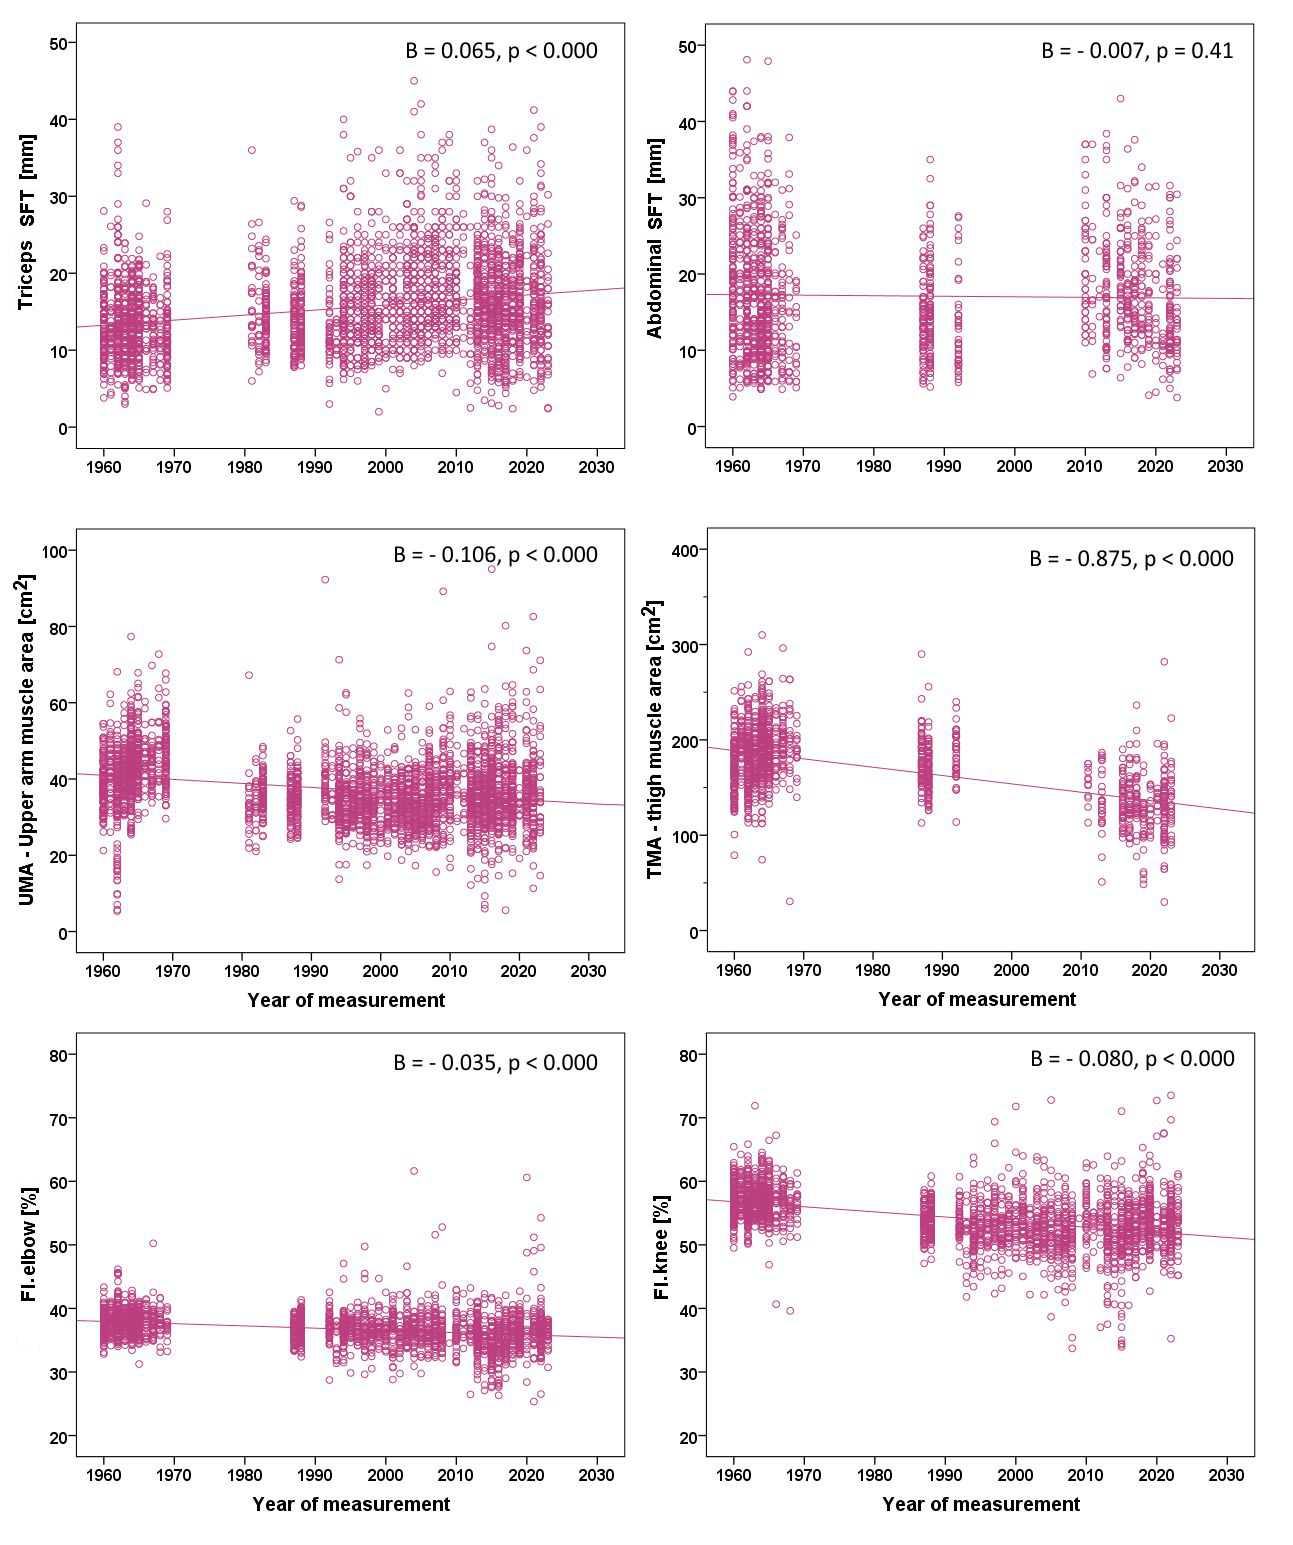
are presented in Figure 1 for males and Figure 2 for females.
The results of multivariate linear regression (enter method) are presented in
Table 7 for males and females, separately. In the
multivariate model, body height had the highest negative correlation with both FI.elbow and
FI.knee in both sexes. In contrast, body mass had the highest positive correlation on both
indices in both sexes. These two variables together explained most of the variance in the
regression model (as seen from the results of a stepwise method).
Table 2 Sex structure of the Slovenian sample.
All subject
Males
Females
Decade
N
N
%
N
%
1960-69
1863
979
53
884
47
1980-89
829
506
61
323
39
1990-99
622
144
23
478
77
2000-09
722
102
14
620
86
2010-19
928
169
18
759
82
2020-23
333
81
24
252
76
N – number of subjects
Table 3 Anthropometric characteristics of the sample by decades for Slovenian males.
Results presented as average (standard deviation.
Time period [years]
1960-69
1980-89
1990-99
2000-09
2010-19
2020-23
Age
[years]
22.0 (1.6)
20.4 (0.6)
21.1 (0.8)
21.5 (1.1)
21.4 (1.4)
21.7 (1.4)
Body height
N
979
506
144
102
169
81
[cm]
175.8 (6.2)
179.1 (6.1)
179.4 (6.8)
180.4 (6.5)
180.5 (6.4)
181.1 (6.6)
Body mass
N
981
506
144
102
165
74
[kg]
70.1 (8.1)
72.8 (8.2)
72.3 (8.9)
75.3 (12.6)
77.3 (13.0)
75.6 (9.9)
Anthropometric characteristics for
assessing overweight/obesity
BMI
N
979
506
144
102
165
74
[kg/m2]
22.7 (2.1)
22.7 (2.2)
22.4 (2.4)
23.1 (3.2)
23.7 (3.5)
23.1 (2.6)
OW/obese
N
122
59
23
24
41
15
according to BMI
[%]
12.5
11.7
16.0
23.5
25.0
20.3
Waist C
N
966
268
88
101
168
81
[cm]
76.3 (5.5)
78.7 (6.2)
79.8 (6.7)
80.5 (8.6)
82.5 (8.6)
80.2 (7.5)
Abdominal SFT
N
942
268
62
/
89
50
[mm]
8.5 (5.2)
13.9 (7.4)
13.3 (6.9)
16.1 (7.7)
15.3 (7.2)
Triceps SFT
N
976
411
144
100
167
67
[mm]
7.0 (3.5)
9.7 (3.4)
9.9 (4.2)
11.7 (4.9)
10.4 (4.9)
10.1 (4.3)
Thigh SFT
N
880
268
63
/
89
49
[mm]
10.3 (5.2)
15.6 (6.3)
13.6 (6.0)
17.2 (8.4)
15.9 (7.2)
Anthropometric characteristics for
assessing lean body mass
Upper arm C
N
980
411
144
101 29.4 (3.1)
164
80
[cm]
28.8 (2.5)
28.6 (2.3)
29.4 (2.8)
29.4 (3.1)
30.4 (3.3)
30.1 (3.0)
Thigh C
N
958
268
62
/
70
62
[cm]
54.5 (4.3)
56.0 (4.2)
56.0 (3.9)
53.1 (5.6)
51.4 (5.1)
UMA
N
974
410
144
100
163
66
[cm2]
56.4 (10.3)
51.4 (7.9)
54.6 (10.8)
52.0 (9.6)
58.2 (13.5)
58.1 (11.8)
TMA
N
879
267
62
/
68
48
[cm2]
209.5 (30.1)
206.1 (26.2)
212.3 (27.4)
183.5 (42.6)
171.7 (38.6)
Anthropometric characteristics for
assessing external skeletal robustness
Width elbow
N
844
269
131
87
122
65
[cm]
7.1 (0.5)
7.1 (0.3)
7.1 (0.4)
7.0 (0.6)
6.9 (0.4)
6.9 (0.4)
Width knee
N
843
269
129
87
118
63
[cm]
9.9 (0.5)
9.8 (0.4)
9.8 (0.5)
9.8 (0.6)
9.7 (0.7)
10.0 (1.4)
FI.elbow
N
841
269
131
87
122
65
[%]
40.5 (2.6)
39.6 (1.9)
39.8 (1.9)
38.9 (2.9)
38.0 (2.1)
38.1 (2.0)
FI.knee
N
840
269
129
87
118
63
[%]
56.3 (2.8)
54.6 (2.5)
54.6 (2.5)
54.3 (3.4)
54.0 (3.7)
55.7 (7.4)
N – number of subjects, BMI – body mass index, OW – overweight, C – circumference, FI –
frame index, SFT – skinfold thickness, TMA – thigh muscle area, UMA – upper arm muscle
area
Table 4 Anthropometric characteristics of the sample by decades for Slovenian females.
Results presented as average (standard deviation).
Time period [years]
1960-69
1980-89
1990-99
2000-09
2010-19
2020-23
Age
[years]
21.9 (1.5)
20.0 (0.5)
21.6 (1.2)
21.7 (1.2)
21.5 (1.5)
21.6 (1.5)
Body height
N
884
323
478
620
759
252
[cm]
163.5 (5.9)
166.2 (6.2)
166.6 (5.9)
166.9 (6.3)
167.1 (5.8)
168.0 (6.5)
Body mass
N
884
322
478
619
738
237
[kg]
59.1 (7.3)
59.1 (7.4)
59.5 (9.1)
61.8 (10.6)
61.8 (9.8)
63.4 (12.5)
Anthropometric characteristics for
assessing overweight/obesity
BMI
N
884
322
478
619
738
237
[kg/m2]
22.1 (2.3)
21.4 (2.3)
21.4 (3.0)
22.2 (3.6)
22.1 (3.2)
22.5 (4.5)
OW/obese
N
101
22
41
98
105
43
according to BMI
[%]
11.4
6.9
8.6
15.9
14.3
18.4
Waist C
N
862
157
156
620
749
241
[cm]
67.4 (5.4)
68.7 (5.5)
69.3 (6.3)
72.7 (8.3)
73.5 (7.7)
71.6 (8.8)
Abdominal SFT
N
771
155
41
/
307
122
[mm]
17.5 (8.4)
14.9 (5.8)
13.1 (6.1)
18.9 (6.7)
15.2 (7.4)
Triceps SFT
N
874
284
478
620
750
199
[mm]
13.4 (4.7)
14.6 (4.6)
15.1 (5.5)
17.7 (6.0)
16.4 (5.8)
16.5 (6.9)
Thigh SFT
N
767
154
41
/
306
123
[mm]
24.9. (8.9)
26.7 (7.0)
23.5 (8.5)
27.0 (8.9)
25.8 (11.4)
Anthropometric characteristics for
assessing lean body mass
Upper arm C
N
881
280
478
620
747
244
[cm]
27.5 (2.5)
(26.1)
26.2 (2.9)
27.1 (3.2)
27.1 (3.0)
27.2 (3.9)
Thigh C
N
813
157
41
/
212
154
[cm]
56.5 (4.2)
55.6 (4.0)
56.2 (4.1)
50.6 (5.1)
49.8 (6.6)
UMA
N
871
278
478
620
742
197
[cm2]
42.1 (8.6)
35.2 (5.8)
35.1 (7.4)
34.4 (7.2)
36.6 (9.4)
36.8 (10.2)
TMA
N
767
153
41
/
180
122
[cm2]
184.8 (31.1)
172.6 (26.1)
185.2 (25.2)
134.6 (29.7)
135.4 (55.7)
Anthropometric characteristics for
assessing external skeletal robustness
Width elbow
N
741
163
299
359
539
175
[cm]
6.2 (0.3)
6.1 (0.4)
6.1 (0.4)
6.1 (0.5)
6.0 (0.5)
6.1 (0.6)
Width knee
N
740
163
299
359
493
175
[cm]
9.3 (0.5)
8.9 (0.5)
8.8 (0.7)
8.8 (0.7)
8.8 (0.8)
9.0 (0.7)
FI.elbow
N
740
163
299
359
539
175
[%]
37.9 (1.9)
37.0 (2.2)
36.8 (2.4)
36.6 (3.0)
35.6 (2.8)
36.6 (4.0)
FI.knee
N
739
163
299
359
493
175
[%]
56.9 (2.9)
53.5 (2.9)
52.8 (3.7)
52.4 (4.3)
52.7 (4.9)
53.5 (4.7)
N – number of subjects, BMI – body mass index, C – circumference, FI.elbow – Frame
index according to elbow width, FI.knee – Frame index according to knee width, SFT –
skinfold thickness, TMA – thigh muscle area, UMA – upper arm muscle area
Table 5 Secular trends of different anthropometric characteristics, presented as results
of a simple linear regression, with the year of measurement as an independent variable
and corresponding dependent variables, for males.
Males
Independent variable
N
B
95% CI
p
R2 adj.
Body height
[cm]
1981
0.099
0.084, 0.113
<0.001
0.085
Body mass
[kg]
1972
0.120
0.099, 0.140
<0.001
0.062
Anthropometric characteristics for
assessing overweight/obesity
BMI
[kg/m2]
1970
0.012
0.006, 0.017
<0.001
0.009
Waist C
[cm]
1672
0.099
0.085, 0.114
<0.001
0.096
Abdominal SFT
[mm]
1410
0.151
0.134, 0.169
<0.001
0.169
Triceps SFT
[mm]
1865
0.075
0.067, 0.084
<0.001
0.130
Thigh SFT
[mm]
1348
0.131
0.113, 0.148
<0.001
0.142
Anthropometric characteristics for
assessing lean body mass
Upper arm C
[cm]
1880
0.024
0.018, 0.030
<0.001
0.033
Thigh C
[cm]
1420v
-0.015
-0.028, -0.002
0.023
0.003
UMA
[cm2]
1857
-0.004
-0.028, 0.021
0.773
0.000
TMA
[cm2]
1322
-0.427
-0.518, -0.336
<0.001
0.060
Anthropometric characteristics for
assessing external skeletal robustness
Width elbow
[cm]
1518
-0.004
-0.005, -0.003
<0.001
0.028
Width knee
[cm]
1509
-0.003
-0.004, -0.002
<0.001
0.011
FI.elbow
[%]
1515
-0.041
-0.046, -0.035
<0.001
0.112
FI.knee
[%]
1506
-0.043
-0.050, -0.036
<0.001
0.091
N – number of subjects, BMI – body mass index, C – circumference, SFT – skinfold
thickness, FI.elbow – Frame index according to elbow width, FI.knee – Frame index
according to knee width, TMA – thigh muscle area, UMA – upper arm muscle area,
R2 adj. – adjusted R squared, B – unstandardized beta, CI – confidence
interval, p – value of statistical significance
Table 6 Secular trend of different anthropometric characteristics presented as results of
simple linear regression with year of measurement as independent variable and each
dependent variable, for females.
Females
Independent variable
N
B
95% CI
p
R2 adj.
Body height
[cm]
3311
0.072
0.062, 0.082
<0.001
0.059
Body mass
[kg]
3273
0.062
0.047, 0.076
<0.001
0.019
Anthropometric characteristics for
assessing overweight/obesity
BMI
[kg/m2]
3273
0.003
-0.002, 0.008
0.357
0.000
Waist C
[cm]
2785
0.111
0.099, 0.112
<0.001
0.107
Abdominal SFT
[mm]
1395
-0.007
-0.024, -0.010
0.408
0.000
Triceps SFT
[mm]
3200
0.065
0.056, 0.075
<0.001
0.057
Thigh SFT
[mm]
1391
0.025
0.005, 0.044
0.012
0.004
Anthropometric characteristics for
assessing lean body mass
Upper arm C
[cm]
3250
-0.004
-0.009, 0.001
0.085
0.001
Thigh C
[cm]
1377
-0.110
-0.120, -0.099
<0.001
0.236
UMA
[cm2]
3185
-0.106
-0.120, -0.092
<0.001
0.063
TMA
[cm2]
1262
-0.875
-0.948, -0.801
<0.001
0.300
Anthropometric characteristics for
assessing external skeletal robustness
Width elbow
[cm]
2271
-0.003
-0.004, -0.002
<0.001
0.025
Width knee
[cm]
2223
-0.010
-0.011, -0.008
<0.001
0.093
FI.elbow
[%]
2270
-0.035
-0.040, -0.031
<0.001
0.084
FI.knee
[%]
2222
-0.080
-0.088, -0.073
<0.001
0.174
N – number of subjects, BMI – body mass index, C – circumference, SFT – skinfold
thickness, FI.elbow – Frame index according to elbow width, FI.knee – Frame index
according to knee width, TMA – thigh muscle area, UMA – upper arm muscle area,
R2 adj. – adjusted R squared, B – unstandardized beta, CI – confidence
interval, p – value of statistical significance
Table 7 Secular trend of different anthropometric characteristics presented as results of
simple linear regression with year of measurement as independent variable and each
dependent variable, for males and females
separately.
Males (N=1464)
Females (N=2160)
B
95% CI
p
B
95% CI
p
FI.elbow
R2 adjusted 0.241,
p<0.0001
R2 adjusted 0.196,
p<0.0001
Body height
[cm]
-0.206
-0.226, -0.186
<0.001
-0.133
-0.152, -0.115
<0.001
Body mass
[kg]
0.147
0.127, 0.168
<0.001
0.062
0.043, 0.082
<0.001
Triceps SFT
[mm]
-0.188
-0.223, -0.154
<0.001
0.010
-0.016, 0.035
0.463
UMA
[cm2]
-0.027
-0.040, -0.014
<0.001
0.057
0.043, 0.071
<0.001
FI.knee
R2 adjusted 0.354,
p<0.0001
R2 adjusted 0.457,
p<0.0001
Body height
[cm]
-0.247
-0.270, -0.223
<0.001
-0.302
-0.331, -0.272
<0.001
Body mass
[kg]
0.108
0.081, 0.134
<0.001
0.107
0.078, 0.136
<0.001
Thigh SFT
[mm]
0.019
0.013, 0.024
<0.001
0.036
0.031, 0.041
<0.001
TMA
[cm2]
-0.004
-0.030, 0.022
0.765
0.072
0.051, 0.094
<0.001
N – number of subjects, TMA – thigh muscle area, UMA – upper arm muscle area, FI.elbow
– Frame index according to elbow width, FI.knee – Frame index according to knee width,
R2 adj. – adjusted R squared, B – unstandardized beta, CI – confidence
interval, p – value of statistical significance
Figure 1 Scatter plots for males showing the correlations between the years of measurements
and the selected dependent variable used as a proxy for body fat (i.e. triceps skinfold
thickness (SFT) and abdomen SFT), muscle mass (i.e. muscle area of upper arm (UMA) and
thigh (TMA)), and external skeletal robustness (i.e. frame index according to elbow
width (FI.elbow) and knee width (FI.knee)). In each plot, the p-value and unstandardized
beta (B) are indicated.
Figure 2 Scatter plots for females showing the correlations between the years of
measurements and the selected dependent variable used as a proxy for body fat (i.e.
triceps skinfold thickness (SFT) and abdomen SFT), muscle mass (i.e. muscle area of
upper arm (UMA) and thigh (TMA)), and external skeletal robustness (i.e. frame index
according to elbow width (FI.elbow) and knee width (FI.knee)). In each plot, the p-value
and unstandardized beta (B) are indicated.
Discussion
According to the results of the present study, we were able to confirm our
first and second hypotheses, as well as the third in part. Regarding the first hypothesis,
the average body height and body fat (as assessed with skinfold thickness and waist
circumference), especially in the abdominal area in males, have increased significantly over
the last 63 years. With respect to the second, external skeletal robustness (as assessed
with frame index) has decreased in the same period. Lastly, concerning the third hypotheses,
external skeletal robustness is negatively associated with body fat, but the most important
factor contributing to the observed decrease in external skeletal robustness over time was
the positive secular trend in body height and total body mass, regardless of source.
Secular trend in body height
Results of the present study revealed significant positive secular trends
in average body height in the Slovenian young adult population from 1960 to 2023 which
confirms the previous findings in the Slovenian young adult population (Robič Pikel 2022; Robič Pikel et al. 2023), as well as the children’s and adolescents’ population
(Đurić et al. 2021). The observed significant
increase in body height is in line with the situation in other developed countries
worldwide (Fudvoye and Parent 2017; NCD Risk Factor Collaboration 2016). Although a
comprehensive comparison of changes in body height between our and other studies was not
the scope of the present study, we nevertheless made some comparisons with other similar
studies. For example, the observed increase in body height for 1.0cm per decade in males
is comparable to approximately 0.9cm increase in body height per decade in the study of
Kirchengast et al. (Kirchengast et al. 2023) in
Austrian male conscripts between 1951 and 2002, and smaller than 1.4cm increase in body
height per decade in Polish male students between 1959 to 2011 (Kalka et al. 2019), as well as with 1.7cm increase in body height per
decade in Polish male conscripts between 1965 and 2010 (Kołodziej et al. 2015). For females, the observed increase in body height for
0.7cm per decade in our study was lower than the 1.34cm increase in body height per decade
reported by Łopuszańska-Dawid & Szklarska (Łopuszańska-Dawid and Szklarska 2020) in Polish adults between 1931 and 2020.
Despite a continuous increase in average body height in our study, the rate of this
increase varied over time. In our study, the most significant increase in average body
height was observed in the decades 1980-89, 2000-10, and 2020-23. Such a rapid change in
height over decades was also observed in other studies mentioned above (Kołodziej et al. 2015; Kalka et al. 2019; Kirchengast
et al. 2023; Łopuszańska-Dawid and Szklarska
2020; Negasheva et al. 2024). Some
studies showed that the average body height stabilised by 2000 in some populations, i.e.
in Polish women (Łopuszańska-Dawid and Szklarska
2020) and in the Russian population (Negasheva
et al. 2024) which was also observed in our study. It should be noted that the
significant increase in average body height in the decade 2020-23 observed in the present
study has been, to a greater extent, attributed to the introduction of a methodological
change related to body height measurements according ISAK standard. Namely, since 2020, a
stretched body height has been measured, in contrast to previous non-stretched
measurements performed according to Lohman et al. (Lohman 1988). According to a pilot comparison on a subsample (N=60), the average
difference between the two measurements of body height was 0.7 (0.4) in 2023 (unpublished
results), thus an increase of 0.7cm, on average, in body height since 2020 can be
attributed to a methodological change and the rest to the actual change in body
height.
Since changes in physical growth are multidimensional and can be influenced
by many factors (socio-economic-political-emotional) (Bogin 2021b), such a result is not surprising. Over the last six decades,
Slovenian students have undergone a transition in their environment – from living in
Yugoslavia, a country with a state-owned economy, with limited access to global markets
(Ferfila 2010) and thus inaccessibility to such
a diverse range of food as nowadays (which includes inaccessibility of highly processed
food in the past), to the opposite. Namely, Slovenia, a member of the European Union since
2007, has a global market economy with easy access to a wide range of foods – including
those containing excessive amounts of sugar and fat. Although the relationship between the
average body height and socio-economic development was not analysed in our study, this was
observed in a study of Negasheva et al. (Negasheva
et al. 2024) on Russian adolescents/young adults.
Secular trends in body fat and muscle area
Our results revealed that the increase in average body height was
accompanied by a positive trend in average body mass over the same period (1.2kg and 0.6kg
per decade for males and females, respectively). However, the observed increase was due to
an excessive accumulation of body fat (assessed with SFT) and decrease in muscle area
(assessed with UMA and TMA) (especially in females). The positive trend in accumulation of
body fat (especially abdominal fat) and decrease in muscle mass is worrying, as it has a
negative impact on health, as it can result in metabolic syndrome and insulin resistance
even in normal-weight obese young adults (Madeira et al.
2013). In the long term, individuals with normal-weight central obesity had the
worst long-term survival rate (Sahakyan et al.
2015) which should be a major cause for concern.
Our results demonstrated a significant increase in the accumulation of body
fat in the abdominal area (which was particularly evident from the measure of waist
circumference), although in females the average BMI has not changed significantly over
time. However, the prevalence of overweight/obesity (according to BMI) increased in both
sexes for approximately 8% in males and 4% females, reaching 20.3% and 18.4% in males and
females, respectively, in the 2020-23 decade. These results are comparable with those of
other countries worldwide. In 19-year-old Polish males, the average BMI increased from
21.7kg/m2 (in the year 1965) to 22.9kg/m2 (in the year 2010), which is still within the
normal BMI range (Lipowicz et al. 2015). However,
the authors demonstrated, that the prevalence of overweight/obesity (according to BMI)
increased from 5.4% to 22.9% over the same period. Furthermore, abdominal obesity (as
assessed with waist circumference) increased in both normal weight and overweight adults
in the US between 1988 and 2010 (Ladabaum et al.
2014), as well as in Chinese adults between 1993 and 2015 (Sun et al. 2021). In addition, Ladabaum et al. (Ladabaum et al. 2014) associated these findings to an increased
prevalence of leisure-time physical inactivity, without a significant change in daily
caloric intake. In contrast, the study by Brown et al. (Brown et al. 2016), based on NHANES data, found an overall increase in both the
caloric intake and self-reported leisure-time physical activity in adults in the US
between 1972 and 2008, while an increase in obesity was observed over the same period.
Yet, the authors were unable to demonstrate any direct relationships between the caloric
intake or leisure-time physical activity and increases in BMI over time (Brown et al. 2016).
In contrast to the increase in body fat in our sample, results of this
study showed a decrease in muscle area, particularly in the legs (TMA) in both sexes and
in the arms (UMA) in females. To our knowledge, there are no comparable studies in young
adults examining the secular trend in UMA and TMA to compare them with our results.
However, the study by Stachoń et al. (Stachoń et al.
2012) on the physique of Polish students according to somatotype components
demonstrated different results than our present study. According to Stachoń et al. (Stachoń et al. 2012), between 1967 and 2008, the
muscle component (mesomorphy) increased in males, while the fat component (endomorphy) did
not change. In females, the muscle component remained at a similar level, while the fat
component decreased (Stachoń et al. 2012). It is
worth noting that the study by Stachoń et al. (Stachoń
et al. 2012) was conducted on students from the University School of Physical
Education, who may not be representative of the general population, which could be the
reason for the discrepancy between their and our results. The study of Đurić et al. (Đurić et al. 2021) in Slovenian children and
adolescents (aged 6 to 19) showed that leg muscle power declined over the decades (from
1983 to 2014) in both sexes, which supports the results of muscle area reduction observed
in our study. In contrast, arm muscle strength increased over decades in the oldest group
(15–19 years) (Đurić et al. 2021). Trends in the
amount of moderate to vigorous physical activity (PA) from the Health Behaviour in
School-aged Children data from 2002 to 2010 (Kalman
et al. 2015) showed a negative trend in Slovenian males and no trend in Slovenian
females over the investigated period, which could partly explain the decrease in muscle
area in both sexes. Unfortunately, no studies on the secular trend of sports type in young
adults (students) have been conducted in the Slovenian population, which might potentially
explain the simultaneous decrease in TMA and increase in UMA in males in our sample (or,
equivocally, the decrease in leg muscle power and the increase in arm muscle power in the
study conducted by Đurić et al. (Đurić et al.
2021)).
Methodological issue associated with the use of BMI
It should be noted that the results of this study point to a methodological
issue associated with the use of BMI to assess overweight/obesity in secular trend
analyses. In our study, a significant positive secular trend in overweight/obesity in
Slovenian young adults was confirmed for most measures used to assess overweight/obesity,
such as triceps SFT, abdominal SFT, and thigh SFT, as well as waist C, but not for BMI.
Although BMI is commonly used for this purpose, it was not sensitive enough to detect a
statistically significant increase in body fat over time, when compared to other measures
used in the present study, specifically, SFTs and waist C. The discrepancy could be due to
several factors, such as an increase in the subjects’ height along with body mass over the
generations studied, changes in physical activity or diet. Namely, since BMI does not
distinguish between body fat mass and lean body mass, it remained relatively unchanged
despite the increase in body fat mass of the subjects. Therefore, the results of the
present study point to the use of alternative anthropometric measures to BMI for the
assessment of obesity risk in a population, thus measures that are more sensitive in
detecting an increased accumulation of peripheral or abdominal fat. According to the
results of our present and previous (Zdesar Kotnik and
Golja 2012) study, as well as studies by Kryst et al. (Kryst et al. 2016) and Sun et al. (Sun et al. 2021), waist C is emphasised (in addition to BMI) as a recommended
screening tool for abdominal obesity in secular trend analyses. Using waist C as a proxy
for obesity has an additional advantage, as the accumulation of abdominal fat has been
shown to lead to more severe health problems, as compared to the accumulation of
peripheral fat (Choi et al. 2019).
Secular trend in external skeletal robustness
In our study, the external skeletal robustness (assessed with the Frame
Index) decreased over the last six decades in young Slovenian adults. There are no similar
studies in adults, with which our results could be compared. However, a few studies
conducted in children and adolescents on secular trends of external skeletal robustness
also showed a decrease in frame index over decades. Namely, this was observed in
Argentinian children aged 6 to 14 years between 2001-06 and 2010-16 (Navazo et al. 2020), in German and Russian children aged 6 to 10
years between 2000 and 2010 (Rietsch et al.
2013a), in German children and adolescents aged 3 to 18 years between 1980 and 2012
(Scheffler and Hermanussen 2014). Different
studies suggested different associations for poorer/greater external skeletal robustness.
First, most studies found a positive association between BFP and the external skeletal
robustness as measured with the body frame size (Martinez et al. 1995; Leonard et al.
2004; Musálek et al. 2018; La Guzmán-de Garza et al. 2017; Rietsch et al. 2013a; Vispute
et al. 2023; Lizana and Hormazabal-Peralta
2020), while others found the opposite (Musálek
et al. 2018; Scheffler 2010). Similarly,
a systematic review and meta-analysis by Deng et al. (Deng et al. 2021), which focused on bone mineral density, showed a negative
effect of BFP on bone mineral density. Second, the same review (Deng et al. 2021) showed that higher lean body mass is associated
with higher bone mineral density. Third, a study by Glauber et al. (Glauber et al. 1995) on US adults demonstrated that the most
important factor (besides BFP assessed with bioimpedance analysis and waist-to-hip ratio)
associated with higher bone mineral density, was body mass, especially for the
mass-bearing bones. Our results are partially consistent with the latter. In our
multivariate regression model, body height and body mass together explained most of the
variance of external skeletal robustness, with body height having the highest negative
correlation with FI.elbow and FI.knee, and body mass having the highest positive
correlation with both indices in both sexes. The observed decrease of external skeletal
robustness in our sample can at least partly be explained with a decrease in muscle mass
due to reduced physical activity, which, in combination with adequate nutrition, is the
most important factor for building healthy strong bones (Proia et al. 2021). However, data on bone mineral density would be more accurate
for studying the effects of physical activity (or body fat) on skeletal robustness.
The results of the present study suggest that significant changes in the
economy and lifestyle in Slovenia are reflected in changes in body dimensions and body
composition of university students. We observed a significant increase in body height and
body fat accumulation (both peripheral and abdominal). Concurrently, there is a documented
decrease in muscle area, particularly in the legs, and in external skeletal robustness. It
is now well established that changes in body composition, such as the accumulation of body
fat and the decrease in muscle mass due to physical inactivity, increase health risks even
in young adults in normal-weight category according to BMI (but obese according to BFP)
(Bowden Davies et al. 2019; Correa-Rodríguez et al. 2020).
Some limitations of the study should, of course, also be noted. Firstly,
different measurements are missing for different time periods, so the sample size is
rather small for some decades. Secondly, measuring devices changed over the years
(different devices from different manufacturers were used) and different examiners were
responsible for the measurements over time, which was inevitable due to the comprehensive
longitudinal aspect of data collection. However, since each examiner was trained directly
by his or her predecessor, the inter-examiner variability must have been significantly
reduced. Finally, regarding the representativeness of the sample, our department is the
only one of its kind in Slovenia, so the students participating in our program (and thus
in the present study) came from all over the country, from both rural and urban areas.
Furthermore, no selection was made based on students’ physical abilities prior to their
enrolment. Therefore, it seems reasonable to believe, that the results of the present
study can indeed be considered representative for the population of university students in
Slovenia. We therefore believe that although our study may not have been able to describe
the changes in anthropometric characteristics for the whole young adult’s country
population, it did manage to describe the changes occurring over the last six decades in
our country in the student population with scientific credibility. Moreover, the data
presented come from six different decades and provide a rare insight into the
anthropometric characteristics and their secular trends in young adults from a
transitional society. They also demonstrate the influence of anthropometric
characteristics on the external skeletal robustness, which has so far been only studied in
children and adolescents.
Conclusions
Over the past six decades positive secular trends include an increase in body
height and an accumulation of body fat, while negative secular trends include a decrease in
muscle mass and external skeletal robustness in Slovenian young adults (students). These
changes appear to have parallel but possibly independent patterns in the broader context of
secular trends in body characteristics. The observed changes can be attributed to the
economic transition to a global market with easy access to a wide range of foods, including
those containing excessive amounts of sugar, and changes in lifestyle from more active to
more sedentary in recent decades. In particular, the simultaneous increase in SFT as proxy
of body fat and decrease in UMA and TMA as proxy of muscle mass in young adults is of great
concern. It is crucial to address these effects together, as they both increase health risks
already in young adults. Immediate actions and interventions in lifestyle changes should be
implemented to reverse these trends. Furthermore, the results of the present study emphasise
the importance of monitoring obesity with a measure such as waist circumference in addition
to BMI, as BMI fails to exert sufficient sensitivity for the detection of
overweight/obesity.
Acknowledgements
The authors thank all the participants and all the researchers of the
previous studies who performed the anthropometric measurements. The authors’ contributions
are as follows: T.R.P. and K.Z.K. contributed to establishing the electronic database and
the cleaning of the data. K.Z.K. and P.G. were responsible for the statistical analysis and
interpreting the results. K.Z.K, P.G, and T.R.P. were responsible for manuscript writing,
and editing.
Special thanks go to PD Dr. Christiane Scheffler, Prof. Dr. Michael
Hermanussen, and Dr. Detlef Groth who organized and led the 6th Summer School “Human Growth
and Development – Data Analysis and Statistics” in Gülpe (Brandenburg, Germany), 2023. They
supported the work on this manuscript from start to finish. The Summer School was supported
by a KoUP funding of University of Potsdam.
References
Afshin, A./Forouzanfar, M. H./Reitsma, M. B./Sur,
P./Estep, K./Lee, A./Marczak, L./Mokdad, A. H./Moradi-Lakeh, M./Naghavi, M./Salama, J.
S./Vos, T./Abate, K. H./Abbafati, C./Ahmed, M. B./Al-Aly, Z./Alkerwi, A./Al-Raddadi,
R./Amare, A. T./Amberbir, A./Amegah, A. K./Amini, E./Amrock, S. M./Anjana, R. M./Ärnlöv,
J./Asayesh, H./Banerjee, A./Barac, A./Baye, E./Bennett, D. A./Beyene, A. S./Biadgilign,
S./Biryukov, S./Bjertness, E./Boneya, D. J./Campos-Nonato, I./Carrero, J. J./Cecilio,
P./Cercy, K./Ciobanu, L. G./Cornaby, L./Damtew, S. A./Dandona, L./Dandona,
R./Dharmaratne, S. D./Duncan, B. B./Eshrati, B./Esteghamati, A./Feigin, V. L./Fernandes,
J. C./Fürst, T./Gebrehiwot, T. T./Gold, A./Gona, P. N./Goto, A./Habtewold, T. D./Hadush,
K. T./Hafezi-Nejad, N./Hay, S. I./Horino, M./Islami, F./Kamal, R./Kasaeian,
A./Katikireddi, S. V./Kengne, A. P./Kesavachandran, C. N./Khader, Y. S./Khang,
Y.-H./Khubchandani, J./Kim, D./Kim, Y. J./Kinfu, Y./Kosen, S./Ku, T./Defo, B. K./Kumar,
G. A./Larson, H. J./Leinsalu, M./Liang, X./Lim, S. S./Liu, P./Lopez, A. D./Lozano,
R./Majeed, A./Malekzadeh, R./Malta, D. C./Mazidi, M./McAlinden, C./McGarvey, S.
T./Mengistu, D. T./Mensah, G. A./Mensink, G. B. M./Mezgebe, H. B./Mirrakhimov, E.
M./Mueller, U. O./Noubiap, J. J./Obermeyer, C. M./Ogbo, F. A./Owolabi, M. O./Patton, G.
C./Pourmalek, F./Qorbani, M./Rafay, A./Rai, R. K./Ranabhat, C. L./Reinig, N./Safiri,
S./Salomon, J. A./Sanabria, J. R./Santos, I. S./Sartorius, B./Sawhney, M./Schmidhuber,
J./Schutte, A. E./Schmidt, M. I./Sepanlou, S. G./Shamsizadeh, M./Sheikhbahaei, S./Shin,
M.-J./Shiri, R./Shiue, I./Roba, H. S./Silva, D. A. S./Silverberg, J. I./Singh, J.
A./Stranges, S./Swaminathan, S./Tabarés-Seisdedos, R./Tadese, F./Tedla, B. A./Tegegne,
B. S./Terkawi, A. S./Thakur, J. S./Tonelli, M./Topor-Madry, R./Tyrovolas, S./Ukwaja, K.
N./Uthman, O. A./Vaezghasemi, M./Vasankari, T./Vlassov, V. V./Vollset, S. E./Weiderpass,
E./Werdecker, A./Wesana, J./Westerman, R./Yano, Y./Yonemoto, N./Yonga, G./Zaidi,
Z./Zenebe, Z. M./Zipkin, B./Murray, C. J. L. (2017). Health effects of overweight and
obesity in 195 countries over 25 years. The New England Journal of Medicine 377 (1),
13–27. https://doi.org/10.1056/NEJMoa1614362.
Behringer, M./Gruetzner, S./McCourt, M./Mester, J.
(2014). Effects of weight-bearing activities on bone mineral content and density in
children and adolescents: a meta-analysis. Journal of Bone and Mineral Research 29 (2),
467–478. https://doi.org/10.1002/jbmr.2036.
Bogin, B. (2021a). Patterns of human growth.
Cambridge, United Kingdom/New York, NY, USA/Port Melbourne, Australia/New Delhi,
India/Singapore, Cambridge University Press.
Bogin, B. (2021b).
Social-Economic-Political-Emotional (SEPE) factors regulate human growth. Human Biology
and Public Health 1. https://doi.org/10.52905/hbph.v1.10.
Bogin, B./Hermanussen, M./Scheffler, C. (2018). As
tall as my peers - similarity in body height between migrants and hosts.
Anthropologischer Anzeiger 74 (5), 365–376. https://doi.org/10.1127/anthranz/2018/0828.
Bowden Davies, K. A./Pickles, S./Sprung, V.
S./Kemp, G. J./Alam, U./Moore, D. R./Tahrani, A. A./Cuthbertson, D. J. (2019). Reduced
physical activity in young and older adults: metabolic and musculoskeletal implications.
Therapeutic Advances in Endocrinology and Metabolism 10, 2042018819888824. https://doi.org/10.1177/2042018819888824.
Brown, R. E./Sharma, A. M./Ardern, C.
I./Mirdamadi, P./Mirdamadi, P./Kuk, J. L. (2016). Secular differences in the association
between caloric intake, macronutrient intake, and physical activity with obesity.
Obesity Research & Clinical Practice 10 (3), 243–255. https://doi.org/10.1016/j.orcp.2015.08.007.
Chen, T. J./Ji, C. Y. (2013). Secular change in
stature of urban Chinese children and adolescents, 1985-2010. Biomedical and
Environmental Sciences 26 (1), 13–22. https://doi.org/10.3967/0895-3988.2013.01.002.
Choi, D./Choi, S./Son, J. S./Oh, S. W./Park, S. M.
(2019). Impact of discrepancies in general and abdominal obesity on major adverse
cardiac events. Journal of the American Heart Association 8 (18), e013471. https://doi.org/10.1161/JAHA.119.013471.
Chumlea, W. C./Wisemandle, W./Guo, S.
S./Siervogel, R. M. (2002). Relations between frame size and body composition and bone
mineral status. The American Journal of Clinical Nutrition 75 (6), 1012–1016. https://doi.org/10.1093/ajcn/75.6.1012.
Correa-Rodríguez, M./González-Ruíz,
K./Rincón-Pabón, D./Izquierdo, M./García-Hermoso, A./Agostinis-Sobrinho,
C./Sánchez-Capacho, N./Roa-Cubaque, M. A./Ramírez-Vélez, R. (2020). Normal-weight
obesity is associated with increased cardiometabolic risk in young adults. Nutrients 12
(4). https://doi.org/10.3390/nu12041106.
Deng, K.-L./Yang, W.-Y./Hou, J.-L./Li, H./Feng,
H./Xiao, S.-M. (2021). Association between body composition and bone mineral density in
children and adolescents: A systematic review and meta-analysis. International Journal
of Environmental Research and Public Health 18 (22). https://doi.org/10.3390/ijerph182212126.
Đurić, S./Sember, V./Starc, G./Sorić, M./Kovač,
M./Jurak, G. (2021). Secular trends in muscular fitness from 1983 to 2014 among
Slovenian children and adolescents. Scandinavian Journal of Medicine & Science in
Sports 31 (9), 1853–1861. https://doi.org/10.1111/sms.13981.
Ferfila, B. (2010). Slovenia's transition. From
medieval roots to the European Union. Lanham, Lexington Books.
Finucane, M. M./Stevens, G. A./Cowan, M.
J./Danaei, G./Lin, J. K./Paciorek, C. J./Singh, G. M./Gutierrez, H. R./Lu, Y./Bahalim,
A. N./Farzadfar, F./Riley, L. M./Ezzati, M. (2011). National, regional, and global
trends in body-mass index since 1980: systematic analysis of health examination surveys
and epidemiological studies with 960 country-years and 9·1 million participants. Lancet
377 (9765), 557–567. https://doi.org/10.1016/S0140-6736(10)62037-5.
Frisancho, A. R. (1990). Anthropometric standards
for the assessment of growth and nutritional status. Ann Arbor, University of Michigan
Press.
Garrido-Miguel, M./Cavero-Redondo,
I./Álvarez-Bueno, C./Rodríguez-Artalejo, F./Moreno, L. A./Ruiz, J. R./Ahrens,
W./Martínez-Vizcaíno, V. (2019). Prevalence and trends of overweight and obesity in
European children rom 1999 to 2016: A systematic review and meta-analysis. JAMA
Pediatrics 173 (10), e192430. https://doi.org/10.1001/jamapediatrics.2019.2430.
Glauber, H. S./Vollmer, W. M./Nevitt, M.
C./Ensrud, K. E./Orwoll, E. S. (1995). Body weight versus body fat distribution,
adiposity, and frame size as predictors of bone density. The Journal of Clinical
Endocrinology and Metabolism 80 (4), 1118–1123. https://doi.org/10.1210/jcem.80.4.7714079.
Golja, P./Robič Pikel, T. (2021). BAM – (data)base
of anthropometric measurements. Anthropological Notebooks (1), 9–13. https://doi.org/10.5281/ZENODO.5759827.
González-Álvarez, M. A./Lázaro-Alquézar,
A./Simón-Fernández, M. B. (2020). Global trends in child obesity: Are figures
converging? International Journal of Environmental Research and Public Health 17 (24).
https://doi.org/10.3390/ijerph17249252.
Guimarey, L. M./Castro, L. E./Torres, M.
F./Cesani, M. F./Luis, M. A./Quintero, F. A./Oyhenart, E. E. (2014). Secular changes in
body size and body composition in schoolchildren from La Plata City (Argentina).
Anthropologischer Anzeiger 71 (3), 287–301. https://doi.org/10.1127/0003-5548/2014/0364.
Hermanussen, M./Scheffler, C. (2016). Stature
signals status: The association of stature, status and perceived dominance - a thought
experiment. Anthropologischer Anzeiger 73 (4), 265–274. https://doi.org/10.1127/anthranz/2016/0698.
IBM Corp. (2022). IBM SPSS Statistics for Windows,
Version 29.0. Armonk, NY, IBM Corp.
Jeddi, M./Dabbaghmanesh, M. H./Ranjbar Omrani,
G./Ayatollahi, S. M. T./Bagheri, Z./Bakhshayeshkaram, M. (2015). Relative importance of
lean and fat mass on bone mineral density in Iranian children and adolescents.
International Journal of Endocrinology and Metabolism 13 (3), e25542. https://doi.org/10.5812/ijem.25542v2.
Kalka, E./Pastuszak, A./Buśko, K. (2019). Secular
trends in body height, body weight, BMI and fat percentage in Polish university students
in a period of 50 years. PloS One 14 (8), e0220514. https://doi.org/10.1371/journal.pone.0220514.
Kalman, M./Inchley, J./Sigmundova, D./Iannotti, R.
J./Tynjälä, J. A./Hamrik, Z./Haug, E./Bucksch, J. (2015). Secular trends in
moderate-to-vigorous physical activity in 32 countries from 2002 to 2010: a
cross-national perspective. European Journal of Public Health 25 Suppl 2, 37–40.
https://doi.org/10.1093/eurpub/ckv024.
Kirchengast, S./Juan, A./Waldhoer, T./Yang, L.
(2023). An increase in the developmental tempo affects the secular trend in height in
male Austrian conscripts birth cohorts 1951-2002. American Journal of Human Biology 35
(4), e23848. https://doi.org/10.1002/ajhb.23848.
Kołodziej, H./Łopuszańska, M./Lipowicz,
A./Szklarska, A./Bielicki, T. (2015). Secular trends in body height and body mass in
19-year-old Polish men based on six national surveys from 1965 to 2010. American Journal
of Human Biology 27 (5), 704–709. https://doi.org/10.1002/ajhb.22694.
Kryst, Ł./Woronkowicz, A./Kowal, M./Pilecki, M.
W./Sobiecki, J. (2016). Abdominal obesity screening tools in the aspects of secular
trend. Anthropologischer Anzeiger 73 (4), 295–312. https://doi.org/10.1127/anthranz/2016/0622.
Kryst, Ł./Żegleń, M./Woronkowicz, A./Kowal, M.
(2021). Skeletal and muscular robustness and physical fitness of Polish children and
adolescents (3-18 years) with normal weight and overweight/obesity. Anthropologischer
Anzeiger. https://doi.org/10.1127/anthranz/2021/1389.
La Guzman-de Garza, F. J./Cerino Peñaloza, M.
S./García Leal, M./Salinas Martínez, A. M./Alvarez Villalobos, N. A./Cordero Franco, H.
F. (2022). Anthropometric parameters to estimate body frame size in children and
adolescents: A systematic review. American Journal of Human Biology 34 (6), e23720.
https://doi.org/10.1002/ajhb.23720.
La Guzmán-de Garza, F. J./González Ayala, A.
E./Gómez Nava, M./Martínez Monsiváis, L. I./Salinas Martínez, A. M./Ramírez López,
E./Mathiew Quirós, A./Garcia Quintanilla, F. (2017). Body frame size in school children
is related to the amount of adipose tissue in different depots but not to adipose
distribution. American Journal of Human Biology 29 (5). https://doi.org/10.1002/ajhb.23014.
Ladabaum, U./Mannalithara, A./Myer, P. A./Singh,
G. (2014). Obesity, abdominal obesity, physical activity, and caloric intake in US
adults: 1988 to 2010. The American Journal of Medicine 127 (8), 717-727.e12. https://doi.org/10.1016/j.amjmed.2014.02.026.
Leonard, M. B./Shults, J./Wilson, B.
A./Tershakovec, A. M./Zemel, B. S. (2004). Obesity during childhood and adolescence
augments bone mass and bone dimensions. The American Journal of Clinical Nutrition 80
(2), 514–523. https://doi.org/10.1093/ajcn/80.2.514.
Lipowicz, A./Łopuszańska, M./Kołodziej,
H./Szklarska, A./Bielicki, T. (2015). Secular trends in BMI and the prevalence of
obesity in young Polish males from 1965 to 2010. European Journal of Public Health 25
(2), 279–282. https://doi.org/10.1093/eurpub/cku182.
Lizana, P. A./Hormazabal-Peralta, A. (2020).
External skeletal robustness and adiposity in adolescents of low socioeconomic status: A
cross-sectional analysis of body composition. American Journal of Human Biology 32 (3),
e23346. https://doi.org/10.1002/ajhb.23346.
Lohman, Timothy G. (Ed.) (1988). Anthropometric
standardization reference manual. Champaign, Human Kinetics Publishers.
Łopuszańska-Dawid, M./Szklarska, A. (2020). Growth
change in Polish women: Reduction of the secular trends? PloS One 15 (11), e0242074.
https://doi.org/10.1371/journal.pone.0242074.
Madeira, F. B./Silva, A. A./Veloso, H. F./Goldani,
M. Z./Kac, G./Cardoso, V. C./Bettiol, H./Barbieri, M. A. (2013). Normal weight obesity
is associated with metabolic syndrome and insulin resistance in young adults from a
middle-income country. PloS One 8 (3), e60673. https://doi.org/10.1371/journal.pone.0060673.
Martinez, E./Bacallao, J./Devesa, M./Amador, M.
(1995). Relationship between frame size and fatness in children and adolescents.
American Journal of Human Biology 7 (1), 1–6. https://doi.org/10.1002/ajhb.1310070102.
Musálek, M./Pařízková, J./Godina, E./Bondareva,
E./Kokštejn, J./Jírovec, J./Vokounová, Š. (2018). Poor skeletal robustness on lower
extremities and weak lean mass development on upper arm and calf: Normal weight obesity
in middle-school-aged children (9 to 12). Frontiers in Pediatrics 6, 371. https://doi.org/10.3389/fped.2018.00371.
Navazo, B./Oyhenart, E./Dahinten, S./Mumm,
R./Scheffler, C. (2020). Decrease of external skeletal robustness (Frame Index) between
two cohorts of school children living in Puerto Madryn, Argentina at the beginning of
the 21st century. Anthropologischer Anzeiger 77 (5), 405–413. https://doi.org/10.1127/anthranz/2020/1182.
Negasheva, M. A./Khafizova, A. A./Movsesian, A. A.
(2024). Secular trends in height, weight, and body mass index in the context of economic
and political transformations in Russia from 1885 to 2021. American Journal of Human
Biology 36 (2), e23992. https://doi.org/10.1002/ajhb.23992.
Ng, M./Fleming, T./Robinson, M./Thomson,
B./Graetz, N./Margono, C./Mullany, E. C./Biryukov, S./Abbafati, C./Abera, S. F./Abraham,
J. P./Abu-Rmeileh, N. M. E./Achoki, T./AlBuhairan, F. S./Alemu, Z. A./Alfonso, R./Ali,
M. K./Ali, R./Guzman, N. A./Ammar, W./Anwari, P./Banerjee, A./Barquera, S./Basu,
S./Bennett, D. A./Bhutta, Z./Blore, J./Cabral, N./Nonato, I. C./Chang, J.-C./Chowdhury,
R./Courville, K. J./Criqui, M. H./Cundiff, D. K./Dabhadkar, K. C./Dandona, L./Davis,
A./Dayama, A./Dharmaratne, S. D./Ding, E. L./Durrani, A. M./Esteghamati, A./Farzadfar,
F./Fay, D. F. J./Feigin, V. L./Flaxman, A./Forouzanfar, M. H./Goto, A./Green, M.
A./Gupta, R./Hafezi-Nejad, N./Hankey, G. J./Harewood, H. C./Havmoeller, R./Hay,
S./Hernandez, L./Husseini, A./Idrisov, B. T./Ikeda, N./Islami, F./Jahangir, E./Jassal,
S. K./Jee, S. H./Jeffreys, M./Jonas, J. B./Kabagambe, E. K./Khalifa, S. E. A. H./Kengne,
A. P./Khader, Y. S./Khang, Y.-H./Kim, D./Kimokoti, R. W./Kinge, J. M./Kokubo, Y./Kosen,
S./Kwan, G./Lai, T./Leinsalu, M./Li, Y./Liang, X./Liu, S./Logroscino, G./Lotufo, P.
A./Lu, Y./Ma, J./Mainoo, N. K./Mensah, G. A./Merriman, T. R./Mokdad, A. H./Moschandreas,
J./Naghavi, M./Naheed, A./Nand, D./Narayan, K. M. V./Nelson, E. L./Neuhouser, M.
L./Nisar, M. I./Ohkubo, T./Oti, S. O./Pedroza, A./Prabhakaran, D./Roy, N./Sampson,
U./Seo, H./Sepanlou, S. G./Shibuya, K./Shiri, R./Shiue, I./Singh, G. M./Singh, J.
A./Skirbekk, V./Stapelberg, N. J. C./Sturua, L./Sykes, B. L./Tobias, M./Tran, B.
X./Trasande, L./Toyoshima, H./van de Vijver, S./Vasankari, T. J./Veerman, J.
L./Velasquez-Melendez, G./Vlassov, V. V./Vollset, S. E./Vos, T./Wang, C./Wang,
X./Weiderpass, E./Werdecker, A./Wright, J. L./Yang, Y. C./Yatsuya, H./Yoon, J./Yoon,
S.-J./Zhao, Y./Zhou, M./Zhu, S./Lopez, A. D./Murray, C. J. L./Gakidou, E. (2014).
Global, regional, and national prevalence of overweight and obesity in children and
adults during 1980-2013: a systematic analysis for the Global Burden of Disease Study
2013. Lancet 384 (9945), 766–781. https://doi.org/10.1016/S0140-6736(14)60460-8.
Olds, T. S. (2009). One million skinfolds: secular
trends in the fatness of young people 1951-2004. European Journal of Clinical Nutrition
63 (8), 934–946. https://doi.org/10.1038/ejcn.2009.7.
Proia, P./Amato, A./Drid, P./Korovljev, D./Vasto,
S./Baldassano, S. (2021). The impact of diet and physical activity on bone health in
children and adolescents. Frontiers in Endocrinology 12, 704647. https://doi.org/10.3389/fendo.2021.704647.
Quetelet, L. A. (1869 (reprint 2018)). Sur l'homme
et le développement de ses facultés, ou Essai de physique sociale (ang. On Man and the
Development of His Faculties, or An Essay on Social Physics). Wentworth
Press.
Rietsch, K./Eccard, J. A./Scheffler, C. (2013a).
Decreased external skeletal robustness due to reduced physical activity? American
Journal of Human Biology 25 (3), 404–410. https://doi.org/10.1002/ajhb.22389.
Rietsch, K./Godina, E./Scheffler, C. (2013b).
Decreased external skeletal robustness in schoolchildren--a global trend? Ten year
comparison of Russian and German data. PloS One 8 (7), e68195. https://doi.org/10.1371/journal.pone.0068195.
Robič Pikel, T. (2022). Fat tissue on the march:
secular trend of body circumferences and skinfold thicknesses in Slovenia over the 70
years period. Anthropologischer Anzeiger 79 (1), 33–41. https://doi.org/10.1127/anthranz/2021/1324.
Robič Pikel, T./Gregorič, M./Blaznik, U./Delfar,
N./Golja, P./Zdešar Kotnik, K. (2023). Intergenerational changes in body height, body
mass, and body mass index in an understudied population. Anthropologischer Anzeiger.
https://doi.org/10.1127/anthranz/2023/1618.
Rogol, A. D./Clark, P. A./Roemmich, J. N. (2000).
Growth and pubertal development in children and adolescents: effects of diet and
physical activity. The American Journal of Clinical Nutrition 72 (2 Suppl), 521S-8S.
https://doi.org/10.1093/ajcn/72.2.521S.
Rolland-Cachera, M. F./Brambilla, P./Manzoni,
P./Akrout, M./Sironi, S./Del Maschio, A./Chiumello, G. (1997). Body composition assessed
on the basis of arm circumference and triceps skinfold thickness: a new index validated
in children by magnetic resonance imaging. The American Journal of Clinical Nutrition 65
(6), 1709–1713. https://doi.org/10.1093/ajcn/65.6.1709.
Sahakyan, K. R./Somers, V. K./Rodriguez-Escudero,
J. P./Hodge, D. O./Carter, R. E./Sochor, O./Coutinho, T./Jensen, M. D./Roger, V.
L./Singh, P./Lopez-Jimenez, F. (2015). Normal-weight central obesity: Implications for
total and cardiovascular mortality. Annals of Internal Medicine 163 (11), 827–835.
https://doi.org/10.7326/M14-2525.
Scheffler, C. (2010). The change of skeletal
robustness of 6-12 years old children in Brandenburg (Germany)--comparison of body
composition 1999-2009. Anthropologischer Anzeiger 68 (2), 153–165. https://doi.org/10.1127/0003-5548/2011/0095.
Scheffler, C./Hermanussen, M. (2014). Is there an
influence of modern life style on skeletal build? American Journal of Human Biology 26
(5), 590–597. https://doi.org/10.1002/ajhb.22561.
Scheffler, C./Hermanussen, M. (2022). Stunting is
the natural condition of human height. American Journal of Human Biology 34 (5), e23693.
https://doi.org/10.1002/ajhb.23693.
Stachoń, A./Burdukiewicz, A./Pietraszewska,
J./Andrzejewska, J. (2012). Changes in body build of AWF students 1967–2008. Can a
secular trend be observed? Human Movement 13 (2), 109–119. https://doi.org/10.2478/V10038-012-0011-8.
Stock, J. T./Shaw, C. N. (2007). Which measures of
diaphyseal robusticity are robust? A comparison of external methods of quantifying the
strength of long bone diaphyses to cross-sectional geometric properties. American
Journal of Physical Anthropology 134 (3), 412–423. https://doi.org/10.1002/ajpa.20686.
Sun, S. S./Deng, X./Sabo, R./Carrico, R./Schubert,
C. M./Wan, W./Sabo, C. (2012). Secular trends in body composition for children and young
adults: the Fels Longitudinal Study. American Journal of Human Biology 24 (4), 506–514.
https://doi.org/10.1002/ajhb.22256.
Sun, X./Liu, Z./Du, T. (2021). Secular trends in
the prevalence of abdominal obesity among Chinese adults with normal weight, 1993-2015.
Scientific Reports 11 (1), 16404. https://doi.org/10.1038/s41598-021-95777-y.
Temple, N. J. (2023). A proposed strategy against
obesity: How government policy can counter the obesogenic environment. Nutrients 15
(13). https://doi.org/10.3390/nu15132910.
Vispute, S. Y./Mandlik, R. M./Khadilkar, V.
V./Gondhalekar, K. M./Khadilkar, A. V. (2023). Establishing a unique, single cutoff
value for body frame size for screening for risk of hypertension in Indian children and
acdolescents-A multicenter study. Indian Journal of Pediatrics 90 (4), 327–333.
https://doi.org/10.1007/s12098-022-04186-0.
Zdesar Kotnik, K./Golja, P. (2012). Changes in
body composition of university students in a country in socio-economic transition.
Anthropologischer Anzeiger 69 (3), 261–271. https://doi.org/10.1127/0003-5548/2012/0198.
 ✉
✉