BackgroundBody mass index (BMI) is the dominant diagnostic parameter for overweight
and obesity, but its suitability is controversial. Low physical fitness (PF) is a risk
factor for cardiovascular diseases and low PF is associated with obesity.
ObjectivesAim of the study is to characterize groups of overweight children via
different anthropometric parameters and their respective PF.
Sample and MethodsAnthropometric measurements (BMI, waist circumference
(WC), skinfold thickness (SF), mid-upper arm circumference (MUAC)) were assessed in 147
preschool children (age 4.7 ± 1.8 years) at 12 Kindergartens in Germany. Measurements
were related to a field battery for PF, assessing musculoskeletal fitness and motor
fitness.
ResultsAll anthropometric measurements characterize different children as
overweight, only four children are classified as overweight by all measurements.
Children with elevated triceps SF alone or in combination with high subscapular SF or WC
but not BMI showed lower PF compared with non-overweight children (long jump (p <
0.001), high jump (p = 0.002), shuttle run (p = 0.032)).
ConclusionsTriceps SF measuring peripheral fat mass alone and in combination with
parameters of central fat might give useful additional information to the routinely
measured BMI to detect poor PF indicating health impairing overweight in 3- to
6-year-old children, while preventive examinations should not be placed exclusively on
the BMI.
Keywords: obesity, motor fitness, BMI, preschool children
Conflict of interest: The authors
declare no conflicts of interest.
Citation: Maintz, E. et al. (2024). Health endangering overweight in preschool children. Human Biology and Public Health 1. https://doi.org/10.52905/hbph2024.1.73.
Copyright: This is an open access article distributed under the terms of the Creative Commons Attribution License which permits unrestricted use, distribution, and reproduction in any medium, provided the original author and source are credited.
BMI, the mainly solely used parameter for overweight in preschool children,
seems insufficient to detect health endangering body compositions. Adding parameters for
peripheral fat mass like triceps SF or in combination with parameters indicating central
fat mass, might be more suitable to detect those children that also show lower physical
fitness.
Contents
Abbreviations
ADHD: Attention-Deficit/Hyperactivity Disorder
AGA: German Adiposity Association
BIA: Bioelectrical impedance analysis
BMI: body mass index
Β: regression coefficientv
DXA: Dual energy X ray absorptiometry
ECOG: European Childhood Obesity Group
Hmax: maximal height
kg bw: Kilogram of body weight
hmax: maximal jumping height
MUAC: middle upper arm circumference
NOW: normal weight obese
P: P-value
pP: peak Power
pPrel: relative peak Power
R2: coefficient of determination
SF: skinfold thickness
subSF: subscapular skinfold thickness
triSF: triceps skinfold thickness
WC: waist circumference
Introduction
The epidemic of obesity and its associated co-morbidities has become one of
the mayor challenges for health care systems worldwide (Branca et al. 2007). Prevalence has been rising dramatically over the last 20
years in almost all countries. Obesity in children is increasing even faster than in adults
(Afshin et al. 2017). According to the Global
Burden of Disease Study, 5.02 million deaths occurring in 2019 were associated with
overweight and obesity (Roth et al. 2020).
Childhood obesity is predictive for cardiovascular risk factors and
comorbidities such as increased intima-media thickness, dyslipidaemia, hypertension and type
2 diabetes as well as psychological impairments such as low self-esteem, anxiety and
depression (Berenson et al. 1998; Eisenmann et al. 2005; Juonala et al. 2011; Lobstein et al.
2004). Childhood obesity is associated with persisting obesity in adulthood, but
encouraging data from four longitudinal cohort studies showed that obese children who became
non-obese as adults had a similar cardiovascular risk profile as individuals who have never
been obese, indicating some kind of reversibility of atherosclerosis in childhood (Juonala et al. 2011; Magnussen et al. 2012). However, secondary prevention is complex and often little
effective. Extreme adiposity is a chronic disease, and in most cases not curable (Wabitsch et al. 2020). To achieve prevention of higher
grades of obesity, early detection is crucial in childhood to reduce morbidity and mortality
in adulthood and reduce costs for the health care system in the long run.
Overweight and obesity are commonly defined as an elevated portion of body
fat that may impair health (Engin 2017).
Anthropometric measurements such as BMI, as quotient of weight per height squared (kg/m²),
skinfold thickness (SF) or waist circumference (WC) are correlated with other diagnostic
techniques measuring fat mass like dual energy X ray absorptiometry (DXA), densitometry or
bioelectrical impedance analysis (BIA) (Müller et al.
2016; Bell et al. 2018; Freedman et al. 2007).
BMI and waist circumference have been shown to correctly identify high trunk
fat in preschool children in 93% and 89% of cases respectively (Taylor et al. 2008). Correlation coefficient of SF and BMI with DXA in
children 5-11 years was 0.71 -0.83 (Freedman et al.
2007). Anthropometry is a feasible tool for the evaluation of children in field
settings like paediatric appointments or in schools as it does not require ionizing
radiation or immobile and expensive instruments (Bell
et al. 2018; Liem et al. 2009; Wells and Fewtrell 2006). Although BMI is not an ideal
measurement for the estimation of body fat as it cannot distinguish between lean mass and
fat mass, it has become the most widely used parameter to define overweight in adults and
children (Wells 2014; Müller et al. 2016).
Although in literature concepts to describe and measure moving skills and
fitness are heterogeneous using different terms, children with deficient assessed or
perceived coordination skills (motor skill competence) move less in their daily routine
(physical activity), and show lower (health related) physical fitness (PF) (Barros et al. 2021; Agha-Alinejad et al. 2015; Haapala et al.
2016; Barnett et al. 2016; Antunes et al. 2018; Stodden et al. 2008; Stodden et al.
2014). Poor PF is associated with poor health and shorter life (Ortega et al. 2012; Högström et al.
2016). After the model of Stodden et al. all the four competencies are interrelated
and the resulting lower physical activity causes overweight and obesity (Stodden et al. 2008). In his model, motor skill
competence describes locomotor skills like running and object control skills like throwing,
while (health related) PF, describes muscular strength and power of endurance. According to
Ortega et al. three different areas of PF can be described and measured: (1)
cardiorespiratory fitness describing the ability of the cardiorespiratory system to provide
oxygen during a period of moderate physical activity, (2) musculoskeletal fitness describing
endurance and explosive strength (power) as well as flexibility of muscles or muscle groups,
(3) motor fitness which assesses technical abilities and skills measuring speed, agility and
balance (Ortega et al. 2008).
Several studies comparing PF and body composition in preschool children exist
but methods especially for assessment of PF vary widely (Ortega et al. 2008; Henriksson
et al. 2019; Cadenas-Sánchez et al. 2015; Kakebeeke et al. 2017; Ortega et al. 2015;
Castetbon and Andreyeva 2012; Nervik et al. 2011). Tests for older children cannot easily be
adapted as the preschool child has to understand the task and has to be able to technically
perform the movement depending on their developmental stage.
The present study of 3- to 6-year-old children is therefore piloting a field
PF battery in combination with the assessment of different anthropometric measurements to
detect indicators for unhealthy body composition. Additionally, the usage of a force plate
(Leonardo Mechanograph®) to measure PF with a single test (jumping) is evaluated, comparing
results with the field battery. This would give examinators a time efficient alternative to
the field test battery.
We hypothesize:
1.
Elevated anthropometric measurements (BMI, WC, MUAC or SF) do not
characterize the same individuals as overweight or obese.
2.
Certain anthropometric measurements or their combinations characterizing
overweight exist that are associated with lower scores for PF.
3.
Jumping test on a force plate indicates low PF in similar body
composition groups as the field test battery.
Sample and methods
Participants
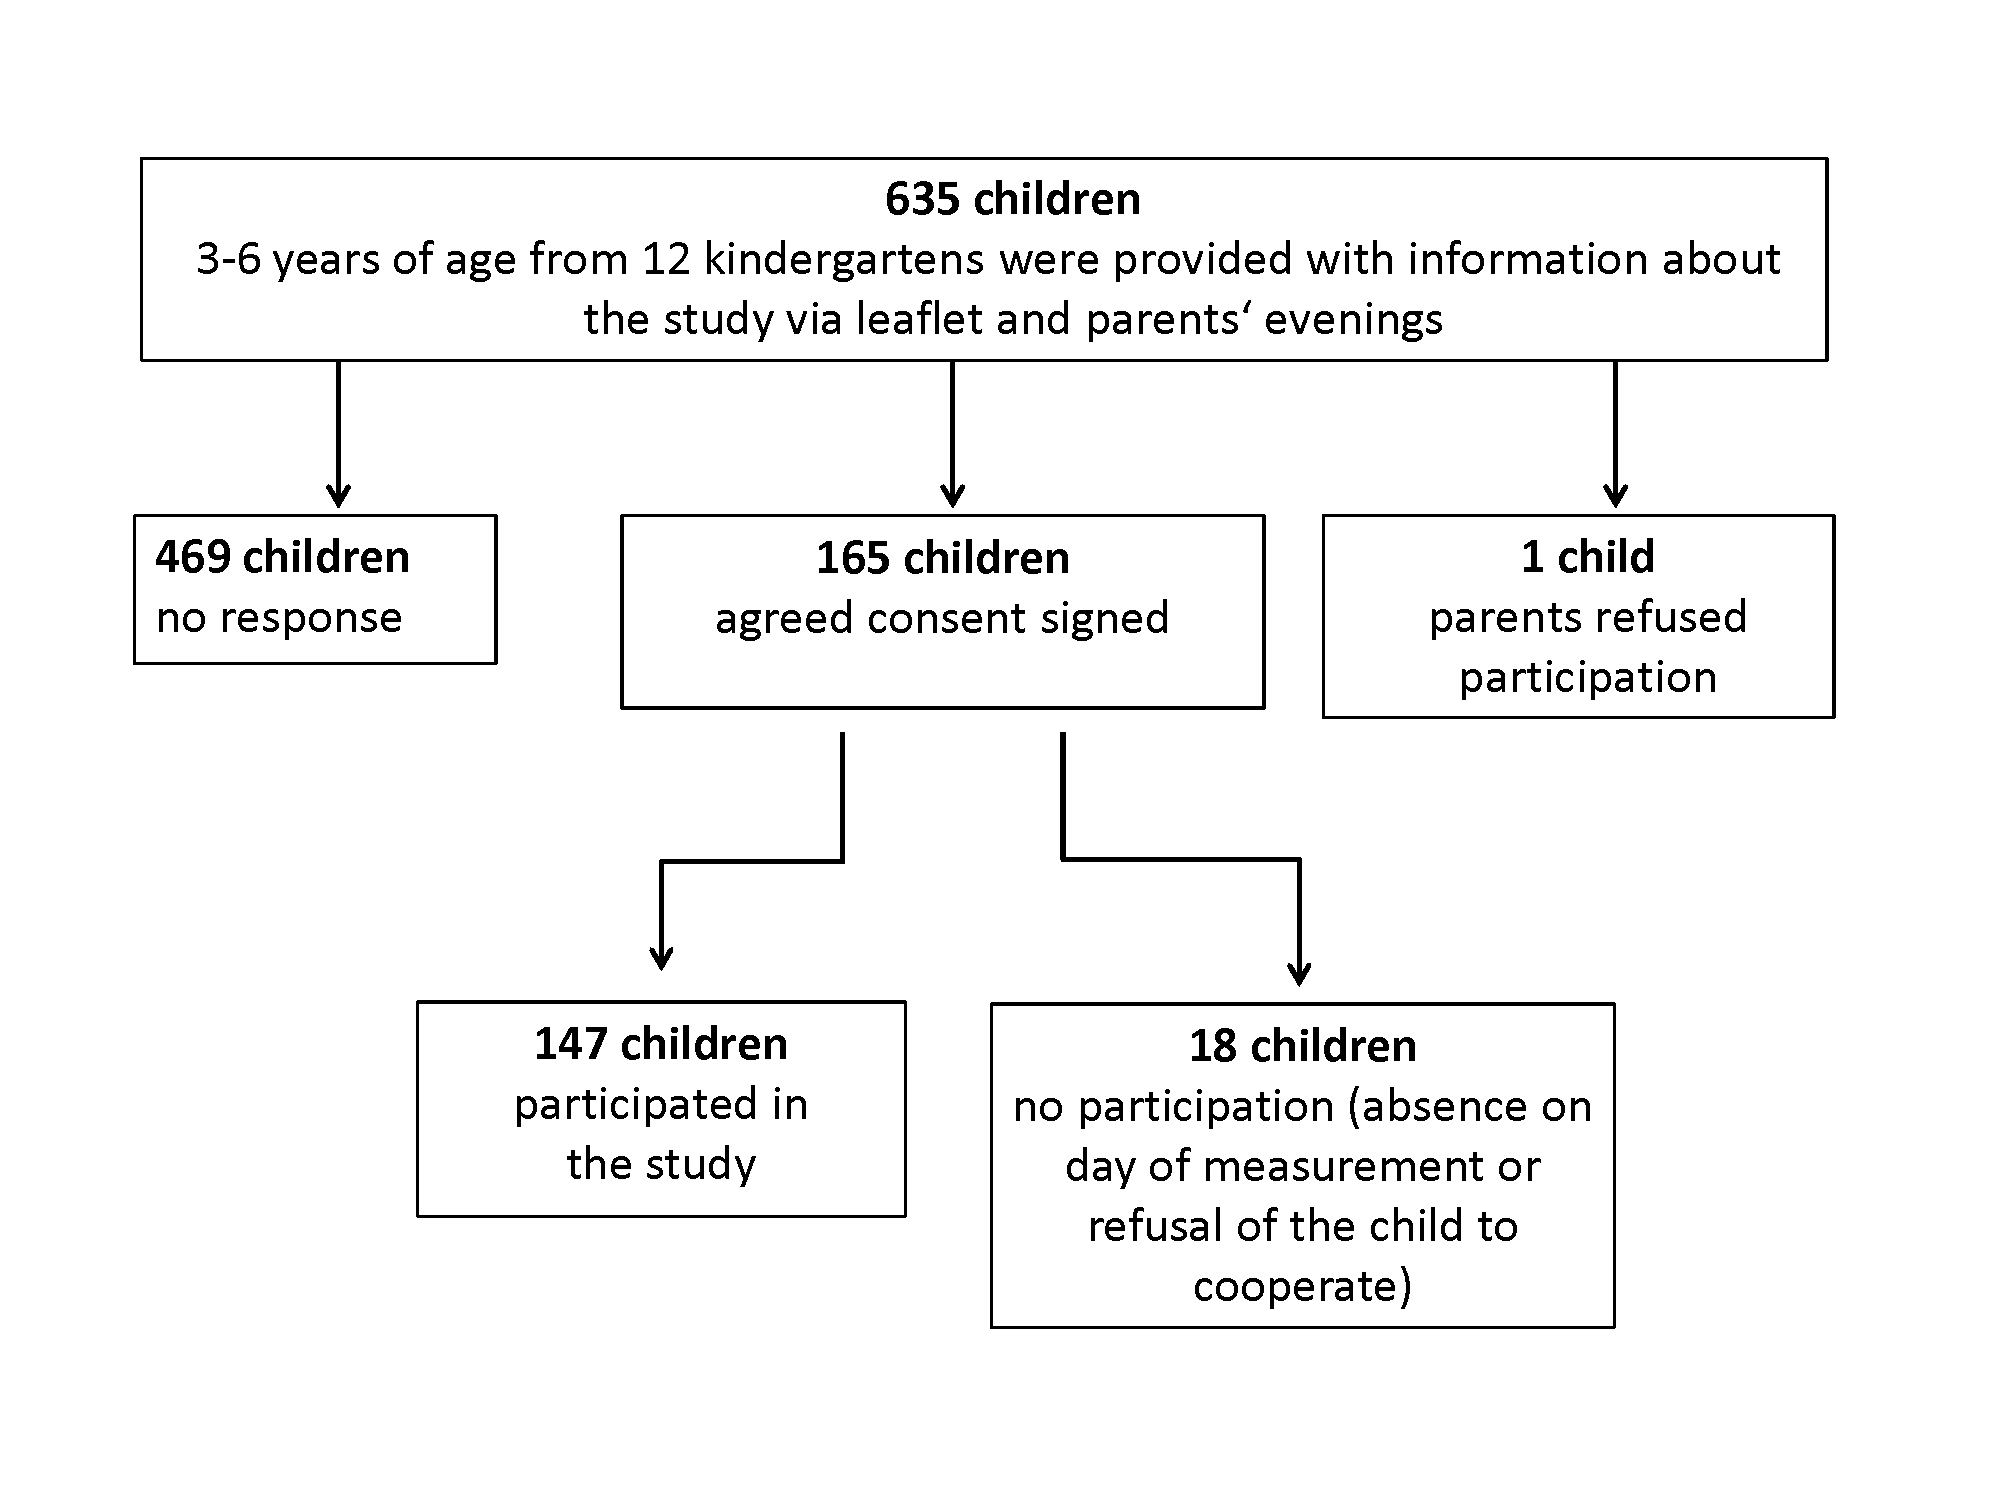
Out of a list of all 159 kindergartens in the city of Freiburg, 12
kindergartens were randomly selected and contacted. Institutions took part in the study if
the head of the facility agreed to participate. At these kindergartens, information
leaflets were distributed to the parents and parents were informed and invited during
parent’s evenings. Children between the ages of 3 to 6 years were included after written
informed consent from parents or legal representatives was obtained. Children with chronic
diseases (e.g., asthma, rheumatic diseases) or physical or mental disabilities were
excluded from the study. Recruitment process is shown in Figure 1.
The study was approved by the Ethics Committee of the University of
Freiburg Medical Centre (EK-FR 276/18 to KOS).
Figure 1 Recruitment of participants.
Data collection
The field fitness battery used was an adapted protocol after a systematic
review of 22 studies on reliability, validity and relation to health outcomes of PF tests
for preschool children by Ortega et al. (Ortega et al. 2015). The children completed a
test battery consisting of the following tests:
Motor fitness:
•
4 x 5 metre shuttle run, to test speed, agility and coordination (Przednowek et al. 2021)
Ball throwing test using the best result of three throws with each hand
for explosive strength and coordination of upper extremity (Oja and Jürimäe 1997)
To evaluate a standardized room-saving tool to evaluate musculoskeletal
fitness for settings where running and jumping is not feasible, a two-leg high jump on a
standardized force plate (Leonardo Mechanograph® GRFP STD, Novotec Medical GmbH Pforzheim,
Germany), which is a tool for the space-resolved registration of ground reaction forces,
was performed. For examination of measurements, Leonardo Mechanography v4.4 Software
Research edition was used (Rawer 2021).
Parameters analysed from mechanograph were “relative maximal Power” (pPrel) calculated as
maximal power (peak Power =pP) related to body mass (kilogram of body weight=kg bw) and
maximal jumping height (hmax).
Further, anthropometric information was collected by standard procedures
according to Knußmann et al. (Knußmann 1988).
Height was measured with an anthropometer to the nearest 1mm. Weight was collected to the
nearest 100g. MUAC and WC were measured with a flexible, non-elastic measurement tape to
the nearest 1mm. Subscapular and triceps SF were measured with skinfold callipers (DKHS,
GPM Anthropological Instruments, Zurich Switzerland) to the nearest 2mm.
The study was carried out in the respective exercise rooms of the
kindergartens. During the normal daily routine, a group of 2 to 4 children was sent to the
exercise room, where two trained field researchers conducted the measurements. For
anthropometric measurements, sit and reach, and measurements on the force plates children
were divided into two groups of 1-2 measured by one of the field researchers.
BMI cut-offs for children and adolescents are defined according to age, sex
and population specific percentiles. As defined by the German Adiposity Association (AGA)
and the European Childhood Obesity Group (ECOG), overweight was classified in this study
as BMI above the 90th percentile and obesity above the 97th percentile (Moss and Wabitsch 2019; Poskitt 1995).
To further investigate the effect of an increase in anthropometric
variables on fitness performance we (1) created groups of one anthropometric variable or a
combination of several anthropometric variables (subgroups) above the 90th percentile, (2)
compared fitness performance of these groups with a control group of children showing
normal values (<90th percentile) in all anthropometric parameters (“all non-overweight”
group). Groups with n < 10 children were excluded.
Subgroups can be summarized into two categories that are classified as
follows:
1. Indicating overweight in combination with BMI:
•
Group 1: All children with BMI and one other parameter above the 90th
percentile;
•
Group 2: All children with BMI and other possible combinations of two
parameters above the 90th percentile with a subgroup size of n ≥10.
2. Indicating overweight irrespective of BMI:
•
Group 3: All children with combinations of two anthropometric
parameters above the 90th percentile except BMI with subgroup size n ≥ 10.
Statistical analysis
Statistical analysis was carried out with SPSS Statistics 26 (IMB, New
York, USA) and R 4.0.3 (R studio, Boston, USA).
For descriptive statistics, mean, median and standard deviation were
calculated.
Anthropometric measurements were standardized using percentile z-scores,
based on references for preschool children in Germany published by Hesse et al. (Hesse et al. 2016a; Hesse et al. 2016b; Hesse et al. 2017).
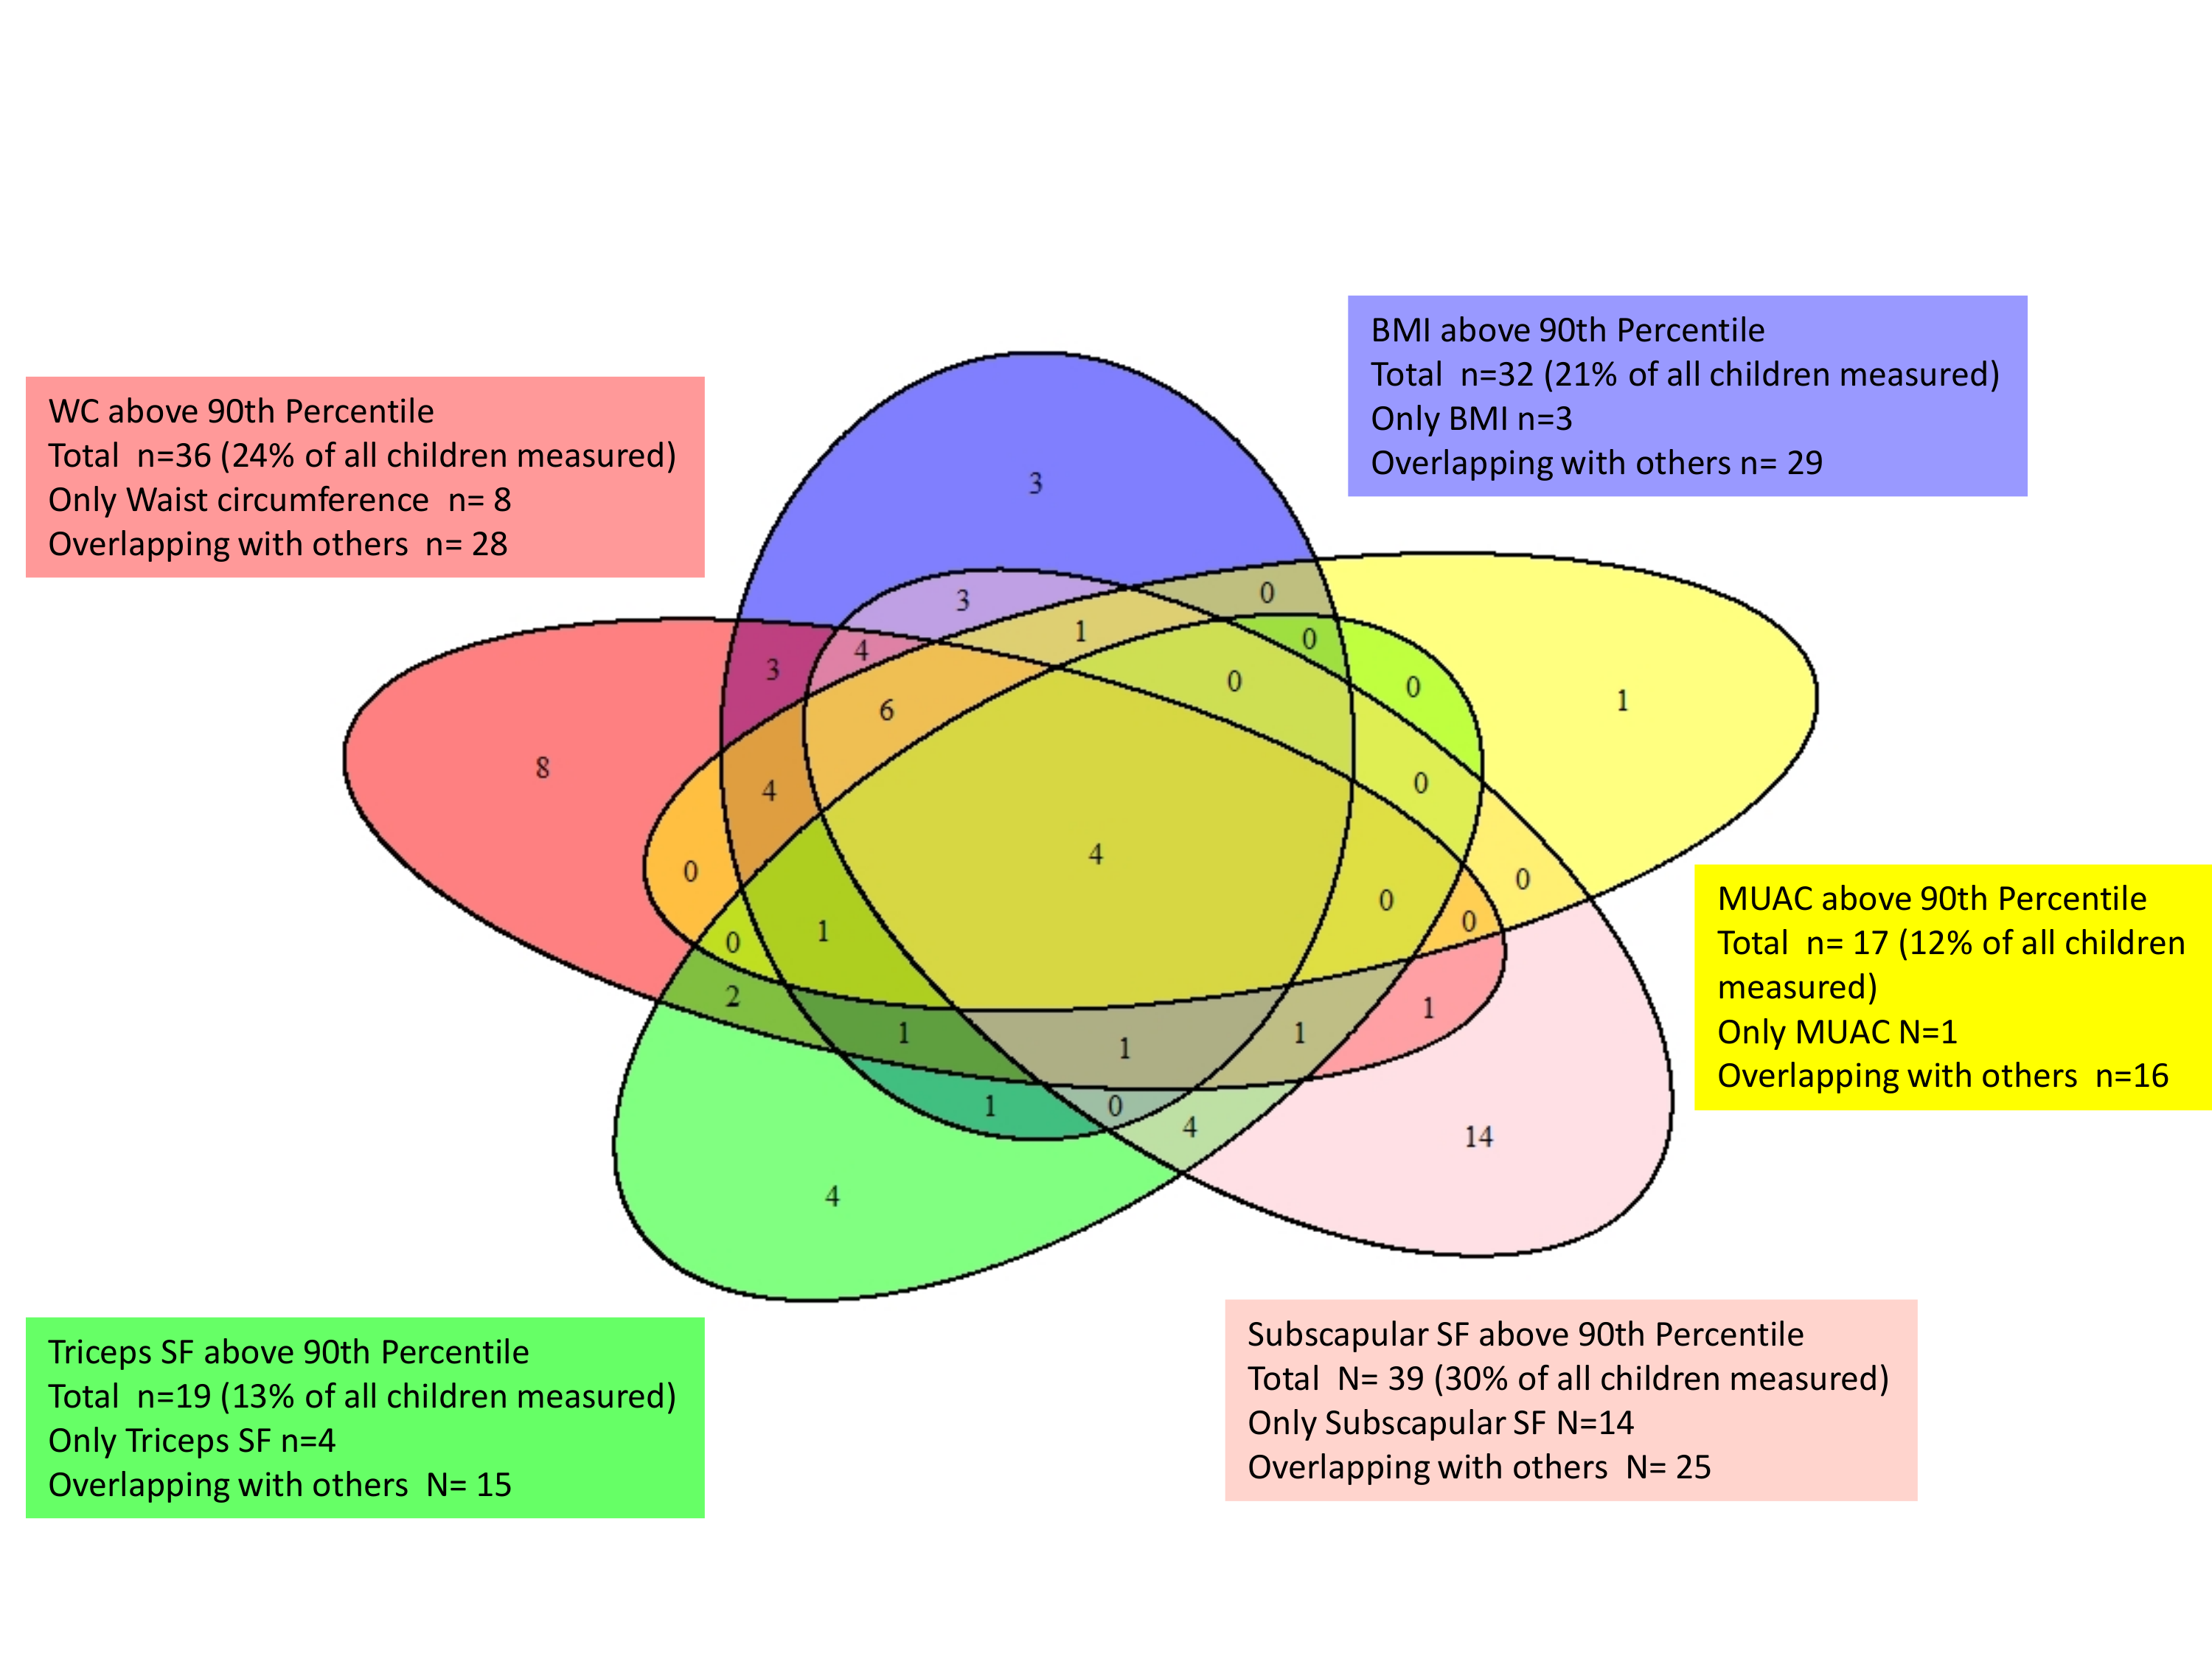
A Venn diagram was calculated and illustrated for a descriptive
presentation of distribution and relation of different elevated anthropometric
measurements. In the Venn diagram five planes are drawn, one for each anthropometric
measurement. The planes show the number of children above the 90th percentile for a
specific parameter as well as the overlapping with other parameters.
Multiple regressions analysis was performed to analyze the effect of
anthropometric characteristics (in z-scores) on the fitness performance. As fitness
performance might depend on age and sex we corrected for these confounding variables
(Busche et al. 2013; Krombholz 2011).
For comparison of fitness performance of different subgroups (see above)
with a group of children showing normal values in all parameters (“all non-overweight”
group) Mann-Whitney-U-Test was used due to small sample sizes and a lack of normal
distribution.
To compare field battery fitness test with measurements of Leonardo
Mechanograph Spearmans-correlation was calculated.
Results
A total of 147 children participated in the study. Distribution of
anthropometric data by sex are shown in Table
1.
Table 1 Descriptive characteristics of boys and girls).
Male (n=83)
Female (n=64)
All children (n=147)
Mean (SD)
Median (IQR)
Mean (SD)
Median (IQR)
Mean (SD)
Median (IQR)
Age (years)
4.83 (0.91)
4.91(1.38)
4.62 (0.94)
4.34 (1.51)
4.74 (0.93)
4.7(1.43)
Z-scores
BMI
0.43 (1.36)
0.24 (1.35)
0.45 (1.08)
0.28(1.47)
0.44 (1.24)
0.25 (1.29)
WC
0.72 (1.42)
0.39 (1.42)
0.60 (1.08)
0.51(1.34)
0.67 (1.28)
0.42 (1.41)
MUAC
-0.31 (1.17)
-0.45 (1.21)
0.08 (1.16)
0.11(1.48)
-0.14 (1.18)
-0.27 (1.37)
triSF
-0.35 (1.24)
-0.42 (1.35)
0.36 (1.02)
0.49 (1.4)
-0.04 (1.2)
-0.06 (1.43)
subSF
0.85 (0.8)
0.8 (1.09)
0.75 (0.88)
0.72(1.29)
0.81 (0.84)
0.78 (1.14)
SD = standard deviation, BMI = body mass index, WC = waist circumference, MUAC = middle
upper arm circumference, triSF = triceps skin fold thickness, subSF = subscapular skin
fold thickness, IQR = interquartile range, SD = standard deviation
Figure 2 Venn diagramm of anthroprometric parameters above the 90th percentile shown as
areas and their overlap (WC = waist circumference, SF = skinfold thickness, MUAC =
middle upper arm circumference, BMI = body mass index).
For the subgroup of WC above the 90th percentile (36 of 147 children),
numbers are slightly higher than those children overweight by BMI (32 of 147 children). 12
of the children with increased WC do not show increased BMI values.
The prevalence of overweight measured as elevated SF in this study was lower
for triSF (19 of 147 children) and higher for subSF (39 of 131 children) compared to the
prevalence of overweight by BMI or WC. Elevated MUAC has the lowest prevalence (17 of 147
children) and all but one child of this group simultaneously show elevated BMI.
When considering the combination of BMI and SF in our study, 24 children show
only BMI but no SF >90th percentile, eight children had both high BMI and triSF, 19
children both high BMI and subSF. 10 of all children showed both SF >90th percentile,
five of which had also elevated BMI measurements. 26 (20% of all) children had either one SF
measure increased (triSF or subSF) but no increase in BMI value.
In the multiple regression analysis of fitness performance as an outcome
variable and anthropometric parameters as explanatory variable adjusted for age and sex,
(borderline) significant positive association can be seen (Table 2) for MUAC and relative power of high jump on the mechanograph (pPrel)
(p=0.048) and the ball throwing test (p=0.010). Negative linear association are significant
for BMI and ball throwing test (p=0.015) as well as triceps SF and pPrel of high jump on the
mechanograph. Sit and reach, shuttle run and standing long jump showed no significant
association with any anthropometric parameter.
Looking at one single anthropometric parameter above the 90th percentile,
children with high triceps SF showed significantly poorer performance in standing long jump,
shuttle run and at high jump on mechanograph (pPrel) (Table 3).
Table 2 Multiple Regression Analysis of fitness performance and anthropomentric
parameters.
Fitness Test
Standing Long Jump
High Jump on Mecanograph
Shuttlerun
Ball Throwing Test
Sit and Reach
pPrel
hmax
Anthropometric Measurement
β
p
β
p
β
p
β
p
β
p
β
p
BMI (z-score)
-1.781
0.539
-0.331
0.624
0.008
0.381
-0.129
0.502
-0.428
0.015
0.692
0.145
MUAC (z-score)
1.261
0.652
1.304
0.048
0.008
0.374
0.107
0.565
0.439
0.010
0.242
0.589
WC (z-score)
0.198
0.936
-0.692
0.226
-0.014
0.074
0.202
0.218
0.248
0.096
-0.171
0.281
triSF (z-score)
-3.769
0.051
-1.057
0.020
-0.004
0.482
0.066
0.602
-0.185
0.110
-0.112
0.471
subSF (z-score)
-2.037
0.415
-0.413
0.493
-0.002
0.769
0.051
0.758
-0.050
0.738
-0.343
0.165
Age
18.664
<0.001
3.365
<0.001
0.035
<0.001
-1.069
<0.001
1.3776
<0.001
-0.739
0.072
Sex
4.115
0.275
-1.653
0.061
0.003
0.813
-0.398
1.203
<0.001
-1.932
0.016
R2
0.5075
0.395
0.238
0.422
0.658
0.123
Significant association in bold. BMI = body mass index, MUAC = middle upper arm
circumference, WC = waist circumference, triSF = triceps skinfold thickness, subSF =
subscapular skinfold thickness, R2 = coefficient of determination, pPrel = relative peak
Power, hmax = maximal height, β = regression coefficient, p = P-value
Table 3 Subgroups with one parameter above 90th percentile showing those fitness tests
that differed significantly comparing to "all non-overweight" group
(n=72).
BMI≥90th P
WC≥90th P
triSF≥90th P
subSF≥90th P
MUAC≥90th P
Respective z-value: median
1.84
1.89
1.67
1.61
1.82
Subgroup size (n/N)
32/147
36/147
19/147
39/131
17/147
Number of male/female
17/15
18/18
9/10
21/18
8/9
Number of children with BMI ≥90th P/subgroup size
32/32
24/36
8/19
19/39
16/17
Fitness tests(s) that differed significantly
none
none
LJ (p < 0.001) SR (p = 0.032) M: pPrel (p=0.002)
none
none
WC = waist circumference, TriSF = triceps skinfold thickness, SubSF = subscapular
skinfold thickness, MUAC = middle upper arm circumference, pPrel = relative peak Power
(two leg jump on mechanograph) P = percentile, LJ = Long Jump, SR = Shuttle Run, M =
Mechanograph
The Venn diagram (Figure 2) visualizes
overlapping of the different anthropometric measurements above the 90th percentile among the
children. Bigger overlapping areas can be seen for BMI and WC (n=24) as well as BMI and WC
together with upper arm circumference (n=15) or with subSF (n=15). Only for four children
all parameters exceeded the 90th percentile.
Using BMI above the 90th percentile as the defining measure, 22% of the
children (n=32) can be classified as overweight and 10% (n=15) as obese (≥ 97th percentile).
When analysing combinations of parameters in subgroups as described above
(Sample and methods):
1. Indicating overweight in combination with BMI:
•
Group 1 (elevated BMI combined with one other parameter above the 90th
percentile): No significant differences comparing physical performance with “all
non-overweight” group.
•
Group 2 (elevated BMI combined with two other elevated parameters): The
following combinations had n>10 children: BMI, subSF and WC (n=15); BMI, subSF and
MUAC (n=11) and BMI, WC and MUAC (n=15). None of these subgroups showed lower fitness
compared with the “all non-overweight” group.
2. Indicating overweight irrespective of BMI:
•
Group 3 (combinations of two parameters above the 90th percentile):
Significant difference in fitness performance can be seen in Table 4.
Table 4 Subgroups with elevated measures irrespective of BMI, showing which fitness tests
differed significantly compared with "all non-obese" group (n=72),
(Mann-Whitney-U-Test).
Overweight irrespective of BMI (subgroup 3)
WC & subSF>90th P
WC & triSF >90th P
Both SF>90th P
WC & MUAC>90th P
subSF&MUAC >90th P
17/131
10/147
10/131
15/147
11/131
Subgroup size (n/N)
11/8
5/5
4/6
8/7
6/5
Number of male/female
15/17
7/10
5/10
15/15
11/11
Number of children with BMI > 90th P/subgroup size
none
LJ (p=0.01) SR (p=0.009) M: pPrel (p=0.013)
LJ (p=0.024) M: pPrel (p=0.026)
none
none
WC = waist circumference, TriSF = triceps skinfold thickness, SubSF = subscapular
skinfold thickness, MUAC = middle upper arm circumference, P= percentile, SF = Skinfold
thickness, LJ = Long Jump, SR = Shuttle Run, M = Mechanograph
Moreover, correlation analysis between standing long jump and high jump on
Leonardo Mechanograph showed a highly significant (p<0.001) correlation of r=0.7 for
relative peak power (pPrel) and r=0.618 for maximal jumping height (hmax).
Discussion
The main findings of the present study are:
1.
BMI, both SFs, WC and MUAC define different individuals as overweight or
obese. Among them, only four individuals are commonly characterized by all parameters.
2.
Only elevated triSF alone and in combination with subSF or WC (but not
BMI) were associated with reduced PF as a possible indicator for health impairing
overweight.
3.
Low PF indicated by jumping on the force plate occurs in similar
overweight groups as low PF indicated by test of the field test battery (jumping and
running).
The Venn diagram illustrates the very heterogeneous distribution of the
different anthropometric parameters above the 90th percentile among children. While BMI, WC
and MUAC had higher overlap in being elevated in the same children, SF (especially triSF)
and BMI had lower overlap. Only eight of the 19 children with high triSF also have a high
BMI.
In line with comparable data on German preschool children, published by Hesse
et al. (Hesse et al. 2016a; Hesse et al. 2016b; Hesse et al.
2017), the studied boys show lower values of MUAC (boys: -0.42, girls: 0.49) and
triceps SF (boys:-0.45, girls: 0.11) than girls (table
1).
However, this does not affect the sex distribution of the overweight groups
(parameters above the 90th per-centile). In these groups boys and girls show similar
distribution (table 3 and 4).
In accordance to our study, a cross sectional study by Talma et al. reported
a strong correlation of MUAC and BMI as well as MUAC and weight stating MUAC as a good
substitute for indicating overweight where weight cannot be taken (Talma et al. 2019). However, it is questionable if this correlation is
generally due to increasing fat mass, as BMI and MUAC do not differ between lean and fat
mass. Little research exists on association of MUAC and health or fitness. Children with
elevated MUAC did not show lower PF in our study. Instead, MUAC was positively associated
with higher single two leg jump and better ball throwing performance. It might be possible
that elevated MUAC rather indicates higher lean mass implicating muscle mass instead of
unhealthy fat mass in this age group. In line with our results, no or even a positive
association of elevated BMI with PF was found in several studies on preschoolers (Butterfield et al. 2002; Kakebeeke et al. 2017; Toia et al.
2009). This further indicates the importance of the ineffective distinction of lean
mass/muscle mass and fat mass by BMI (Talma et al.
2019).
Although its suitability is discussed controversially, according to current
international guidelines, BMI is used as the main indicator for overweight. A systematic
review found low sensitivity for BMI to detect high fat mass in children (Javed et al. 2015). Other anthropometric measurements
like SF are described to be more adequate parameters to estimate body fat mass although
predominantly assessed in older children (Freedman et al.
2007; Liem et al. 2009; Bogin 2020).
If PF is used as an indicator for health impairment to further identify which
parameters really detect health endangering overweight, our study supports the use of
additional anthropometric parameters to BMI in preschool children. Our study confirms the
importance of SF to detect health impairing excessive body fat that is not captured by BMI:
Children with elevated triSF showed significant poorer performance for high jump on
mechanograph, shuttle run and long jump compared to the “all non-overweight” group of
children. Elevated triSF alone and in combination with elevated subSF or WC showed lower PF
(especially jumping exercises) when performance was compared with the group of “all
non-overweight” children. The combination of central (subSF and WC) and peripheric fat
(triSF) might therefore be a good indicator in assessing health impairing overweight in
preschool children. In children aged 6 to 12 years SF was identified as the only parameter
inversely correlated with lower PF. Milanese et al. identified SF as the only parameter
inversely correlated with lower PF in children aged 6 to 12 years (Milanese et al. 2010).
Individuals with average or low BMI values but high fat mass, are described
in the literature as “normal weight obese” (NWO), have higher health risks than non-obese
individuals (García-Hermoso et al. 2020). As
previously described the instruments and cut-off values to detect “high fat mass” differ
which impedes to consistently define NOW (Barros et al.
2021; Agha-Alinejad et al. 2015).
Concordantly to our findings several studies show that children of NWO body
composition experience poorer PF than normal-weight non-obese children at their age (Barnett et al. 2016; Musalek et al. 2017; Franco et al. 2016).
Concerning our results, it seems that NWO children might be well captured by using
measurements of SF. Every fifth child of the study population showed normal BMI but elevated
SFs (either one). And all groups with significant lower fitness performance involved
elevation of either one of the SFs measured.
The observed positive association between BMI and performance in ball
throwing might be due to lower explosive muscle strength of upper extremity or as well worse
coordination skills. Association of high BMI and bad coordination skills is reported in a
systematic review (Barnett et al. 2016; Kakebeeke et al. 2017). Butterfeld et al. found better
muscle strength of upper extremity (hand grip strength) in children with higher BMI which
supports that in our study results are rather due to lower coordination skills (Butterfield et al. 2002). The coordination skills
needed for good performance in ball throwing test was also seen as an important factor in
preschool children by Oja et al. as it is quite a technical activity (Oja and Jürimäe 1997). For a test battery focussing on PF in preschool
children, ball throwing as a task seems rather problematic due to its susceptibility to
errors and the question of suitability at this age needs further evaluation.
However, further research with bigger samples on younger children is needed
(Wood et al. 2021).
The present study contributes to the research gap of PF assessment and its
relation to body composition in preschool children. A systematic review by Ortega et al. on
existing fitness tests for preschool children found low evidence for a clear statement on a
fixed fitness battery and the need for further research especially on the relationship of
fitness tests and health outcomes (Ortega et al.
2015). The here used field fitness battery was feasible to perform in the settings
of kindergartens without using expensive equipment.
The second approach to assess PF by using a special electric tool (force
plate, Leonardo Mechanograph) for exact measurements of power (explosive muscle strength)
showed high correlation with standing long jump, a field test measuring the same quality of
fitness (power of lower extremity) which supports the validity of the test. The mechanograph
itself was feasible to use with the young children and didn’t require any bigger space for
running or jumping. However, the force plate is heavy to carry, requires electric power and
needs to be purchased. Settings with limited time and space but capacity to purchase a force
plate might therefore pick this tool as a time saving single test for measuring PF in young
children.
Musculoskeletal fitness tests for explosive muscle strength where body mass
needs to be mobilized like jumping, seem to detect fitness deficits in overweight children
most effectively. These findings are in line with other studies showing that among different
PF tests hopping and jumping is associated with overweight in children (Oja and Jürimäe 1997). Lower muscle strength was found
to be associated with higher mortality in adolescents (Ortega et al. 2012) and higher overall obesity later in life (Ruiz et al. 2009) which endorses the focus on this
quality of physical fitness.
Limits of the study
Due to the heterogeneous distribution of the different anthropometric
parameters, studied (sub)groups were rather small. For reasons of practicability a rather
passive recruiting process was used and out of the 635 children of 12 randomly selected
kindergartens, only 166 children (response rate 26%) participated in the study. There is a
chance of selection bias if the group of non-participating children differ from the
participating group. If that would be the case the most probable consequence would be a
dilution of the measured effect as parents of less overweight children are more likely to
participate. Further studies with a bigger sample size comparing these anthropometric
measurements with fitness performance are necessary. A well standardized and validated PF
battery with age and sex adjusted reference values for young children from 3 to 6 years of
age would help to improve comparability for further studies on this topic. Although this
study focuses on PF it should be noted that certain coordination skills are needed to fulfil
the tasks of tests for PF. In young children these skills depend on general dexterity of the
child and also on developmental aspects.
Conclusion
In summary, the focus of preventive examinations in preschool children should
not be placed exclusively on BMI. In our study, 3- to 6-years-old children with elevated
peripheral fat mass by triSF alone and in combination with parameters of central fat (as WC
or subSF) showed poor PF, which might indicate health impairing overweight and obesity. The
presented fitness battery was an easy applicable method in preschool children for clinical
practice and field research.
Author contributions
Conceptualization, KO.S., R.M., M.L., V.S, E.M and U.W.-B.; methodology,
KO.S., R.M. and E.M.; for-mal analysis, E.-M.M., R.M., V.S. and M.L.; investigation, V.S.
and M.L.; resources, KO.S.; data curation, E.-M.M., R.M., V.S. and M.L.; writing—original
draft preparation, E.M., R.M., V.S. and M.L.; writing—review and editing, KO.S., R.M.,
M.L., V.S, E.M and U.W-B.; visualization, E.M.; supervision, KO.S.; project
administration, KO.S.; All authors have read and agreed to the published version of the
manuscript.
Funding
This research received no external funding.
Institutional Review Board Statement:
The study was conducted in accordance with the Declaration of Helsinki, and
approved by the Institutional Ethics Committee of University of Freiburg Medical Centre
(protocol code 276/18, date of approval: 13th September 2018).
Acknowledgements
We would like to thank all children, parents and kindergartens that
contributed data to this study. We also thank all students and the research team for their
valuable contribution.
References
Afshin, A./Forouzanfar, M. H./Reitsma, M. B./Sur,
P./Estep, K./Lee, A./Marczak, L./Mokdad, A. H./Moradi-Lakeh, M./Naghavi, M./Salama, J.
S./Vos, T./Abate, K. H./Abbafati, C./Ahmed, M. B./Al-Aly, Z./Alkerwi, A./Al-Raddadi,
R./Amare, A. T./Amberbir, A./Amegah, A. K./Amini, E./Amrock, S. M./Anjana, R. M./Ärnlöv,
J./Asayesh, H./Banerjee, A./Barac, A./Baye, E./Bennett, D. A./Beyene, A. S./Biadgilign,
S./Biryukov, S./Bjertness, E./Boneya, D. J./Campos-Nonato, I./Carrero, J. J./Cecilio,
P./Cercy, K./Ciobanu, L. G./Cornaby, L./Damtew, S. A./Dandona, L./Dandona,
R./Dharmaratne, S. D./Duncan, B. B./Eshrati, B./Esteghamati, A./Feigin, V. L./Fernandes,
J. C./Fürst, T./Gebrehiwot, T. T./Gold, A./Gona, P. N./Goto, A./Habtewold, T. D./Hadush,
K. T./Hafezi-Nejad, N./Hay, S. I./Horino, M./Islami, F./Kamal, R./Kasaeian,
A./Katikireddi, S. V./Kengne, A. P./Kesavachandran, C. N./Khader, Y. S./Khang,
Y.-H./Khubchandani, J./Kim, D./Kim, Y. J./Kinfu, Y./Kosen, S./Ku, T./Defo, B. K./Kumar,
G. A./Larson, H. J./Leinsalu, M./Liang, X./Lim, S. S./Liu, P./Lopez, A. D./Lozano,
R./Majeed, A./Malekzadeh, R./Malta, D. C./Mazidi, M./McAlinden, C./McGarvey, S.
T./Mengistu, D. T./Mensah, G. A./Mensink, G. B. M./Mezgebe, H. B./Mirrakhimov, E.
M./Mueller, U. O./Noubiap, J. J./Obermeyer, C. M./Ogbo, F. A./Owolabi, M. O./Patton, G.
C./Pourmalek, F./Qorbani, M./Rafay, A./Rai, R. K./Ranabhat, C. L./Reinig, N./Safiri,
S./Salomon, J. A./Sanabria, J. R./Santos, I. S./Sartorius, B./Sawhney, M./Schmidhuber,
J./Schutte, A. E./Schmidt, M. I./Sepanlou, S. G./Shamsizadeh, M./Sheikhbahaei, S./Shin,
M.-J./Shiri, R./Shiue, I./Roba, H. S./Silva, D. A. S./Silverberg, J. I./Singh, J.
A./Stranges, S./Swaminathan, S./Tabarés-Seisdedos, R./Tadese, F./Tedla, B. A./Tegegne,
B. S./Terkawi, A. S./Thakur, J. S./Tonelli, M./Topor-Madry, R./Tyrovolas, S./Ukwaja, K.
N./Uthman, O. A./Vaezghasemi, M./Vasankari, T./Vlassov, V. V./Vollset, S. E./Weiderpass,
E./Werdecker, A./Wesana, J./Westerman, R./Yano, Y./Yonemoto, N./Yonga, G./Zaidi,
Z./Zenebe, Z. M./Zipkin, B./Murray, C. J. L. (2017). Health effects of overweight and
obesity in 195 countries over 25 years. The New England Journal of Medicine 377 (1),
13–27. https://doi.org/10.1056/NEJMoa1614362.
Agha-Alinejad, H./Farzad, B./Salari, M./Kamjoo,
S./Harbaugh, B. L./Peeri, M. (2015). Prevalence of overweight and obesity among Iranian
preschoolers: Interrelationship with physical fitness. Journal of Research in Medical
Sciences 20 (4), 334–341.
Antunes, A. M./Freitas, D. L./Maia, J./Hedeker,
D./Gouveia, É. R./Thomis, M./Lefevre, J./Barnett, L. M. (2018). Motor performance, body
fatness and environmental factors in preschool children. Journal of Sports Sciences 36
(20), 2289–2295. https://doi.org/10.1080/02640414.2018.1449410.
Barnett, L. M./Lai, S. K./Veldman, S. L. C./Hardy,
L. L./Cliff, D. P./Morgan, P. J./Zask, A./Lubans, D. R./Shultz, S. P./Ridgers, N.
D./Rush, E./Brown, H. L./Okely, A. D. (2016). Correlates of gross motor competence in
children and adolescents: A systematic review and meta-analysis. Sports Medicine 46
(11), 1663–1688. https://doi.org/10.1007/s40279-016-0495-z.
Barros, W. M. A./Da Silva, K. G./Silva, R. K.
P./Da Souza, A. P. S./Da Silva, A. B. J./Silva, M. R. M./Fernandes, Matheus Santos de
Sousa/Souza, S. L. de/Souza, Viviane de Oliveira Nogueira (2021). Effects of
overweight/obesity on motor performance in children: A systematic review. Frontiers in
Endocrinology 12, 759165. https://doi.org/10.3389/fendo.2021.759165.
Bell, J. A./Carslake, D./O’Keeffe, L. M./Frysz,
M./Howe, L. D./Hamer, M./Wade, K. H./Timpson, N. J./Davey Smith, G. (2018). Associations
of body mass and fat indexes with cardiometabolic traits. Journal of the American
College of Cardiology 72 (24), 3142–3154. https://doi.org/10.1016/j.jacc.2018.09.066.
Berenson, G. S./Srinivasan, S. R./Bao, W./Newman,
W. P./Tracy, R. E./Wattigney, W. A. (1998). Association between multiple cardiovascular
risk factors and atherosclerosis in children and young adults. New England Journal of
Medicine 338 (23), 1650–1656. (accessed 7/17/2021).
Bogin, B. (2020). Patterns of human growth. 3rd
ed. Cambridge, Cambridge University Press.
Branca, F./Nikogosian, H./Lobstein, T./Branca, F.
(2007). The challenge of obesity in the WHO European region and the strategies for
response / EURO Nonserial Publication. Geneva, World Health
Organization.
Busche, P./Rawer, R./Rakhimi, N./Lang, I./Martin,
D. D. (2013). Mechanography in childhood: References for force and power in counter
movement jumps and chair rising tests. Journal of Musculoskeletal & Neuronal
Interactions 13 (2), 213–226.
Butterfield, S. A./Lehnhard, R. A./Coladarci, T.
(2002). Age, sex, and body mass index in performance of selected locomotor and fitness
tasks by children in grades K-2. Perceptual and Motor Skills 94 (1), 80–86. https://doi.org/10.2466/pms.2002.94.1.80.
Castetbon, K./Andreyeva, T. (2012). Obesity and
motor skills among 4 to 6-year-old children in the United States:
Nationally-representative surveys. BMC Pediatrics 12, 28. https://doi.org/10.1186/1471-2431-12-28.
Eisenmann, J. C./Wickel, E. E./Welk, G. J./Blair,
S. N. (2005). Relationship between adolescent fitness and fatness and cardiovascular
disease risk factors in adulthood: The Aerobics Center Longitudinal Study (ACLS).
American Heart Journal 149 (1), 46–53. https://doi.org/10.1016/j.ahj.2004.07.016.
Engin, A. (2017). The definition and prevalence of
obesity and metabolic syndrome. Advances in Experimental Medicine and Biology 960, 1–17.
https://doi.org/10.1007/978-3-319-48382-5\textunderscore.
Franco, L. P./Morais, C. C./Cominetti, C. (2016).
Normal-weight obesity syndrome: diagnosis, prevalence, and clinical implications.
Nutrition Reviews 74 (9), 558–570. https://doi.org/10.1093/nutrit/nuw019.
Freedman, D. S./Wang, J./Ogden, C. L./Thornton, J.
C./Mei, Z./Pierson, R. N./Dietz, W. H./Horlick, M. (2007). The prediction of body
fatness by BMI and skinfold thicknesses among children and adolescents. Annals of Human
Biology 34 (2). https://doi.org/10.1080/03014460601116860.
García-Hermoso, A./Agostinis-Sobrinho,
C./Camargo-Villalba, G. E./González-Jiménez, N. M./Izquierdo, M./Correa-Bautista, J.
E./Ramírez-Vélez, R. (2020). Normal-weight obesity is associated with poorer
cardiometabolic profile and lower physical fitness levels in children and adolescents.
Nutrients 12 (4). https://doi.org/10.3390/nu12041171.
Haapala, E. A./Väistö, J./Lintu, N./Tompuri,
T./Brage, S./Westgate, K./Ekelund, U./Lampinen, E.-K./Sääkslahti, A./Lindi, V./Lakka, T.
A. (2016). Adiposity, physical activity and neuromuscular performance in children.
Journal of Sports Sciences 34 (18), 1699–1706. https://doi.org/10.1080/02640414.2015.1134805.
Hesse, V./Schnabel, O./Judis, E./Cammann,
H./Hinkel, J./Weissenborn, J. (2016a). Längsschnittstudie des aktuellen Wachstums
0- bis 6-jähriger
deutscher Kinder: Teil 1. Monatsschrift Kinderheilkunde 164 (6), 478–496. https://doi.org/10.1007/s00112-016-0067-1.
Hesse, V./Schnabel, O./Judis, E./Cammann,
H./Hinkel, J./Weissenborn, J. (2016b). Längsschnittstudie des aktuellen Wachstums
0- bis 6-jähriger
deutscher Kinder: Teil 2. Monatsschrift Kinderheilkunde 164 (10), 892–912. https://doi.org/10.1007/s00112-016-0068-0.
Hesse, V./Schnabel, O./Judis, E./Cammann,
H./Hinkel, J./Weissenborn, J. (2017). Längsschnittstudie des aktuellen Wachstums
0- bis 6-jähriger
deutscher Kinder: Teil 3. Monatsschrift Kinderheilkunde 165 (2), 148–170. https://doi.org/10.1007/s00112-016-0069-z.
Högström, G./Nordström, A./Nordström, P. (2016).
Aerobic fitness in late adolescence and the risk of early death: a prospective cohort
study of 1.3 million Swedish men. International Journal of Epidemiology 45 (4),
1159–1168. https://doi.org/10.1093/ije/dyv321.
Javed, A./Jumean, M./Murad, M. H./Okorodudu,
D./Kumar, S./Somers, V. K./Sochor, O./Lopez-Jimenez, F. (2015). Diagnostic performance
of body mass index to identify obesity as defined by body adiposity in children and
adolescents: A systematic review and meta-analysis. Pediatric Obesity 10 (3), 234–244.
https://doi.org/10.1111/ijpo.242.
Juonala, M./Magnussen, C. G./Berenson, G. S./Venn,
A./Burns, T. L./Sabin, M. A./Srinivasan, S. R./Daniels, S. R./Davis, P. H./Chen, W./Sun,
C./Cheung, M./Viikari, J. S. A./Dwyer, T./Raitakari, O. T. (2011). Childhood adiposity,
adult adiposity, and cardiovascular risk factors. The New England Journal of Medicine
365 (20), 1876–1885. https://doi.org/10.1056/NEJMoa1010112.
Kakebeeke, T. H./Lanzi, S./Zysset, A. E./Arhab,
A./Messerli-Bürgy, N./Stuelb, K./Leeger-Aschmann, C. S./Schmutz, E. A./Meyer, A.
H./Kriemler, S./Munsch, S./Jenni, O. G./Puder, J. J. (2017). Association between body
composition and motor performance in preschool children. Obesity Facts 10 (5), 420–431.
https://doi.org/10.1159/000477406.
Koslow, R. E. (1987). Sit and reach flexibility
measures for boys and girls aged three through eight years. Perceptual and Motor Skills
64 (3_suppl), 1103–1106. https://doi.org/10.2466/pms.1987.64.3c.1103.
Krombholz, Heinz (2011). Testbatterie zur
Erfassung motorischer Leistungen im Vorschulalter MoTB 3-7: Beschreibung, Gütekriterien,
Normwerte und ausgewählte Ergebnisse. psychdok 2011. Available online at http://hdl.handle.net/20.500.11780/3358 (accessed
7/11/2021).
Liem, E. T./Lucia Rolfe, E. de/L’Abée, C./Sauer,
P. J. J./Ong, K. K./Stolk, R. P. (2009). Measuring abdominal adiposity in 6 to
7-year-old children. European Journal of Clinical Nutrition 63 (7), 835–841. https://doi.org/10.1038/ejcn.2008.57.
Magnussen, C. G./Koskinen, J./Juonala, M./Chen,
W./Srinivasan, S. R./Sabin, M. A./Thomson, R./Schmidt, M. D./Nguyen, Q. M./Xu,
J.-H./Skilton, M. R./Kähönen, M./Laitinen, T./Taittonen, L./Lehtimäki, T./Rönnemaa,
T./Viikari, J. S. A./Berenson, G. S./Raitakari, O. T. (2012). A diagnosis of the
metabolic syndrome in youth that resolves by adult life is associated with a
normalization of high carotid intima-media thickness and type 2 diabetes mellitus risk:
The Bogalusa heart and cardiovascular risk in young Finns studies. Journal of the
American College of Cardiology 60 (17), 1631–1639. https://doi.org/10.1016/j.jacc.2012.05.056.
Milanese, C./Bortolami, O./Bertucco, M./Verlato,
G./Zancanaro, C. (2010). Anthropometry and motor fitness in children aged 6-12 years.
Journal of Human Sport and Exercise 5 (2), 265–279. https://doi.org/10.4100/jhse.2010.52.14.
Moss, A./Wabitsch, M. (2019). Therapie und
Prävention der Adipositas im Kindes- und Jugendalter: Evidenzbasierte (S3-) Leitlinie
der Arbeitsgemeinschaft Adipositas im Kindes- und Jugendalter (AGA) der Deutschen
Adipositas-Gesellschaft (DAG) und der Deutschen Gesellschaft für Kinder-und
Jugendmedizin (DGKJ): AWMF-Nr. 050-002 Version August 2019. (accessed
2/5/2021).
Müller, M. J./Braun, W./Enderle, J./Bosy-Westphal,
A. (2016). Beyond BMI: conceptual issues related to overweight and obese patients.
Obesity Facts 9 (3), 193–205. https://doi.org/10.1159/000445380.
Musalek, M./Kokstejn, J./Papez, P./Scheffler,
C./Mumm, R./Czernitzki, A.-F./Koziel, S. (2017). Impact of normal weight obesity on
fundamental motor skills in pre-school children aged 3 to 6 years. Anthropologischer
Anzeiger 74 (3), 203–212. https://doi.org/10.1127/anthranz/2017/0752.
Nervik, D./Martin, K./Rundquist, P./Cleland, J.
(2011). The relationship between body mass index and gross motor development in children
aged 3 to 5 years. Pediatric Physical Therapy 23 (2), 144–148. https://doi.org/10.1097/PEP.0b013e318218d356.
Ortega, F. B./Cadenas-Sánchez, C./Sánchez-Delgado,
G./Mora-González, J./Martínez-Téllez, B./Artero, E. G./Castro-Piñero, J./Labayen,
I./Chillón, P./Löf, M./Ruiz, J. R. (2015). Systematic review and proposal of a
field-based physical fitness-test battery in preschool children: The PREFIT battery.
Sports Medicine 45 (4), 533–555. https://doi.org/10.1007/s40279-014-0281-8.
Ortega, F. B./Ruiz, J. R./Castillo, M.
J./Sjöström, M. (2008). Physical fitness in childhood and adolescence: A powerful marker
of health. International Journal of Obesity 32 (1), 1–11. https://doi.org/10.1038/sj.ijo.0803774.
Ortega, F. B./Silventoinen, K./Tynelius,
P./Rasmussen, F. (2012). Muscular strength in male adolescents and premature death:
Cohort study of one million participants. BMJ Clinical research 345, e7279. https://doi.org/10.1136/bmj.e7279.
Poskitt, E. M. (1995). Defining childhood obesity:
The relative body mass index (BMI). European childhood obesity group. Acta Paediatrica
84 (8), 961–963. https://doi.org/10.1111/j.1651-2227.1995.tb13806.x.
Przednowek, K. H./Niewczas, M./Wójcik, Ł./Paśko,
W./Iskra, J./Przednowek, K. (2021). Physical fitness percentiles of Polish children aged
4-7 years. Scientific Reports 11 (1), 7367. https://doi.org/10.1038/s41598-021-86903-x.
Roth, G. A./Mensah, G. A./Johnson, C.
O./Addolorato, G./Ammirati, E./Baddour, L. M./Barengo, N. C./Beaton, A. Z./Benjamin, E.
J./Benziger, C. P./Bonny, A./Brauer, M./Brodmann, M./Cahill, T. J./Carapetis,
J./Catapano, A. L./Chugh, S. S./Cooper, L. T./Coresh, J./Criqui, M./DeCleene, N./Eagle,
K. A./Emmons-Bell, S./Feigin, V. L./Fernández-Solà, J./Fowkes, G./Gakidou, E./Grundy, S.
M./He, F. J./Howard, G./Hu, F./Inker, L./Karthikeyan, G./Kassebaum, N./Koroshetz,
W./Lavie, C./Lloyd-Jones, D./Lu, H. S./Mirijello, A./Temesgen, A. M./Mokdad, A./Moran,
A. E./Muntner, P./Narula, J./Neal, B./Ntsekhe, M./Moraes de Oliveira, G./Otto,
C./Owolabi, M./Pratt, M./Rajagopalan, S./Reitsma, M./Ribeiro, A. L. P./Rigotti,
N./Rodgers, A./Sable, C./Shakil, S./Sliwa-Hahnle, K./Stark, B./Sundström, J./Timpel,
P./Tleyjeh, I. M./Valgimigli, M./Vos, T./Whelton, P. K./Yacoub, M./Zuhlke, L./Murray,
C./Fuster, V. (2020). Global burden of cardiovascular diseases and risk factors,
1990-2019: Update from the GBD 2019 study. Journal of the American College of Cardiology
76 (25), 2982–3021. https://doi.org/10.1016/j.jacc.2020.11.010.
Ruiz, J. R./Castro-Piñero, J./Artero, E.
G./Ortega, F. B./Sjöström, M./Suni, J./Castillo, M. J. (2009). Predictive validity of
health-related fitness in youth: A systematic review. British Journal of Sports Medicine
43 (12), 909–923. https://doi.org/10.1136/bjsm.2008.056499.
Stodden, D. F./Gao, Z./Goodway, J.
D./Langendorfer, S. J. (2014). Dynamic relationships between motor skill competence and
health-related fitness in youth. Pediatric Exercise Science 26 (3), 231–241. https://doi.org/10.1123/pes.2013-0027.
Stodden, D. F./Goodway, J. D./Langendorfer, S.
J./Roberton, M. A./Rudisill, M. E./Garcia, C./Garcia, L. E. (2008). A developmental
perspective on the role of motor skill competence in physical activity: An emergent
relationship. Quest 60 (2), 290–306. https://doi.org/10.1080/00336297.2008.10483582.
Talma, H./van Dommelen, P./Schweizer, J.
J./Bakker, B./Kist-van Holthe, J. E./Chinapaw, J. M. M./Hirasing, R. A. (2019). Is
mid-upper arm circumference in Dutch children useful in identifying obesity? Archives of
Disease in Childhood 104 (2), 159–165. https://doi.org/10.1136/archdischild-2017-313528.
Taylor, R. W./Williams, S. M./Grant, A.
M./Ferguson, E./Taylor, B. J./Goulding, A. (2008). Waist circumference as a measure of
trunk fat mass in children aged 3 to 5 years. International Journal of Pediatric Obesity
3 (4), 226–233. https://doi.org/10.1080/17477160802030429.
Toia, D. de/Klein, D./Weber, S./Wessely, N./Koch,
B./Tokarski, W./Dordel, S./Struder, H./Graf, C. (2009). Relationship between
anthropometry and motor abilities at pre-school age. Obesity Facts 2 (4), 221–225.
https://doi.org/10.1159/000228155.
Wabitsch, M./V Schnurbein, J./Vollbach,
H./Lennerz, B./Weyhreter, H./Wiegand, S./Kiess, W./Hebebrand, J./Brandt, S. (2020).
Innovative medizinische Betreuungskonzepte für Jugendliche mit extremer Adipositas:
nnovative medical care concepts for adolescents with severe obesity.
Bundesgesundheitsblatt, Gesundheitsforschung, Gesundheitsschutz 63 (7), 831–838.
https://doi.org/10.1007/s00103-020-03167-y.
Wells, J. C. K. (2014). Commentary: The paradox of
body mass index in obesity assessment: not a good index of adiposity, but not a bad
index of cardio-metabolic risk. International Journal of Epidemiology 43 (3), 672–674.
https://doi.org/10.1093/ije/dyu060.
Wells, J. C. K./Fewtrell, M. S. (2006). Measuring
body composition. Archives of Disease in Childhood 91 (7), 612–617. https://doi.org/10.1136/adc.2005.085522.
Wood, A. P./McMillan, A. G./Imai, S./Swift,
D./DuBose, K. D. (2021). Associations of Percent Body Fat and Motor Skill Development in
Preschool-Aged Children: National Youth Fitness Survey. Childhood Obesity 18 (1), 50–55.
https://doi.org/10.1089/chi.2021.0026.
 ✉
✉