BackgroundNational Health Surveys have been part of national health services in many countries, but their data are summary compilations and commonly used only for describing trends in health and living conditions.
AimTo statistically disclose networks of interacting variables within National Health Survey data.
Sample and methods We used anthropometric, educational, environmental and economic information of people of Sikkim, West Bengal, Telangana, and Gujarat, India, obtained by the Fifth Indian National Family Health Survey (NFHS-5).
We applied a new statistical approach labeled as “St. Nicholas House Analysis” (SNHA). SNHA ranks absolute bivariate correlation coefficients in descending order according to magnitude. The method creates hierarchic “association chains'' of correlation coefficients defined by sequences where reversing the start and end point does not alter the ordering of elements. Association chains characterize dependence structures within networks of extensively interacting variables.
Results SNHA disclosed fundamental differences in the network of anthropometric, educational, environmental and economic variables of the people of Sikkim, and the people of West Bengal, Telangana and Gujarat. Whereas relevant interactions among these variables were largely absent in the people of Sikkim, the variables formed characteristic star-shaped networks with wealth quintile and the possession of motorcycles in a strong central position, in the people of West Bengal, Telangana and Gujarat.
ConclusionDepicting association chains within networks of extensively interacting variables such as health survey data appears to be a promising statistical tool for disentangling the effects of environmental circumstances, education, and social, economic, political and emotional (SEPE) factors on human growth.
Keywords: Consumer items, national health surveys, associated chains, gross domestic product, anthropometry
Conflict of interest: There are no conflict of interest.
Citation: Soumyajit, S. et al. (2023). Attitude towards purchasing consumer items can be extracted from the Demographic and Health Survey India-2019-2020 (NFHS 5). Human Biology and Public Health 2. https://doi.org/10.52905/hbph2023.2.72.
Copyright: This is an open access article distributed under the terms of the Creative Commons Attribution License which permits unrestricted use, distribution, and reproduction in any medium, provided the original author and source are credited.
Association chains within networks of extensively interacting variables such as health survey data are promising statistical tools for disentangling the effects of environmental circumstances, education, and social, economic, political and emotional (SEPE) factors on human growth.
Contents
Introduction
National health surveys have been part of the national health services in many countries around the world. They are considered a principal source of information on the health of the civilian population to document statistical information on the amount, distribution, and effects of illness and disability. In the US, National Health Interview Surveys were initiated in July 1957 following the National Health Survey Act of 1956 (latest data:CDC 2019). Similar considerations have led to the design of national health surveys in England to monitor trends in the health, and health related behaviors, of adults and children in England (latest data: Health Survey for England - NHS Digital 2023). Descriptive statistics offer regular information on trends of height, weight, smoking behavior, general health, and many other variables. Meanwhile national health surveys have been established in many countries worldwide including India. The Indian National Family Health Survey (NFHS) is a large-scale, multi-round survey conducted in a representative sample of households throughout India (International Institute for Population Sciences 2023). Since 1992, five survey rounds have been undertaken. These surveys provided information on fertility, infant and child mortality, family planning use, maternal and child health, reproductive health, and nutrition in India, with additional information on education and the environmental situation including sanitation, water supply, and general household wealth. However, these data are summary compilations and lack information about the internal relationships that exist between the single variables. Health, economic, and environmental variables tend to extensively interact and form complex networks that can be of major interest for the general understanding and for the planning of public health actions. We became interested in analyzing and particularly in visualizing such networks. We chose NFHS data obtained from Sikkim, West Bengal, Telangana, and Gujarat as an appropriate example for such type of public health survey data.
Sikkim is a mountainous state situated in the Eastern Himalaya. For centuries Sikkim was ruled by Buddhist priest-kings and became part of British India in 1890. Following Indian independence, Sikkim continued as a protectorate status within the Union of India and joined India in 1973 as its 22nd state. Sikkim’s economy is mainly based on agriculture. The people enjoy a high literacy rate and the second highest per capita income among the Indian states. The predominant religions are Hinduism (57.76%) and Vajrayana Buddhism (27.39%) (Census 2011).
Based on personal experience (we found the people of Sikkim very special with almost no modern kitchen furnaces, no central heating, and no hot water even in modern houses of academic persons) and in regard of the prevalence of Buddhist religion supporting a general disinterest in the desire for earthly goods, and the strong public attitude towards happiness and sustainable rather than economically driven agriculture (Government of Sikkim 2023), we hypothesized that (1) the people of Sikkim differ in their attitude towards purchasing consumer items from the people of other Indian states and that (2) differences in these attitudes, if present, are extractable parameters from national health survey data. For comparison we chose West Bengal (East) as a state neighboring Sikkim, Telangana (South) as an example of a state economy that is predominantly driven by agriculture but has shown a recent change towards industrialization, and in that, similar to Sikkim, whereas according to popular wisdom, Gujarat (West) is populated by people who have “money in their blood” (PM Narendra Modi in Tokyo - Tv9 Gujarati - video Dailymotion 2023).
Sample and Methods
Data collection
We analyzed information obtained from the Fifth National Family Health Survey (NFHS-5 2022). The NFHS is a large-scale, multi-round survey conducted in a representative sample of households throughout India. The NFHS is a collaborative project of the International Institute for Population Sciences (IIPS), Mumbai, India; ICF, Calverton, Maryland, USA and the East-West Center, Honolulu, Hawaii, USA (International Institute for Population Sciences 2023). We used data of adults (one or several adults per household) from Sikkim, West Bengal, Telangana, and Gujarat, on household size, type of house, wealth, sanitation, and quality of the drinking water. We also analyzed highest levels of attained education, and the possession of a motorcycle, a refrigerator, and television, as typical consumer items that are present in many but not all households, as well as mid-upper arm circumference (MUAC), hip and waist circumference as a cluster of variables related to body fat deposition. The latter was taken as an indirect estimate of the nutrition status. Height SDS were calculated according to WHO reference (WHO 2022).
Possession of consumer items was scaled as “present” (yes) or “absent” (no). Ordinal data mostly related to socio-economic parameters were ranked as follows:
type of sanitation facility:
•
rank 1: no facility/bush/field or composting toilet
•
rank 2: pit latrine without slab/open pit
•
rank 3: ventilated improved pit latrine or pit latrine with slab
•
rank 4: flush to septic tank, pit latrine or flush to any other location
•
rank 5: flush to piped sewer system
highest level of education:
•
rank 1: no education
•
rank 2: primary
•
rank 3: secondary
•
rank 4: higher/university
source of drinking water:
•
rank 1: river/dam/lake/ponds/stream/canal/irrigation channel, or unprotected dug well/spring and unknown sources
•
rank 2: protected spring
•
rank 3: tube well, protected well or borehole
•
rank 4: public tap/standpipe, or tanker truck, or cart with small tank
•
rank 5: piped water into dwelling/yard/plot/neighbor, or bottled water
type of fuel for cooking:
•
rank 1: agricultural crop
•
rank 2: animal dung, or wood
•
rank 3: charcoal, or coal/lignite
•
rank 4: kerosene, or biogas, or liquefied petroleum gas
•
rank 5: electricity
type of house:
•
rank 1: kachha (mud house)
•
rank 2: semi-puc (wall concrete, roof thatched or wall mud and roof tiles or metal)
•
rank 3: pucca (concrete house)
Statistics
We disentangled the complex dependence structures of anthropometric, social, and economic variables using St. Nicolas House Analysis (SNHA). This method ranks absolute bivariate correlation coefficients in descending order according to magnitude and thereby creates hierarchic “association chains”.
Let us assume a small correlation matrix with the variables A, B, C, and D. All variables correlate with each other at various magnitudes so that they can be ranked according to magnitude. If the correlation, r, between A and B (|rAB|) is larger than the correlation between A and C (|rAC|), and if the correlation between A and C again is larger than the correlation between A and D (|rAD|), we can rank the three correlation coefficients: |rAB| > |rAC| > |rAD|, and get the hierarchic chain A-B-C-D. When inverting this sequence and starting with endpoint D, and when this results in the inverted order: |rDC|, |rDB|, |rDA|, i.e. when we get the inverted hierarchic chain D-C-B-A, we name this sequences of correlation coefficients that are characterized by descending order when starting from either end, an “association chain”. Association chains can be translated into network graphs. They immediately visualize extensive interacting variables in an explorative manner (Hermanussen et al. 2021).
All calculations were conducted with the programming language R version 3.6.3. (R Core Team 2022) which is a free software under the terms of the Free Software Foundation’s GNU General Public License in source code form. The corresponding R-code is available on request from the author of this paper, Dr. Detlef Groth, University of Potsdam, Germany.
Results
Table 1 summarizes mean values and standard deviations of 16 variables extracted from the NFHS, by state.
Table 1 Mean values and standard deviations (for interval scaled variables) as extracted from the NFHS for four Indian states, of mid-upper arm circumference (MUAC), waist circumference (WaiC), hip circumference (HipC), highest attained education (edu), source of drinking water (drink), wealth quintile, type of house, family size (household members), type of sanitation (sanitation), source of fuel for cooking (fuel), and possession of television, motorcycle and refrigerator.
State
number
age (years)
height SDS
MUAC
WaiC
HipC
edu
drink
Sikkim
2745
33.48
-1.86
25.17
82.44
91.44
2.74
3.08
mean
8.05
1.02
3.37
13.36
13.83
SD
West Bengal
17508
33.68
-0.26
23.67
79.54
89.38
2.44
3.58
mean
8.78
0.87
4.36
24.20
24.97
SD
Telangana
3943
26.39
-1.18
24.51
77.40
91.98
2.81
3.23
mean
4.13
1.66
3.87
46.17
45.39
SD
Gujarat
6027
27.88
-1.30
24.19
76.00
90.62
2.57
3.32
mean
4.84
1.74
3.50
33.91
31.16
SD
wealth quintile
type of house
household members
sanitation
fuel
Television
motorcycle
refrigerator
Sikkim
2.56
2.57
4.07
3.92
2.36
82%
12%
33%
mean
1.82
SD
West Bengal
2.98
2.49
4.70
3.25
1.66
66%
25%
32%
mean
2.01
SD
Telangana
2.82
2.63
5.28
3.46
2.81
86%
39%
66%
mean
1.97
SD
Gujarat
2.69
2.64
6.47
3.18
2.13
72%
47%
68%
mean
2.49
SD
Sikkimese are shortest with an average height SDS of -1.86. The neighboring West Bengalis are some 1.5 height SDS taller. Sikkim people have highest MUAC, hip and waist circumference and thus, appear well-nourished, which further signifies that wealth accumulating is not a single factor through which we can signify different forms of malnutrition.
The number of motorcycles was lowest in Sikkim, the number of refrigerators was also low compared with the climatically warmer states Telangana and Gujarat. Due to the large number of households studied, almost all differences depicted in the table are statistically significant.
Cluster analysis emphasized strong cohesiveness of the nutritional variables MUAC, hip and waist circumference. The nutritional cluster is visible in all states (Figure 1 shows the states of Sikkim and Gujarat). In the Sikkimese, wealth and the possession of refrigerators form a second cluster, with education being adjacent, whereas in the Gujarati, wealth, sanitation and the consumer items primarily cohere.
Figure 1 Cluster dendrogram of the 15 variables from the people of Gujarat (left) and Sikkim (right). The dendrogram refers to possession of television (tele), possession of motorcycles (cycle), body height SDS (Heigh), source of fuel for cooking (fuel), mid-upper arm circumference (MUAC), waist circumference (WaiC), hip circumference (HipC), source of drinking water (drink), family size (membe), highest attained education (edu), possession of refrigerator (refr), wealth quintile (Wealt), type of sanitation (san), and type of house (hous).
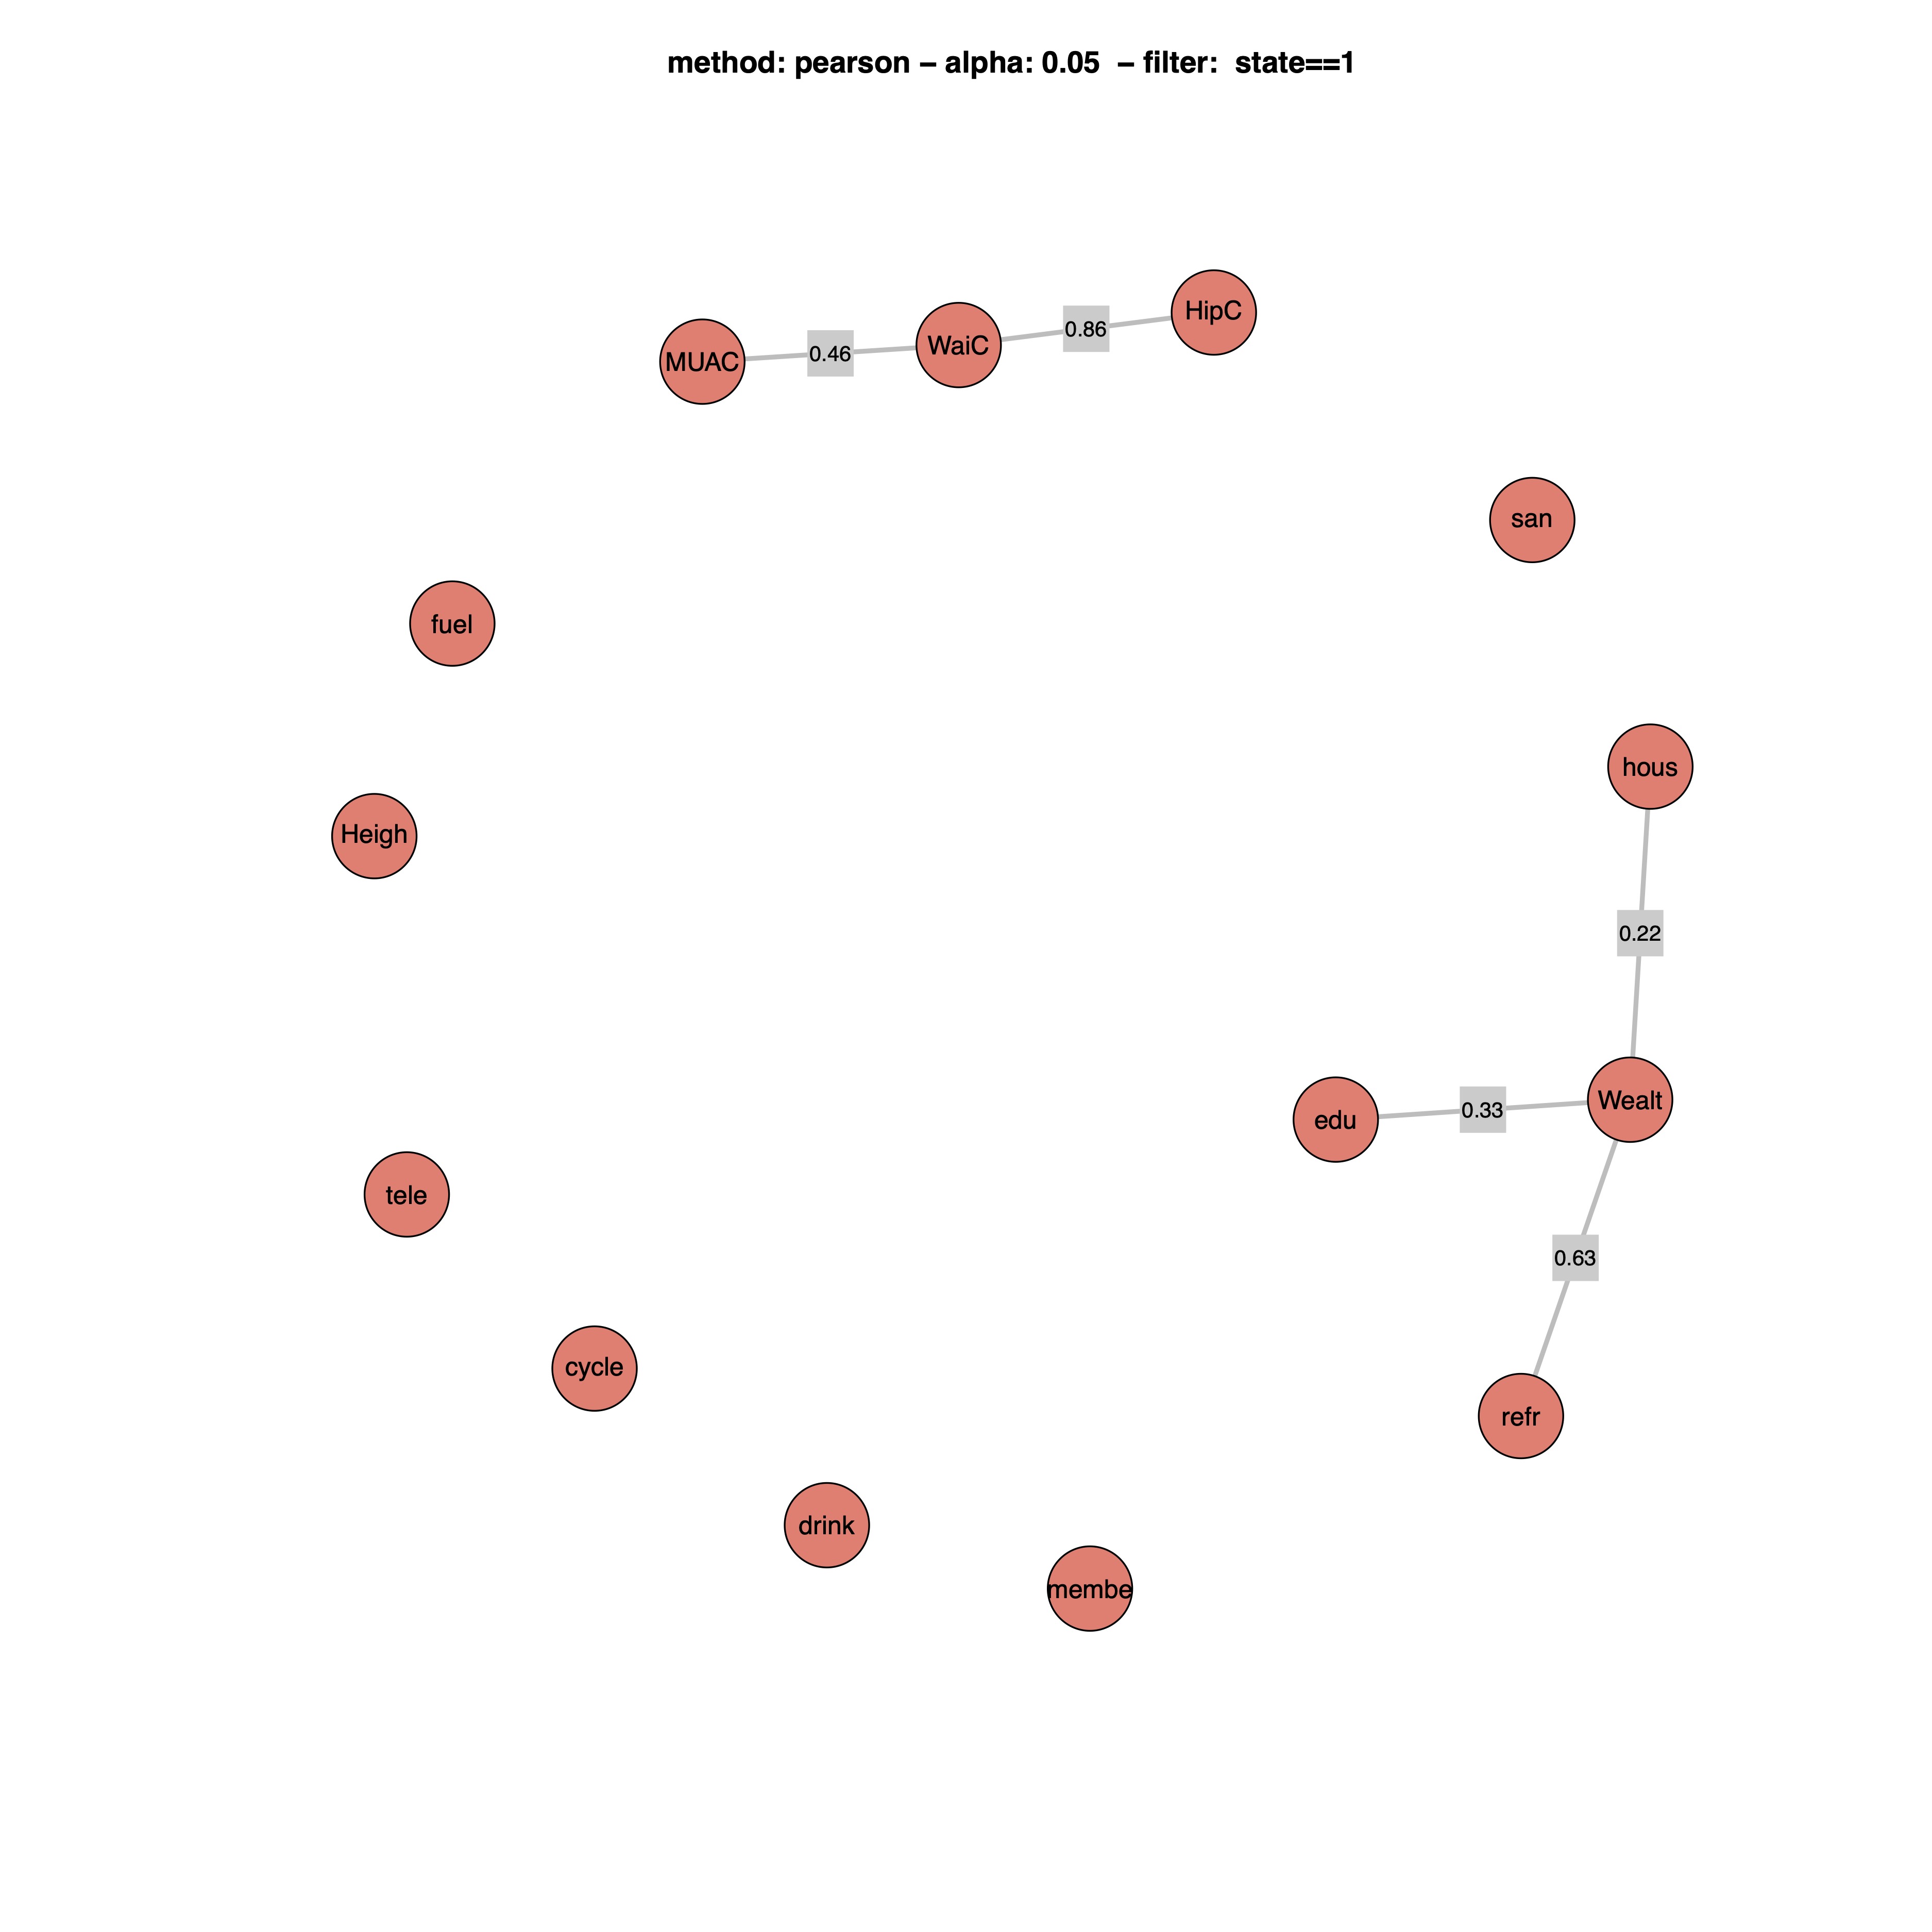
St. Nicholas House Analysis (SNHA) further disclosed the fundamental differences between Sikkimese, Bengalese, and the people of Telangana and Gujarat (Figure 2). In all four states, the close association between MUAC, hip and waist circumference reflect the cohesiveness of the nutritional cluster. In addition, Figure 2 reiterates the association between wealth and refrigerators in the Sikkimese and adds the impact of education (r=0.33 p<0.01) on wealth and the association between wealth and type of house (r=0.22 p<0.01). The other variables appeared unrelated by SNHA.
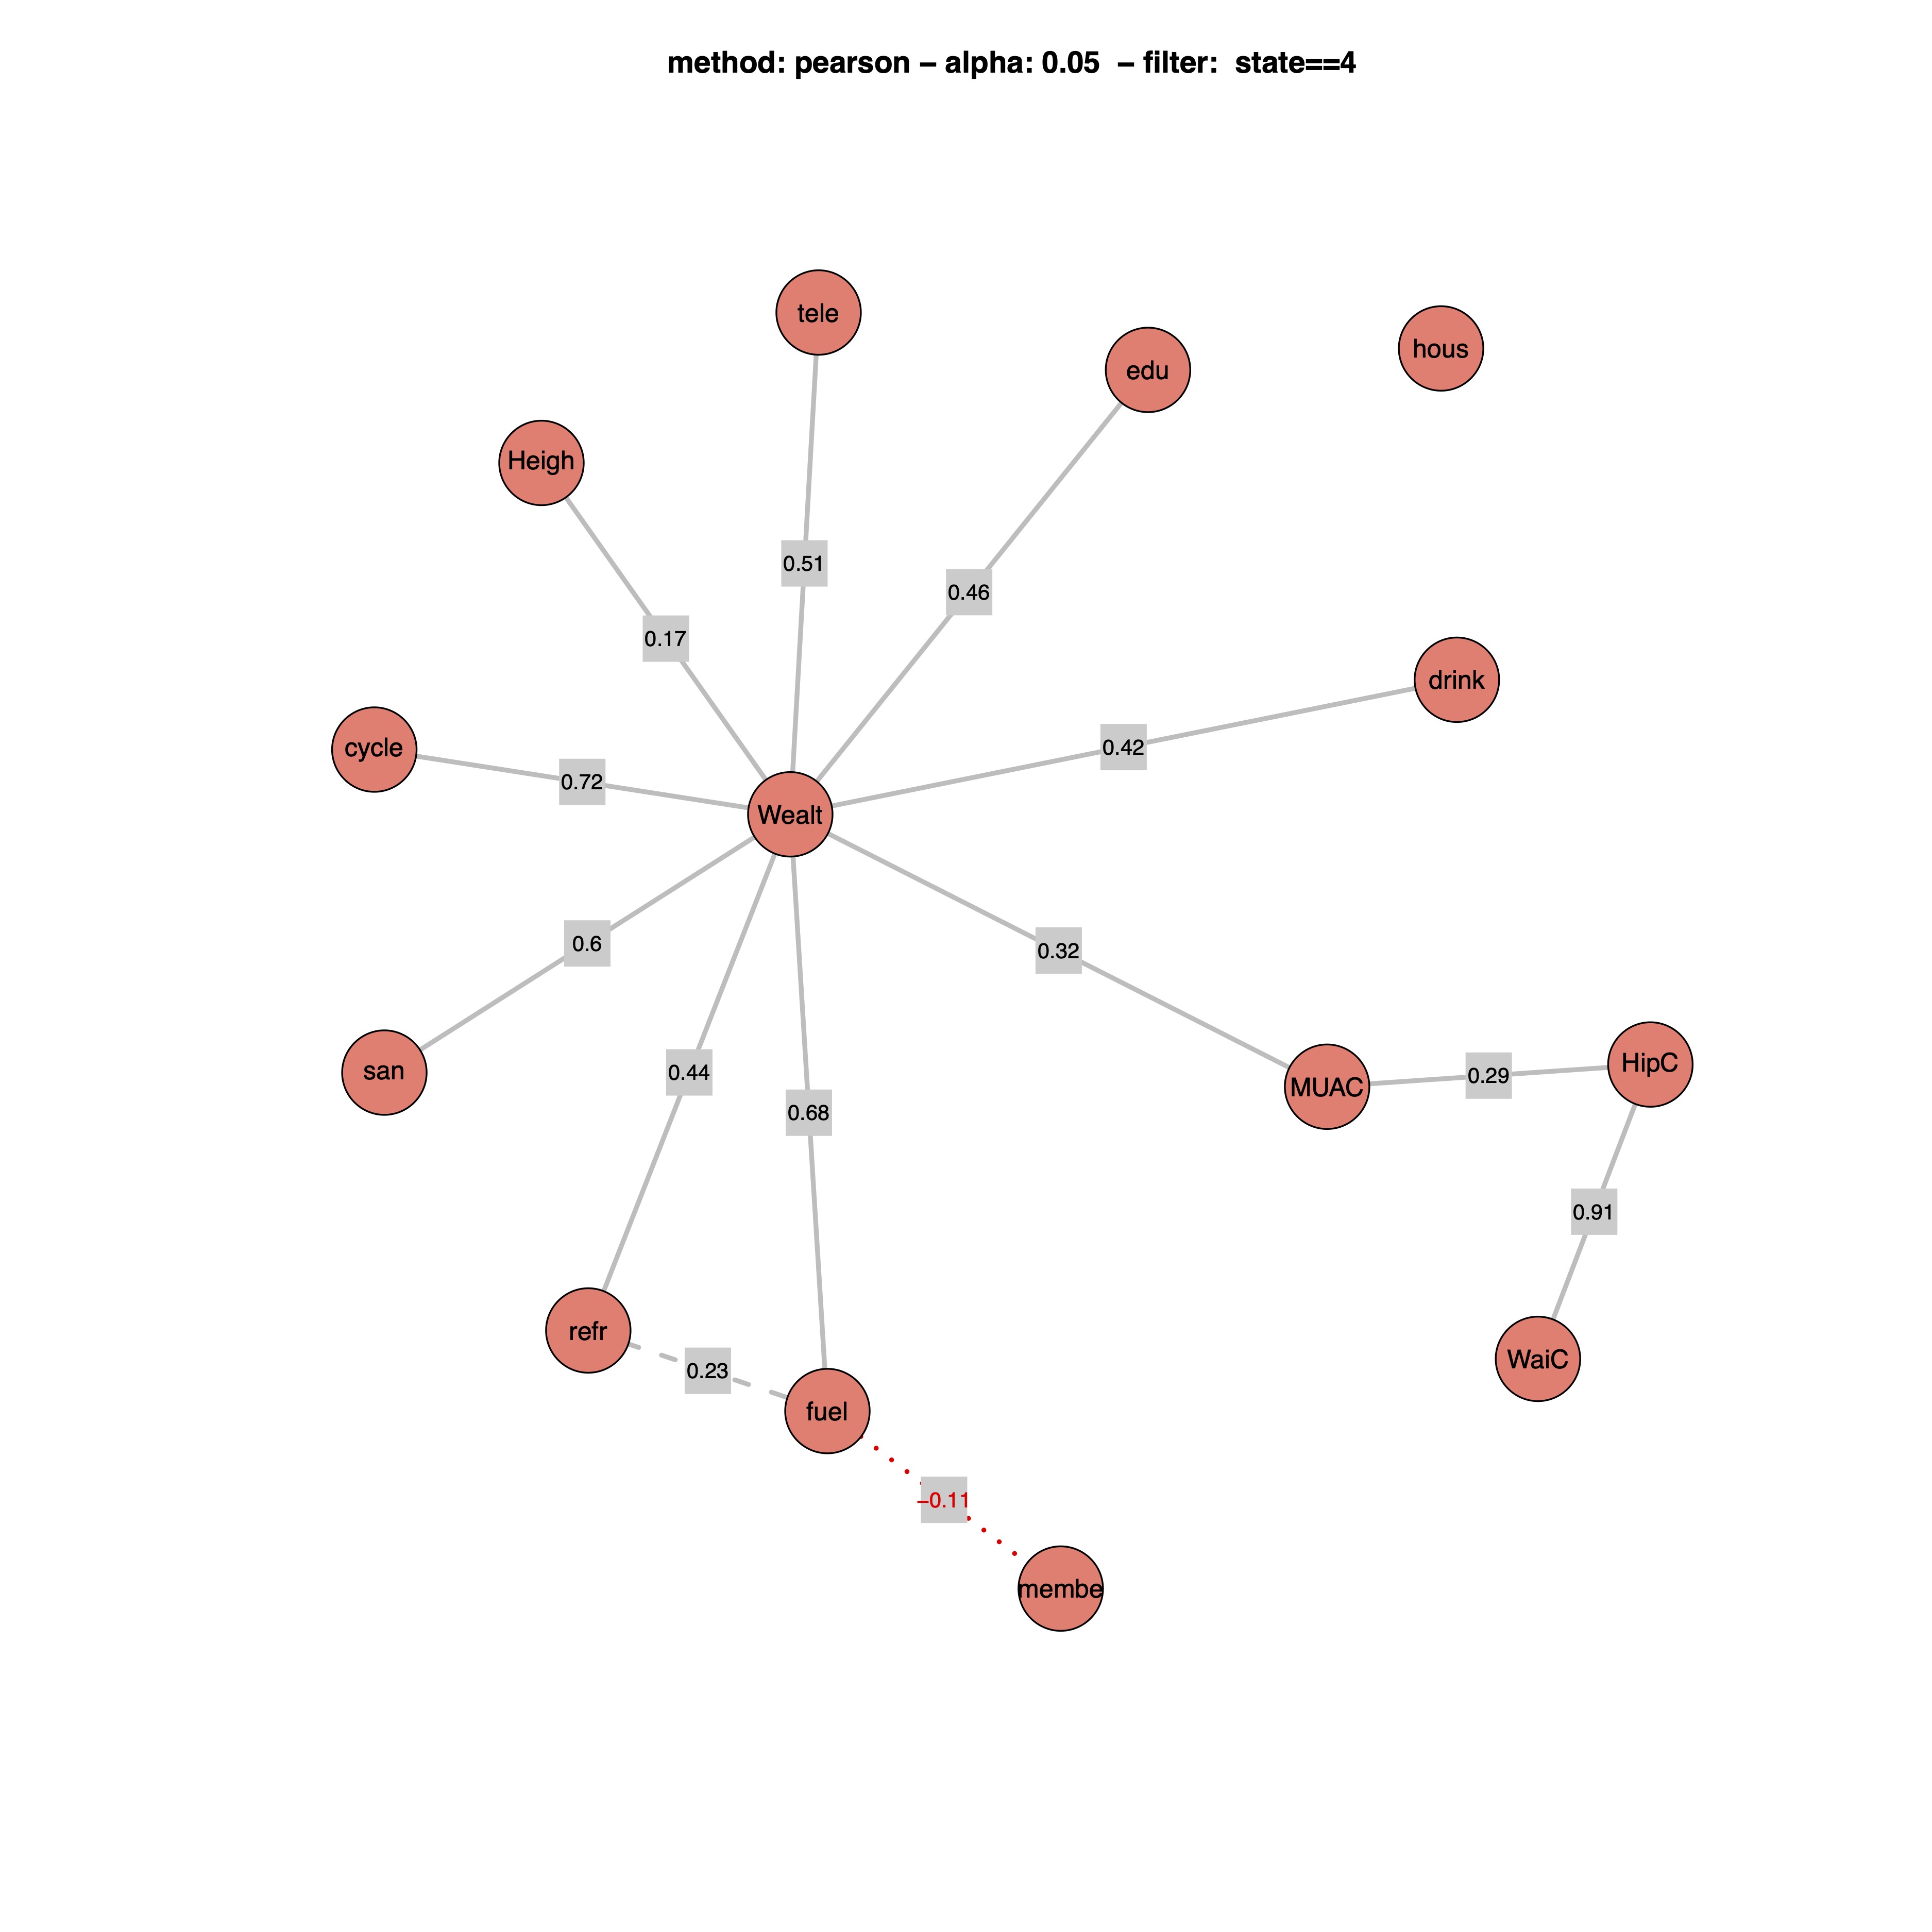
This was different in the Gujarati. Figure 2 seems to virtually obtrude the common prejudice of “money in the blood”. The variable wealth is centrally situated and connected with all consumer items and education. Also, the nutritional variables and body height connect to wealth indicating the central position of wealth also for physical growth and body composition. The effects of family size and type of household were negligible.
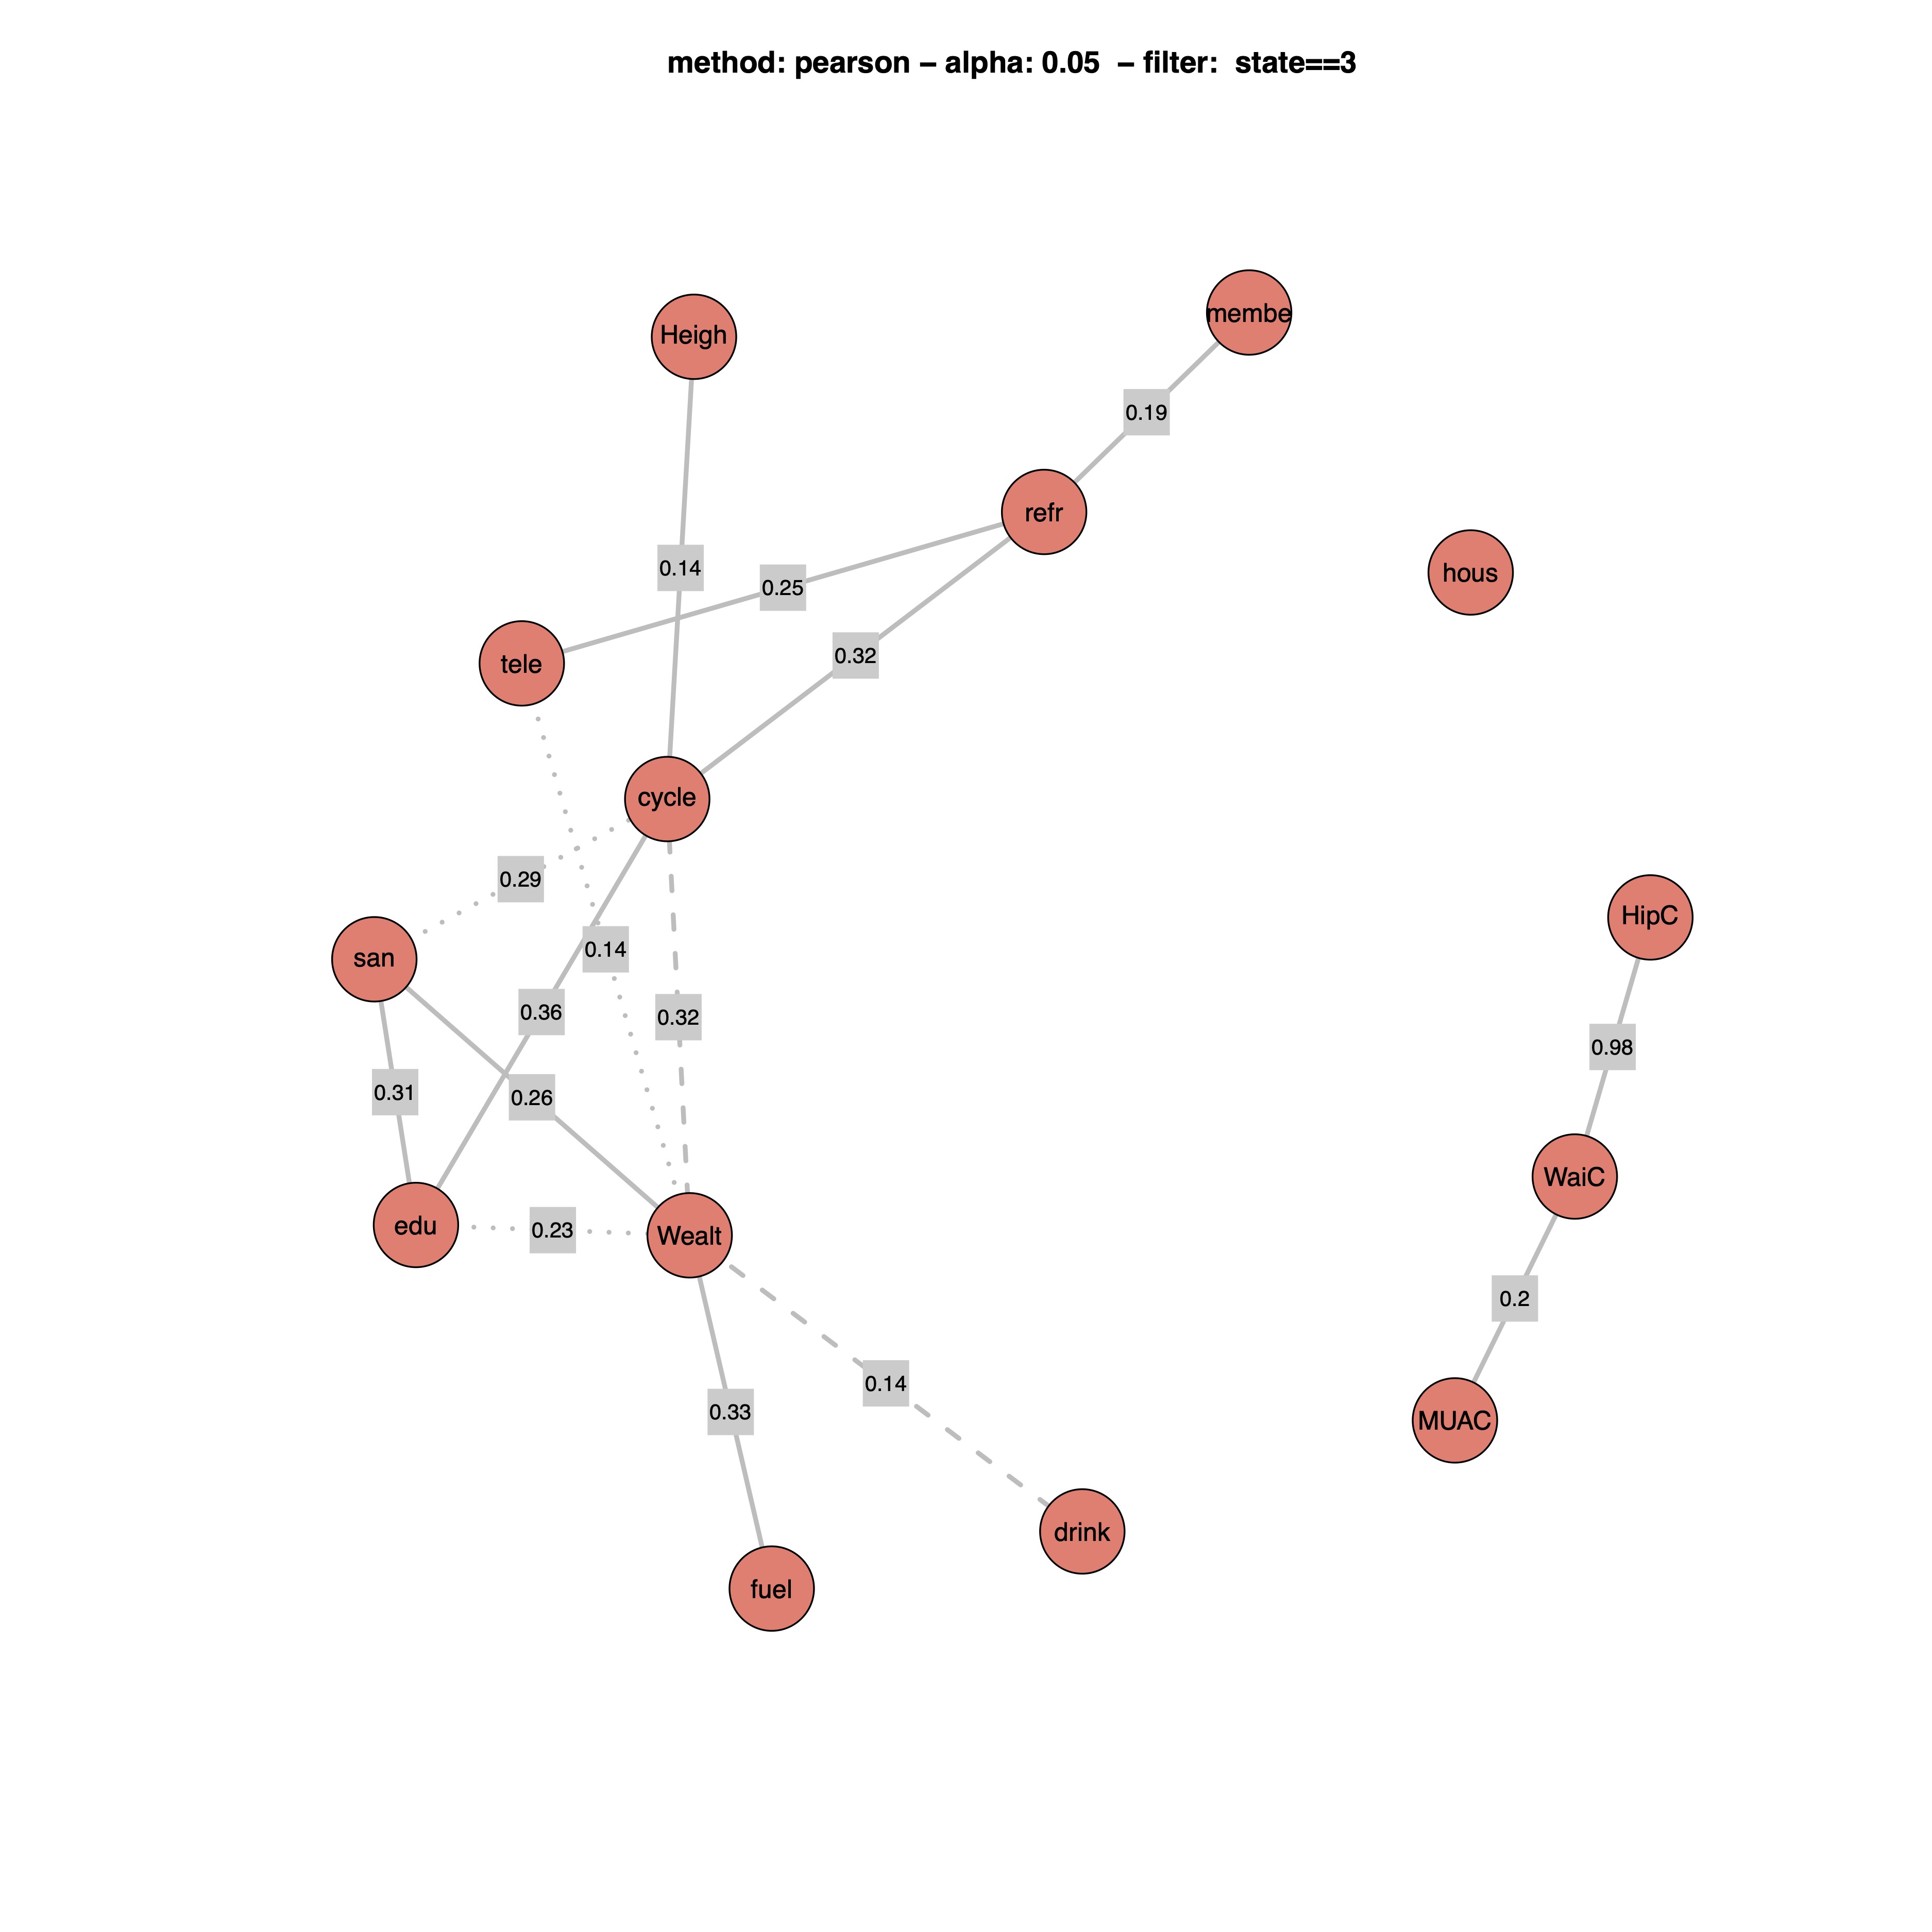
Figure 2 St. Nicholas House graph (Hermanussen et al. 2021) of different Indian states (state1 = Sikkim, state2 =West Bengal, state3 = Telengana, state4 = Gujarat). The abbreviations correspond to Figure 1. Sikkim is characterized by two obvious clusters, the nutrition-related variables MUAC, HipC, and WaiC and a quadruplet of wealth, education, type of house and the possession of a refrigerator. The cluster of nutrition-related variables is also apparent in West Bengal and Telangana as a separate entity and only in Gujarat, it appears to be linked to wealth. In Gujarat, most variables center around wealth, in West Bengal, they center around the motorcycle, and in Telangana, they form clusters including wealth and motorcycles. Through lines indicate that more than 75% of the results are identical when randomly resampling with replacement (bootstrapping), dashed lines indicate resample identity of association chains of more than 50%, stippled lines indicate resample identity of more than 25%.
The SNHA network of the people of Telangana partially resembled that of West Bengal and Gujarat in that wealth closely connects to consumer items and education, but has no association with the nutrition-related cluster MUAC, hip and waist circumference. Quite in contrast to the common expectation that wealth and body height are related, the association between these two variables was weak or even absent as in West Bengal that is known for its poverty (Ministry of Statistics and Programme Implementation 2021).
Discussion
We used National Health Survey data of Sikkim, West Bengal, Telangana and Gujarat. Whereas these data are commonly used as compilations for describing temporary trends in health and living conditions, the present study is focused on the momentary dependence structure among the single variables and visualizes the interactive network of associations that exist within the biological and the sociocultural variables of the National Health Survey data.
The study confirms the first hypothesis that modern Sikkimese differ in their attitude towards purchasing consumer items compared to the people of other Indian states. Sikkimese are comparably wealthy with a per capita gross domestic product (GDP) of US$ (Database of Indian Economy 2023) compared with US$ 1735 in West Bengal, US$ 3333 in Telangana and US$ 3056 in Gujarat. But they are short in body height, have highest MUAC, hip and waist circumference, and they possess the least number of motorcycles and the second least number of refrigerators. The differences in the mean values of the other variables when compared to the people of West Bengal, Telangana and Gujarat are small and of questionable relevance. Differences in the patterns of variables between Sikkimese and Gujarati become evident when applying St. Nicholas House Analysis (SNHA). SNHA significantly improves the disclosure of the fundamental differences between the populations of Sikkim, West Bengal, Telangana and Gujarat in regard to the anthropometric, environmental and economic variables obtained from the National Health Survey 5, and thus, also supports the second hypothesis in those differences in the attitude towards life, if present, are extractable parameters from national health survey data.
Depicting association chains easily visualizes the central position of wealth, respectively the possession of selected consumer items as a substitute for wealth, in three of the four states, and the absence of these associations in Sikkim, thereby confirming our second hypothesis that differences among states in the attitude towards purchasing consumer items are extractable parameters from national health survey data. SNHA also confirms the association between education and economic prosperity. The impact of educational attainment on individual earning and social class mobility is well known in the current literature (Hussein 2021), and highlighted by more than 900 pubmed entries using the key words “education level” and “economic wealth”.
Sikkim is prosperous and ranks at 2nd, Telangana at 9th, Gujarat at 10th and West Bengal at 24th position for per capita GDP among the Indian states (Statistics times 2021). The discrepancy between registered per capita GDP of the Sikkimese and their consumer behavior, and on the other hand, the interest in wealth acquisition, consumer items and motorized mobility found in the states of Gujarat, Telangana and West Bengal, question the comm on perception that “money in the blood” may result in economic prosperity. Additional research is needed to localize critical circumstances that may have contributed to the economic prosperity of the Sikkimese, be it their religious background focusing on the overcoming the suffering (duḥkha) caused by desire (taṇhā) and ignorance (avidyā) of reality's true nature (Encyclopedia of Buddhism 2023), or current public preferences for happiness and sustainable rather than economically driven agriculture (Government of Sikkim 2023) or social features that distract from the prime focus on economy. Yet, we decided to not getting deeper into this topic as this was not the purpose of the present study.
We conclude that depicting association chains within extensively interacting variables such as provided by national surveys appears to be an interesting statistical tool for the disentanglement of environmental circumstances, education, and social, economic, political and emotional (SEPE) factors on human growth (Bogin 2021).
References
Bogin, B. (2021). Social-Economic-Political-Emotional (SEPE) factors regulate human growth. Human Biology and Public Health 1. https://doi.org/10.52905/hbph.v1.10.
Dailymotion (2023). PM Narendra Modi in Tokyo - Tv9 Gujarati - video Dailymotion. ''I am 'Gujarati', Money is in my blood'', says PM Narendra Modi. Available online at https://www.dailymotion.com/video/x252ayo (accessed 10/30/2023).
Hermanussen, M./Aßmann, C./Groth, D. (2021). Chain reversion for detecting associations in interacting variables—St. Nicolas House Analysis. International Journal of Environmental Research and Public Health 18 (4), 1741. https://doi.org/10.3390/ijerph18041741.
Hussein, A. (2021). The impact of educational attainment on individual earning and social class mobility.
International Institute for Population Sciences (2023). National Family Health Survey. Available online at http://rchiips.org/nfhs/about.shtml (accessed 10/27/2023).
 ✉
✉