BackgroundPrevious research has suggested that body mass index (BMI) and body height are
associated with intelligence quotient (IQ) in older children and adults. However, due to
the limited number of studies in this age group, there is a lack of consensus on whether
there are relationships between IQ and some anthropometric measures, including sex,
among preschool-aged children.
ObjectivesThis study aimed to assess whether there is a significant relationship between sex,
BMI, height IQ, and subsets of IQ among preschool-aged children.
Sample and Methods59 preschoolers aged 4.01 to 4.99 years were sampled from selected preschools in
Prague. Data on sex, weight and height were collected, and IQ was assessed using the
IDS-P. The data were processed using the St. Nicolas house analysis, t-tests and
multiple regression.
ResultsMultiple Regression Analysis and St. Nicolas house analysis failed to show any
significant relations between sex, BMI, height, and IQ subtests score (p>0.05).
ConclusionIn this study, no significant associations were found between sex, BMI, height, and IQ
in preschool-aged children. The relationships among sex, BMI, height, and IQ are more
complex. For a better understanding, it is therefore essential to have larger sample
sizes and to understand these interactions within context and with other confounding
social-economic-political-emotional l (SEPE) variables, as suggested in previous
studies.
Keywords: anthropometry, sex, preschool, intelligence quotient, early childhood
Conflicts of interest: There are
no conflicts of interest.
Citation: Malambo, C. / Musálek, M. (2023). No association between anthropometry and IQ in Czech preschool
children. Human Biology and Public Health 1. https://doi.org/10.52905/hbph2023.1.65.
Copyright: This is an open access article distributed under the terms of the Creative Commons Attribution License which permits unrestricted use, distribution, and reproduction in any medium, provided the original author and source are credited.
There is no association between sex, BMI, height, and IQ among the preschool-aged
children. The relationship between sex, BMI, height, and IQ is more complex and should be
understood within context and with other confounding social, economic, political, and
emotional (SEPE) variables.
Contents
Introduction
Previous research has suggested that anthropometric parameters such as body height and body
mass index (BMI) may be associated with a child’s cognitive and executive functions and
overall intelligence quotient (IQ) at different ages (height – positively; BMI – negatively)
(Kanazawa and Reyniers, 2009).
Though interesting, findings on this topic are generally inconsistent. For instance, some
studies showed inverse relationships between anthropometric parameters such as BMI, height,
and IQ, others showed no associations at all (Kahn and
Williamson, 1990; Lahmann et al.,
2000).
Height and intelligence might be related due to assortative mating patterns (Kanazawa and Reyniers, 2009). Even after controlling for
confounding factors such as health, ethnicity, and socio-economic status (SES), height was
strongly associated with intelligence in both sexes (Kanazawa and Reyniers, 2009). Similarly, Beauchamp et al., 2011 discussed the robust
positive correlation between height
and intelligence, as measured by IQ tests, and found suggestive evidence of a shared genetic
architecture with height. They also stressed the impact of assortative mating and
highlighted the significant within-family correlation between height and intelligence (Beauchamp et al., 2011).
Benyamin et al. surveyed a cohort of young individuals and revealed a noteworthy link
between stature and cognitive ability in 11-year-old Scottish children (Benyamin et al., 2005). Wheeler and co-workers (Wheeler et al., 2004) affirmed a positive correlation
between height and intelligence quotient (IQ) in various age groups. Silventoinen et al.
conducted a study in Sweden. They found a strong association between growth velocity and IQ
and observed that men who were initially short at birth but ultimately achieved standard
adult height displayed greater intellectual capacity than those who remained short
throughout adulthood (Silventoinen et al.,
2006).
In contrast, BMI and intelligence seem to be negatively correlated, especially in
adulthood. Some argue that obese people are more likely to develop an increased vascular
risk that can worsen neurodegeneration, resulting in greater cognitive decline (Corley et al., 2010; Cournot et al., 2006; Dahl et al., 2013).
Obesity has been associated with brain-derived neurotrophic factor (BDNF); however, the
impact of this association remains unclear (Sandrini
et al., 2018). Dahl et al. found that being overweight at 40 years predicted greater
cognitive decline after the age of 60 (Dahl et al.,
2013). More intelligent people may be more likely to eat a healthy diet and
exercise more often (Halkjær et al., 2003; Nguyen et al., 2014). Other studies highlighted the
mediating role of SESs in healthy behavior and its role in healthy eating and physical
activity (Murray et al., 2012). In summary, the
association between IQ, BMI, and body height is well established in older children and
adults, but sufficient information on preschool-aged children is still lacking.
Only a few studies addressed this issue but came to different conclusions. An earlier study
by Pollitt and Mueller conducted in a well-nourished preschool population found that
children with advanced physiological maturation tended to have high IQs (Pollitt and Mueller, 1982). Tabriz et al. alluded to
the mediating role of SES when they found that low IQ score was associated with high BMI
(Tabriz et al. et al., 2015). Yu et al. found an inverse
association between IQ and obesity in a systematic review and meta-analysis, except for
preschool children, that however disappeared when adjusting for educational attainment (Yu et al., 2010). Azurmendi et al. performed two
subsets of the K-BIT test, namely, the matrices subtest and vocabulary subtest, and an IQ
composite score of the two subtests to study the relation between various cognitive
abilities (Azurmendi et al., 2005). They found
inconsistent results and suggested that the most accurate predictors of certain cognitive
capacities, particularly vocabulary abilities, affective labelling, and IQ composite, were
BMI and androstenedione (Azurmendi et al., 2005). On
the other hand, Patil et al. assessed anthropometry, dietary recall, and intelligence
(Intelligent Quotient-IQ) in 3 to 7 year old children from rural Anganwadis in India and
reported that despite high prevalence of malnutrition, there was no correlation between
anthropometry and IQ (Patil et al., 2020).
Several studies showed a lack of correspondence between IQ and various anthropometric measures
in preschool-aged children. To the best of our knowledge,
only one study attempted to examine cognitive abilities in relation to anthropometric
measurements. Most studies evaluated intelligence based on global IQ scores alone which may
not capture the full range of associations between anthropometric measures such as height
and BMI, and IQ in preschool children. Our study aims to investigate the association between
height, BMI, sex, and cognitive abilities related to visual processing, selective attention,
phonological memory, visual memory, auditory memory, conceptual thinking, constructive
thinking and overall IQ in preschool-aged children in the Czech Republic. We hypothesized
that height, BMI, and sex are positive predictors of cognitive abilities.
Sample and Methods
Participants
This cross-sectional study was conducted in 59 healthy 3.6–5 (mean=4.5, SD=0.4) year old
preschool children (28 boys, 31 girls). The children attended four kindergartens in
Prague. The study and consent procedures were approved by the Ethics Committee of the
Faculty of Physical Education and Sports. All parents provided written informed consent to
participate in this study of their child.
Study duration and time frame:
The study was conducted between 1st March and 30th June 2021.
Instruments
Anthropometric measurements
A qualified examiner assessed each anthropometric characteristic using the Eston and
Reilly manual (Eston et al. 2009). Body height
measurements were taken with a portable anthropometer P375 and recorded to the nearest
0.1 cm. Body weight was measured using a calibrated scale to the nearest 0.1 kg.
BMI was calculated as weight in kilograms divided by the square of height in meters and
converted to BMI z-score based on Czech growth standards (Vignerova et al., 2006).
Measurement of cognitive function
IQ was evaluated using the IDS-P (Hagmann-von Arx
et al., 2018). This test battery is a revised version of the Intelligence and
Development Scale (Grob et al. 2009). The IDS
showed high reliability and validity (Hagmann-von Arx et al., 2013, 2012, 2008), whereas the IDS-P has strong
construct validity (Grieder and Grob, 2020).
The IDS-P assesses cognitive ability and growth in several fundamental areas (e.g.,
executive functions, psychomotor skills, social-emotional competencies, scholastic
skills and attitudes towards work). For the present study, seven subtests, namely visual
processing, selective attention, phonological memory, visual memory, auditory memory,
conceptual thinking and constructive thinking, were included. The global IQ score was
obtained by adding all subset scores. Raw scores of all tests were transformed into
standard scores normalized to age and sex.
We used St. Nicolas House Analysis (SNHA) (Hermanussen et al., 2021) to obtain a first impression of the data. The data
set was analyzed using Shapiro-Wilk normality test to check for normal distribution.
Subsequently, we used a correlation matrix (Spearman) and a multivariate regression
model with the dependent variable IQ, including the subtests and the following
predictors: BMI, height and sex. For data analysis, we used RStudio, an open-source
program (R Core Team, 2021).
Results
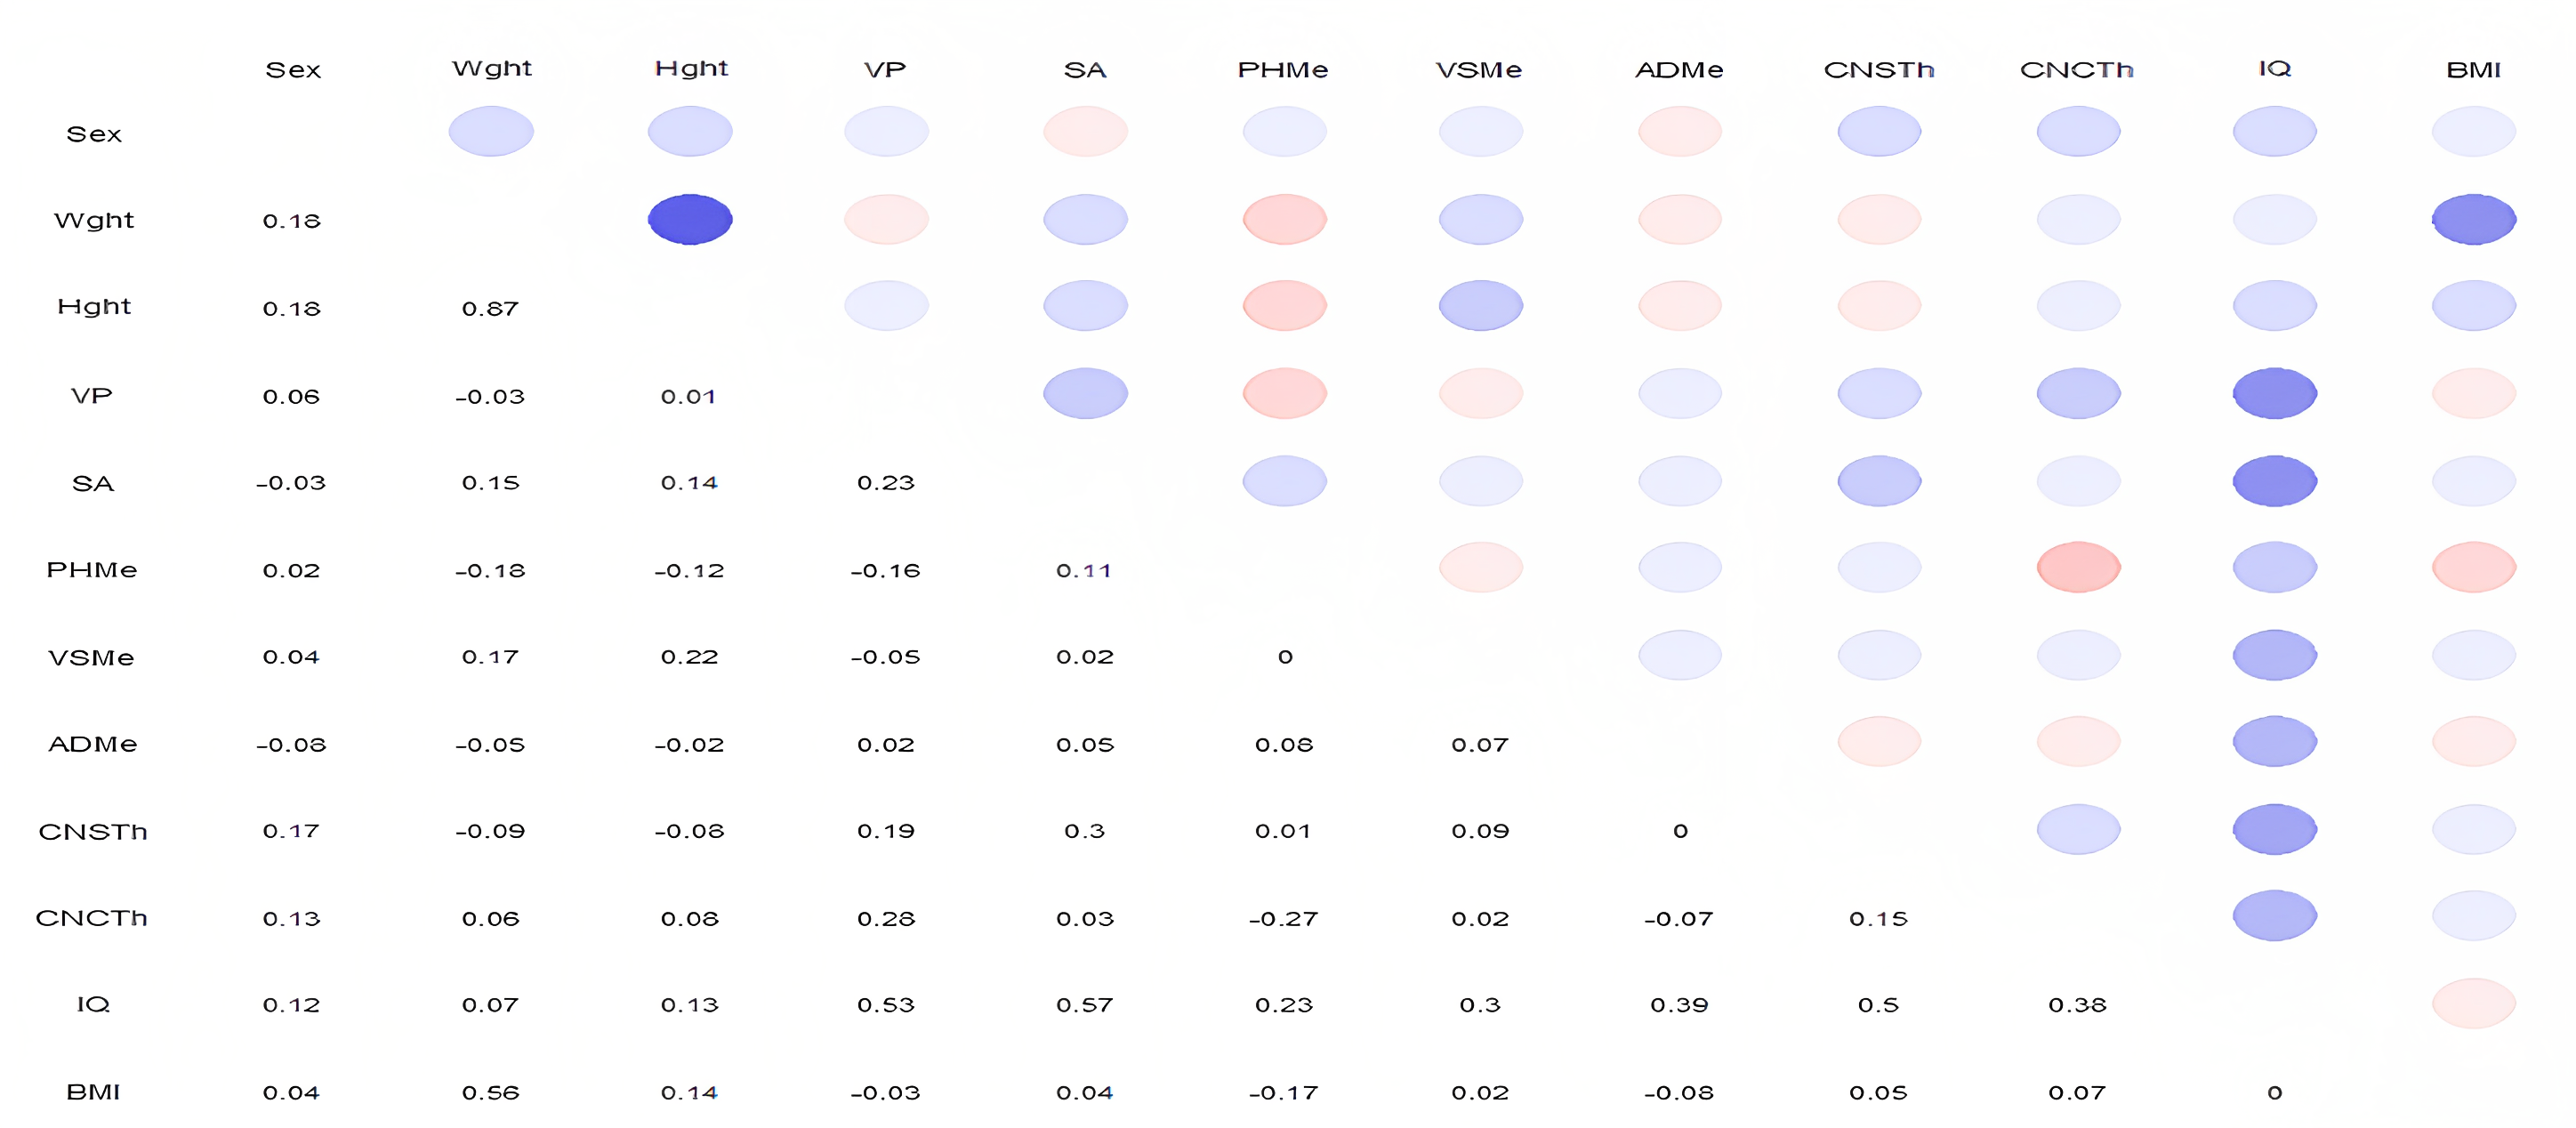
We conducted Spearman’s correlation analysis to determine the relation among the variables
(Figure 1). Weight and height correlated best (r=0.87), followed by weight and BMI (r=0.56).
Among the cognitive functions, IQ and selective attention (r=0.57), and IQ and visual
processing memory (r=0.53) correlated best. But the correlations between anthropometric and
cognitive data were generally very weak or did not exist at all.
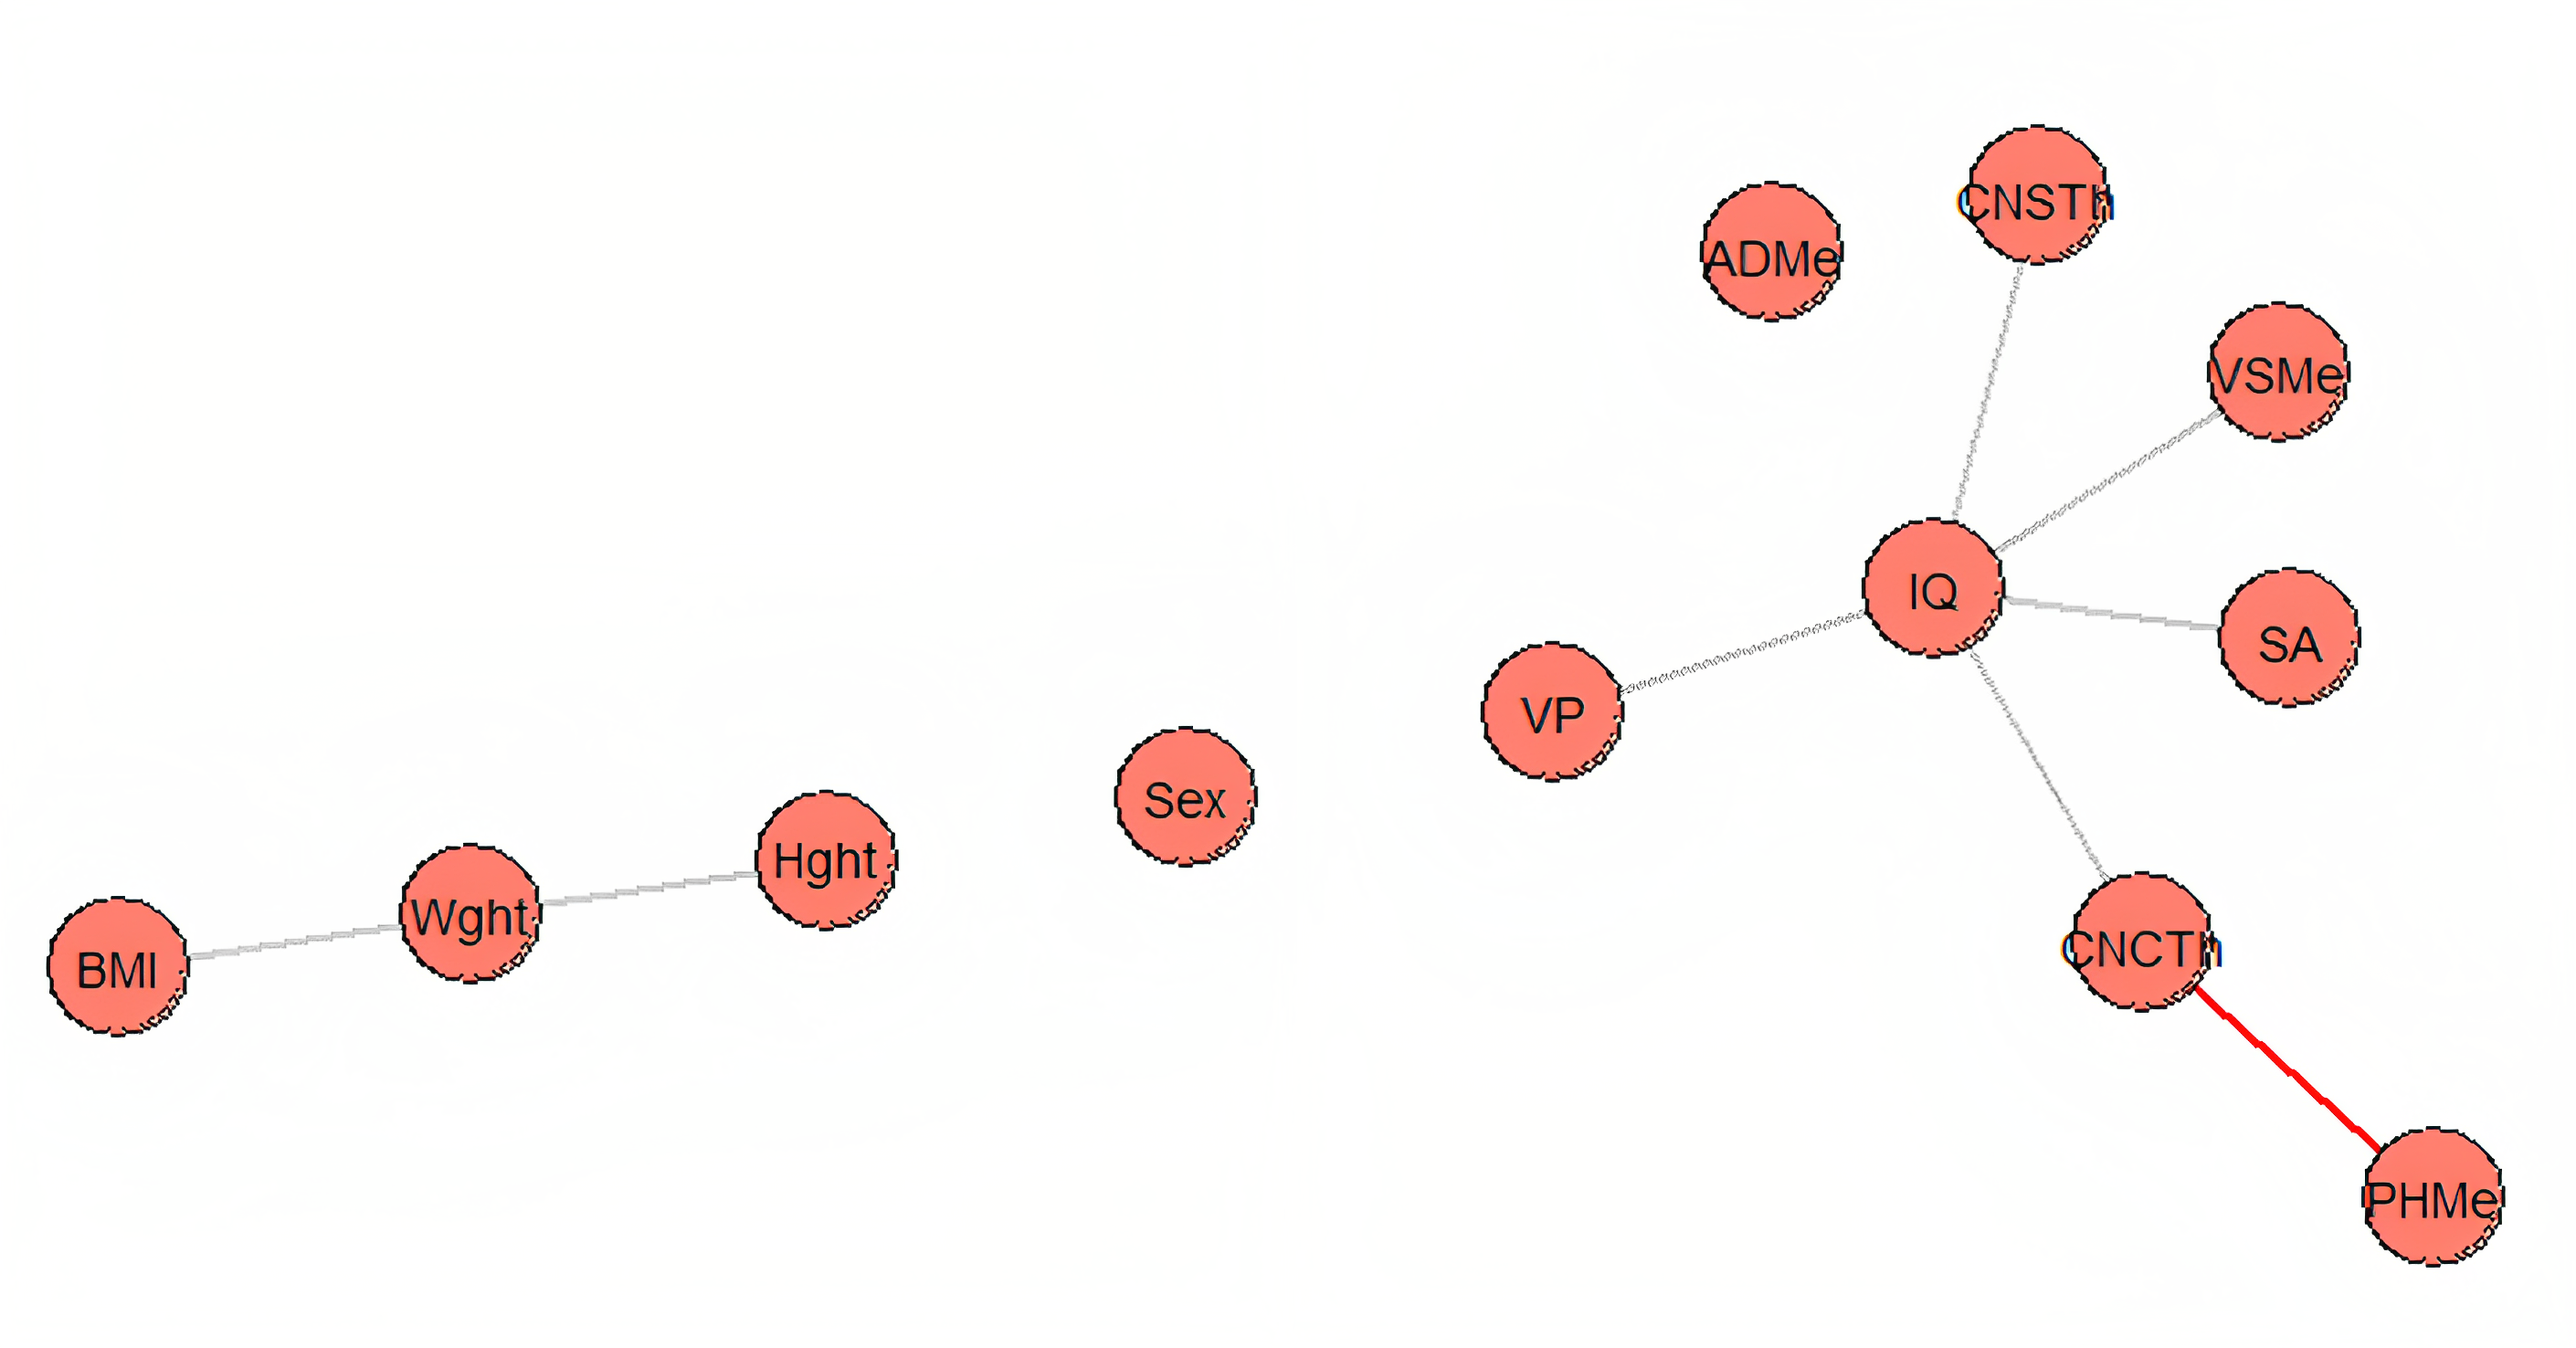
To further elucidate the relationships between the variables, we visualized the results
using SNHA (Figure 2). The analysis revealed that anthropometric data and cognitive function
formed distinct clusters. BMI, weight, and body height were positively correlated and formed
one cluster that was independent of IQ. Cognitive functions, with the exception of auditory
and phonological memory, were also positively correlated among each other and formed a
second cluster with IQ situated at its centre. Notably, we found no correlation between
anthropometric data and cognitive function or between anthropometric data and IQ. Sex did
not correlate with either cluster.
Figure 1 Spearman’s correlation matrix for pairwise correlations between anthropometric and
cognitive measurements. Blue circles indicate positive correlations; red circles
indicate negative correlations. BMI=Body Mass Index; Wght=weight; Hght=height; VP=visual
processing; SA=selective attention; PHMe=phonological memory; VSMe=visual memory;
ADMe=auditory memory; CNSTh=constructive thinking; CNCTh=conceptual thinking;
IQ=intelligence quotient.
Figure 2 St. Nicolas House Analysis (SNHA) for anthropometric and cognitive measurements.
alpha=0.05, threshold=0.001. Red lines indicate negative associations; gray lines
indicate positive associations. BMI=Body Mass Index; Wght=weight; Hght=height; VP=visual
processing; SA=selective attention; PHMe=phonological memory; VSMe=visual memory;
ADMe=auditory memory; CNSTh=constructive thinking; CNCTh=conceptual thinking;
IQ=intelligence quotient.
A multiple regression analysis was conducted to study whether anthropometrics can predict
cognitive function and to evaluate the predictive accuracy of sex, BMI and height on visual
processing, selective attention, phonological memory, visual memory, auditory memory,
constructive thinking, conceptual thinking and intelligence quotient. Multiple regression
analysis revealed that sex, BMI, and height were not statistically significant predictors of
the model (p>0.05) (Table 1).
Table 1 The associations between anthropometric and cognitive measurements of 59 children
(standard deviations from the mean) assessed by regression model.
Independent variables
Dependent variables
Visual processing
Selective Attention
Phenomenological Memory
Visual memory
Auditory Memory
Constructive thinking
Conceptual Thinking
IQ
Constant
11.40 (8.31)
2.32 (8.05)
17.90* (7.6)
-5.84 (6.81)
12.68 (8.79)
13.94* (6.57)
5.54 (7.77)
84.66 (27.67)
Sex
0.40 (0.80)
-0.34 (0.78)
0.13 (0.74)
0.34 (0.66)
-0.42 (0.85)
0.86 (0.64)
0.60 (0.75)
1.50 (2.68)
BMI
-0.06 (0.32)
0.15 (0.31)
-0.17 (0.30)
0.13 (0.27)
-0.03 (0.34)
0.20 (0.26)
0.02 (0.30)
0.26 (1.07)
Height
-0.01 (0.08)
0.05 (0.07)
-0.05 (0.07)
0.13 (0.07)
-0.01 (0.86)
-0.07 (0.06)
0.02 (0.08)
0.10 (0.27)
R-squared Adjusted
R2 F-statistic DF p
0.01 -0.05 0.10 55 0.97
0.02 -0.03 0.35 55 0.79
0.02 -0.03 1.9 55 0.14
0.09 0.44 1.9 55 0.14
0.01 -0.05 0.11 55 0.95
0.05 -0.00 0.98 55 0.41
0.02 -0.04 0.31 55 0.82
0.01 -0.04 0.26 55 0.86
Standard errors in parentheses
* Indicates significance at the 95% level
Discussion
Substantial research suggested a relationship between anthropometric measurements and
intelligence. Yet, most studies were performed in older children and adults. We studied
preschool children and used the IDS-P assessment battery to assess the relationships between
sex, BMI, height, visual processing, selective attention, phonological memory, visual
memory, auditory memory, constructive thinking, conceptual thinking and intelligence
quotient (IQ). We hypothesized that height, BMI and sex are positive predictors of these
cognitive abilities.
Our study revealed strong associations between height and weight as well as weight and BMI.
Additionally, we observed moderate associations between individual cognitive parameters of
the IDS-P tests and total IQ scores. However, we did not identify any significant
correlations between anthropometric measurements and any of the IDS-P subtest scores,
including total IQ score. Thus, we rejected our initial hypothesis. Our findings contradict
previous reports that suggested positive associations between BMI and IQ scores (Tabriz et al., 2015), and positive correlations between
height and IQ during early childhood (Silventoinen et al.,
2006), and an association between short stature and low mean intellectual
performance (Tuvemo et al., 1999).
It is important to note that most of the studies that report an association between
anthropometric measures and cognitive function also highlight the confounding influence of
SES. Our study lacks a thorough examination of socioeconomic factors, but our conclusions
are consistent with Patil et al. who failed to detect any significant correlation between
anthropometric measures and IQ (Patil et al., 2020).
Nonetheless, it is crucial to acknowledge that SES could have influenced the outcomes of our
investigation. Previous studies emphasized the critical role of SES in the understanding of
the intricate associations between sex, anthropometric measures and IQ.
The negative correlation between BMI and IQ does not only indicate that obesity may
increase the risk of cognitive decline in adults (Corley
et al., 2010), but also underscores the socioeconomic dimension of this
relationship (Pollitt and Mueller, 1982; Tabriz et al., 2015). Kahn and Williamson further
demonstrated that families with low education or income levels are more likely to experience
obesity and have limited access to mentally stimulating activities that support cognitive
development (Kahn and Williamson, 1990). Murray
et al. utilized a multiple mediator model to examine the intricate connection between SES,
beliefs and behaviour which further elucidates the link between anthropometry and cognitive
abilities (Murray et al., 2012).
Students attending better SES schools are more likely to get better test scores on the
Programme for International Student Assessment (PISA) (Flores-Mendoza et al., 2021). This confirms observations that children raised
under medium to high SES have better chances to be exposed to quality education (Azurmendi et al., 2005). The importance of SESs was
highlighted by (Bogin et al., 2017) who suggested
that greater income equality is more likely to predict greater average height for both sexes
and that gradients in height reflect gradients in social disadvantage. Vietnamese children
born in Germany are taller than their immigrant parents (Scheffler et al., 2021) may serve as an example of the importance of
social-economic-political-emotional (SEPE) factors (Bogin,
2021).
The question remains as to how BMI, height, and sex influence the IQ. Assessments and
interpretations of the relationship between anthropometric parameters and IQ should include
SEPE factors to shed more light on the complex interaction between anthropometry and
cognition.
A limitation of this study was the fact that it was conducted on a relatively small sample
of preschool children from four kindergartens in Prague and that it did not include
information on family SES. Therefore, the results may not be generalized to other
populations or age groups. Due to the cross-sectional design of the study the causal
relationships between the variables could not be established. Further research with larger
and more diverse samples as well as longitudinal designs is needed to confirm and extend our
findings.
Conclusion
Contrary to earlier research, this study failed to provide evidence for any association
between sex, BMI and height in preschool children on one side, and IQ and IQ subtests on the
other side. The relationship between sex, BMI, height, and IQ is complex; its assessments
must include social, economic, political, and emotional factors.
Acknowledgements
I would like to thank my supervisor Assoc. Prof. Martin Musalek, PhD, for the provided
data. Furthermore, thanks to PD Dr. Christiane Scheffler, Prof. Dr. Michael Hermanussen, Dr.
Detlef Groth, and the University of Potsdam for hosting the summer school and the knowledge
and help rendered in understanding statistics R.
This study was supported by the Grant Agency of Charles University GAUK (No. 36401) and the
Charles University Project Cooperation Social Science.
References
Azurmendi, A. /Braza, F./ Sorozabal, A./ García,
A./ Braza, P. /Carreras, M.R./ Muñoz, J.M./Cardas, J./ Sánchez-Martín, J.R. (2005).
Cognitive abilities, androgen levels, and body mass index in 5-year-old children.
Hormones and Behavior 48, 187–195. https://doi.org/10.1016/j.yhbeh.2005.03.003.
Beauchamp, J.P./Cesarini, D./Johannesson,
M./Lindqvist, E./Apicella, C. (2011). On the sources of the height–intelligence
correlation: New insights from a bivariate ACE model with assortative mating. Behavior
Genetics 41, 242–252. https://doi.org/10.1007/s10519-010-9376-7.
Benyamin, B./Wilson, V./Whalley, L.J./Visscher,
P.M./Deary, I.J. (2005). Large, consistent estimates of the heritability of cognitive
ability in two entire populations of 11-year-old twins from scottish mental surveys of
1932 and 1947. Behavior Genetics 35, 525–534. https://doi.org/10.1007/s10519-005-3556-x.
Bogin, B. (2021).
Social-Economic-Political-Emotional (SEPE) factors regulate human growth. Human Biology
and Public Health 1. https://doi.org/10.52905/hbph.v1.10.
Bogin, B./Scheffler, C./Hermanussen, M. (2017).
Global effects of income and income inequality on adult height and sexual dimorphism in
height: Bogin et al. American Journal of Human Biology. 29, e22980.
https://doi.org/10.1002/ajhb.22980.
Case, A./Paxson, C. (2008). Height, health, and
cognitive function at older ages. American Economic Review 98, 463–467. https://doi.org/10.1257/aer.98.2.463.
Corley, J./Gow, A.J./Starr, J.M./Deary, I.J.
(2010). Is body mass index in old age related to cognitive abilities? The Lothian Birth
Cohort 1936 Study. Psychology and Aging 25, 867–875. https://doi.org/10.1037/a0020301.
Cournot, M./Marquié, J.C./Ansiau, D./Martinaud,
C./Fonds, H./Ferrières, J./Ruidavets, J.B. (2006). Relation between body mass index and
cognitive function in healthy middle-aged men and women. Neurology 67, 1208–1214.
https://doi.org/10.1212/01.wnl.0000238082.13860.50.
Dahl, A.K./Hassing, L.B./Fransson, E.I./Gatz,
M./Reynolds, C.A./Pedersen, N.L. (2013). Body mass index across midlife and cognitive
change in late life. International Journal of Obesity (London) 37, 296–302. https://doi.org/10.1038/ijo.2012.37.
Eston, R./Hawes, M. M./Reilly, T. (2009). Human
body composition (from Eston and Reilly, 3rd ed. 2009). pp. 3–53.
Flores-Mendoza, C./Ardila, R./Gallegos,
M./Reategui-Colareta, N. (2021). General intelligence and socioeconomic status as strong
predictors of student performance in latin american schools: Evidence from PISA Items.
Frontiers in Education 6. https://doi.org/10.3389/feduc.2021.632289
Grieder, S./Grob, A. (2020). Exploratory factor
analyses of the intelligence and development scales–2: implications for theory and
practice. Assessment 27, 1853–1869. https://doi.org/10.1177/1073191119845051.
Grob, A./Meyer, C./Hagmann-von Arx, P. (2009).
Intelligence and Development Scales (IDS).
Hagmann-von Arx, P./Grob, A./Petermann,
F./Daseking, M. (2012). [Concurrent validity of the HAWIK-IV and the Intelligence and
Development Scales (IDS)]. Zeitschrift für Kinder- und Jugendpsychiatrie und
Psychotherapie 40, 41–50. https://doi.org/10.1024/1422-4917/a000148.
Hagmann-von Arx, P./Lemola, S./Grob, A.. (2018).
Does IQ = IQ? Comparability of intelligence test scores in typically developing
children. Assessment 25, 691–701. https://doi.org/10.1177/1073191116662911.
Hagmann-von Arx, P./Meyer, C.S./Grob, A. (2008).
Intelligenz- und entwicklungsdiagnostik im Deutschen sprachraum. [Intelligence and
developmental scales in German-speaking countries.]. Kindheit und Entwicklung:
Zeitschrift für Klinische Kinderpsychologie 17, 232–242. https://doi.org/10.1026/0942-5403.17.4.232.
Hagmann-von Arx, P./Petermann, F./Grob, A. (2013).
Konvergente und diskriminante Validität der WISC-IV und der Intelligence and Development
Scales (IDS) bei Kindern mit Migrationshintergrund. Diagnostica 59, 170–182. https://doi.org/10.1026/0012-1924/a000091.
Halkjær, J./Holst, C./Sørensen, T. (2003).
Intelligence test score and educational level in relation to bmi changes and obesity.
Obesity Research 11, 1238–45. https://doi.org/10.1038/oby.2003.170.
Hermanussen, M./Aßmann, C./Groth, D. (2021). Chain
reversion for detecting associations in interacting variables—St. Nicolas House
Analysis. International Journal of Environmental Research and Public Health 18, 1741.
https://doi.org/10.3390/ijerph18041741.
Kahn, H.S./Williamson, D.F. (1990). The
contributions of income, education and changing marital status to weight change among US
men. International Journal of Obesity 14, 1057–1068.
Kanazawa, S./Reyniers, D.J. (2009). The role of
height in the sex difference in intelligence. The American Journal of Psychology 122,
527–536. https://doi.org/10.2307/27784427.
Lahmann, P.H./Lissner, L./Gullberg, B./Berglund,
G. (2000). Sociodemographic factors associated with long-term weight gain, current body
fatness and central adiposity in Swedish women. International Journal of Obesity 24,
685–694. https://doi.org/10.1038/sj.ijo.0801219.
Marioni, R.E./Batty, G.D./Hayward, C./Kerr,
S.M./Campbell, A./Hocking, L.J./Porteous, D.J./Visscher, P.M./Deary, I.J. (2014). Common
genetic variants explain the majority of the correlation between height and
intelligence: The generation scotland study. Behavior Genetics 44, 91–96. https://doi.org/10.1007/s10519-014-9644-z.
Murray, T.C./Rodgers, W.M./Fraser, S.N. (2012).
Exploring the relationship between socioeconomic status, control beliefs and exercise
behavior: a multiple mediator model. Journal of Behavioral Medicine 35, 63–73. https://doi.org/10.1007/s10865-011-9327-7.
Nguyen, J.C.D./Killcross, A.S./Jenkins, T.A.
(2014). Obesity and cognitive decline: role of inflammation and vascular changes.
Frontiers in Neuroscience 8, 375. https://doi.org/10.3389/fnins.2014.00375.
Patil, S./Joglekar, C./Sonavane, S./Chavan,
R./Bhat, P./Mohite, R./Deorukhakar, P./Jadhav, D./Dervankar, O. (2020). Relationship
between anthropometric parameters and intelligence in preschool children from rural
konkan. International Journal of Clinical and Biomedical Research 30–34. https://doi.org/10.31878/ijcbr.2020.62.08.
Pollitt, E.,/Mueller, W. (1982). The relation of
growth to cognition in a well-nourished preschool population. Child Development 53,
1157–1163.
R Core Team. (2021). R: The R Project for
Statistical Computing [WWW Document]. URL https://www.r-project.org/
(accessed 23-04-22).
Sandrini, L./Di Minno, A./Amadio, P./Ieraci,
A./Tremoli, E./Barbieri, S.S. (2018). Association between obesity and circulating
brain-derived neurotrophic factor (BDNF) levels: Systematic review of literature and
meta-analysis. International Journal of Molecular Sciences 19, 2281. https://doi.org/10.3390/ijms19082281.
Scheffler, C./Nguyen, T./Hermanussen, M. (2021).
Vietnamese migrants are as tall as they want to be. Human Biology and Public Health 2.
https://doi.org/10.52905/hbph.v2.12.
Silventoinen, K./Posthuma, D./van Beijsterveldt,
T./Bartels, M./Boomsma, D.I./ (2006). Genetic contributions to the association between
height and intelligence: Evidence from Dutch twin data from childhood to middle age.
Genes Brain and Behavior 5, 585–595. https://doi.org/10.1111/j.1601-183X.2006.00208.x.
Tabriz, A.A./Sohrabi, M.-R./Parsay, S./Abadi,
A./Kiapour, N./Aliyari, M./Ahmadi, F./Roodaki, A. (2015). Relation of intelligence
quotient and body mass index in preschool children: a community-based cross-sectional
study. Nutrition and Diabetes 5, e176–e176. https://doi.org/10.1038/nutd.2015.27.
Tuvemo, T./Jonsson, B./Persson, I. (1999).
Intellectual and physical performance and morbidity in relation to height in a cohort of
18-year-old Swedish conscripts. Hormone Reseach 52, 186–191. https://doi.org/10.1159/000023459.
Vignerova, J./Riedlová, J./Bláha, P./Kobzová,
L./krejčovský, L./Brabec, M./Hrušková, M. (2006). 6. celostátní antropologický výzkum
dětí a mládeže 2001, Česká Republika.
Wheeler, P.G./Bresnahan, K./Shephard, B.A./Lau,
J./Balk, E.M. (2004). Short stature and functional impairment: a systematic review.
Archives of Pediatrics and Adolescent Medicine 158, 236–243. https://doi.org/10.1001/archpedi.158.3.236.
Yu, Z.B./Han, S.P./Cao, X.G./Guo, X.R. (2010).
Intelligence in relation to obesity: a systematic review and meta-analysis. Obesity
Reviews 11, 656–670. https://doi.org/10.1111/j.1467-789X.2009.00656.x.
 ✉
✉