Two novel models evaluating the determinants of
resting metabolic rate in Indian children
Sandra Aravind Areekal ✉
✉
Department of Biology, Indian Institute of Science
Education and Research Pune, Maharashtra, India
Anuradha Khadilkar
Pediatric Growth and Endocrine Department, Hirabai
Cowasji Jehangir Medical Research Institute, Pune,
Maharashtra, India
School of Health Sciences, Savitribai Phule Pune
University, Pune, Maharashtra, India
Pediatric Growth and Endocrine Department, Hirabai
Cowasji Jehangir Medical Research Institute, Pune,
Maharashtra, India
Bharati Hospital, Pune, Maharashtra, India
Pranay Goel
Department of Biology, Indian Institute of Science
Education and Research Pune, Maharashtra, India
DOI: https://doi.org/10.52905/hbph2022.3.55
Abstract
BackgroundResting metabolic rate () quantifies the
minimal energy required to sustain vital body
functions and is a crucial component of childhood
development. Mean per unit body mass
() has very accurately
been modelled in references for Caucasian
adolescents.
ObjectivesHere we address the extent to which such a model can be
adapted to explain in Indian
children.
Subjects and MethodsThe multicenter study (MCS) is a cross-sectional dataset
on 495 children (235 girls and 260 boys) aged 9 to
19 years with anthropometric, body composition, and
measurements. The
RMR-ultrasonography study (RMR-USG) consists of
anthropometric data, , and liver and kidney
volume measured through ultrasonography in nine
girls and nine boys aged 6 to 8 years.
ResultsThe mean in Indian children is
significantly lower compared to their Caucasian
counterparts, except in boys in the age group 9–13
years. We present two novel phenomenological models
that describe the mean stratified by age in
Indian children and adolescents. The first is a
modified Wang model in which the relative masses of
four major organs are assumed to be uniformly
lowered for Indian children. Theoretical predictions
of liver size are not uniformly borne out in a pilot
validation study; however, the relative mass of the
kidney is found to be significantly lower. The
second model demonstrates that changes in body
composition alone can also explain the Indian data.
ConclusionA modified Wang model in which the relative masses of
four major organs are assumed to be uniformly lower
in Indian children and differences in body
composition can be used to estimate mean
by age in Indian
children; however, understanding the mechanistic
basis of variation in remains an open
problem.
Keywords: resting metabolic rate, Indian children, organ mass, body
composition
Conflicts of interest: There are no conflicts
of interest.
Citation: Aravind Areekal, S. et al. (2022). Two novel models evaluating the determinants of
resting metabolic rate in Indian children. Human Biology and Public Health 3. https://doi.org/10.52905/hbph2022.3.55.
Copyright: This is an open access article distributed under the terms of the Creative Commons Attribution License which permits unrestricted use, distribution, and reproduction in any medium, provided the original author and source are credited.
Received: 22-05-2022 | Accepted: 12-12-2022 | Published: 20-03-2023
Take-home message for students
The resting metabolic rate per unit body mass
() in Indian children is
significantly lower than that of their Caucasian
counterparts, except in boys in the age groups 9–13 years. A
preliminary investigation could not resolve whether lowered
organ tissue masses or body compositional differences
explain this lower .
Contents
Introduction
Malnutrition in developing countries, such as India, is often
paradoxically characterized as the simultaneous prevalence of
undernutrition and rising overweight and obesity in children and
adolescents (NCD Risk Factor
Collaboration, 2017; WHO, 2020). One approach to studying
malnourishment is through assessing the energy intake and
expenditure of a population. For instance, a 200 kcal per day
difference in energy intake was sufficient to explain the excess
weight of US children in 2003–2006 compared to 1976–1980 (Hall et al., 2013).
Energy expenditure in particular is predominantly determined by the
physiology of the individual and varies significantly, both within
and across populations (Henry,
2005; Johnstone
et al., 2005; Reneau et al., 2019). It is necessary to understand
factors leading to variation in energy expenditure to create
personalized interventions to tackle the double burden of
malnutrition (WHO, 2020).
We note that the World Health Organization’s (WHO) recommendations
for energy requirements (FAO/WHO/UNU, 2004) are based on studies that
overestimate energy expenditure in the Indian population by 12%
(Henry, 2005). Here
we are interested in developing models that accurately describe the
(resting) energy expenditure in Indian children.
A primary component of energy expenditure is the resting energy
expenditure (), or the resting metabolic rate
(), which measures the energy
required to maintain the vital body functions at rest.
is measured through direct or
indirect calorimetry (Weir,
1949) under standard conditions, such as in the
post-absorptive state, in wakefulness, in the absence of any
physical activity and diseases, with minimal emotional disturbance,
and in a thermoneutral environment (22–26°C). Phenomenological
models developed on a sample population are frequently used to
estimate . A large number of regression
models for have been based on
anthropometric and body composition factors for nearly a century
(Aub and Du Bois,
1917; Bedale,
1923; Cunningham,
1980; FAO/WHO/UNU,
1985; Harris and
Benedict, 1918; Henry, 2005; Katch
et al., 1990; Kleiber, 1932; McMurray et al., 2014; Mifflin et al., 1990; Owen et al., 1987, 1986;
Schofield, 1985).
These models find that fat-free mass () is the single largest
predictor of , followed by fat mass
(), age, and sex. However,
is found to be highly variable
between individuals in a population (Henry, 2005; Johnstone et al., 2005). Overall, models
based on body composition have been of limited success, as they are
able to explain only about 60–80% variation in
.
An alternate strategy for modelling is to challenge the assumption that
the body mass is metabolically homogeneous, as is inherent in
predicting from linear models of
or body mass.
or body mass is composed of
organs and tissues of varying metabolic activity, which together
contribute to whole-body . Gallagher et al. (Gallagher et al., 1998)
partition as the sum of metabolic rates
of a number of major organs and tissues constituting the body mass.
The metabolic rates of individual organs were calculated as the
product of measured organ mass and the metabolic rate per unit mass
(specific metabolic rate) of each organ, which was estimated in vivo
by Elia (Elia, 1992). The
Gallagher model was able to explain 80–98% variation of
in several studies in adults
(Bosy-Westphal et al.,
2008, 2004; Müller
et al., 2011; Wang, 2012; Wang
et al., 2010, 2005, 2001). However, the Gallagher
model was found to underpredict in children (Hsu et al., 2003; Wang, 2012; Wang et al., 2010). Wang
(Wang, 2012)
modified the Gallagher model to study how varies in children from birth
to adulthood and described the mean () in a reference Caucasian
dataset (Talbot, 1938).
Here we ask if the Wang model can describe in an Indian population.
Studies on metabolic rates in Indian children are scarce (Cherian et al., 2018;
Kajale et al.,
2022; Patil and
Bharadwaj, 2013; Swaminathan et al., 2013). Predictive equations
developed for Caucasian populations (FAO/WHO/UNU, 1985; Harris and Benedict, 1918) have been
reported to overpredict metabolic rates in Indian adults (Cherian et al., 2018;
Henry, 2005; Soares et al., 1998),
however, they continue to be used to predict
in Indian children (Esht et al., 2018; Indian Council of Medical
Research (ICMR), 2010; Srivastava et al., 2017). Previous
studies in Indian adults (Krishnan and Vareed, 1932; Kumar et al., 1961; Mason et al., 1963;
Mason and Benedict,
1931; Mukherjee
and Gupta, 1931; Niyogi et al., 1939; Rahman, 1936; Rajagopal, 1938) have shown that the
measured per unit body surface area in
Indian population is 5–18% lower than the Harris-Benedict standards
(Harris and Benedict,
1918). However, Soares et al. (Soares et al., 1998) reported no
significant difference in adjusted for in males and in
adjusted for and in females, in
Indian and Australian populations between the ages of 18 and 30
years. Moreover, Soares et al. (Soares et al., 1998) observed a
higher
in the Indian population than
in the Australian population; the reason was speculated to be due to
a higher proportion of organ mass within compared to muscle mass,
but this has not been verified. There is a clear absence of
literature on RMR in the current Indian population. We study the
influential model of by Wang (Wang, 2012) in Caucasian children
closely to understand the determinants of in Indian children.
In our study, a naive application of the Wang model clearly overestimates
the mean observed in Indian children. We
assess two major modifications of the model aimed at revealing the
mechanistic basis of the lower . We first calibrate the
relative masses of the four major organs to the observed RMR/BM,
followed by a pilot study to validate organ mass predictions. Organ
sizes were not found to be uniformly small, as predicted by model
fits. Next, we vary the residual mass, to show that this can
equivalently explain whole-body . In other words, our paper
re-evaluates the role of the relative mass of four major organs and
the metabolic contribution of residual mass in determining
in an Indian population. We
conclude that either model provides useful phenomenological
descriptions of varying with age in Indian
children. However, identifying the physiological determinants of
variation in continues to be an elusive
problem.
Methods
Datasets
The following datasets were used in the study:
Multicentre study (MCS) dataset
MCS is a dataset on 495 healthy school going children (235 girls)
aged 9 to 19 years from multiple centres in India, which is
a subset of data collected as a part of a previous study
(Khadilkar
et al., 2019). Anthropometric, body
composition, and metabolic variables such as the height,
weight, fat mass (), fat-free mass
(), and
of the subjects were
measured. A portable indirect calorimeter Fitmate GS (by
COSMED srl, Italy) was used to measure
. Fitmate GS has
previously been validated in healthy adults by Nieman et al.
(Nieman et al.,
2006) and Vandarakis et al. (Vandarakis et al.,
2013). The machine was routinely calibrated
according to manufacturer recommendations, and automatic
oxygen sensor calibration was carried out before each
measurement. Throughout the measurement, the child remained
seated and was asked to relax while it was ensured that the
child remained awake. The test was considered complete after
achieving steady state. Body composition was assessed using
Bioelectrical Impedance Analyzer (BIA; Tanita Model
BC-420MA), and the child was asked to void before the
measurement (Chiplonkar
et al., 2017; Kyle et al., 2004). The physical
characteristics of the subjects are given in Table 1.
Written consent was obtained from the parents of the children and
from subjects above 18 years, and assent was obtained from
children above 7 years. De-identified data were used for all
the analyses. Ethics permission for conducting this
multicenter study was granted by the Ethics Committee,
Jehangir Clinical Development Centre Pune (dated
21st June 2016). A waiver for secondary
data analysis was issued by the Ethics Committee for Human
Research at the Indian Institute of Science Education and
Research Pune (IECHR/Admin/2019/002).
RMR-USG dataset
In this study, we measured anthropometry,
, and organ mass (liver
and kidney) of nine healthy girls and boys in the age group
6 to 8 years, recruited from a school in Western India. The
age group 6 to 8 years was selected so that variation in
due to pubertal growth
spurt could be avoided. Written consent was obtained from
the children’s parents. De-identified data were used for all
the analyses. is measured using
indirect calorimetry (Fitmate GS, COSMED srl, Italy) under
the standard conditions (see above). The liver and kidney
volume in the subjects were measured using ultrasonography
(Voluson P8 BT 16, GE Healthcare). The liver volume was
examined in the supine position and kidney volume in lateral
decubitus position. The measurements were taken during deep
inspiration. The measured organ volume was converted to mass
as density volume. The density of
liver and kidney in the Indian population is assumed to be
1.16 (Chandramohan
et al., 2012) and 1.05 (kg/cm3)
respectively (ICRP,
2009; Menzel et al., 2009). A summary of the
RMR-USG dataset is given in Table 2. The MCS and RMR-USG
studies were carried out as per relevant guidelines and
regulations.
Table 1 Median and interquartile region (IQR; as
(Q1, Q3)) of the observed physical characteristics
of the subjects in the MCS dataset. The sample
size (n) is given for each variable. BMI: body
mass index. Boys and girls were compared using
Wilcoxon rank sum test and the p-values are also
given in the table.
| Variables |
Boys |
Girls |
p-value |
| n |
Median (Q1, Q3) |
n |
Median (Q1, Q3) |
| Age (years) |
260 |
13.3 (11.7, 14.8) |
235 |
13.0 (11.3, 14.5) |
0.1 |
| Weight (kg) |
260 |
42 (32, 51) |
235 |
40 (33, 49) |
0.5 |
| Height (cm) |
260 |
152 (142, 164) |
235 |
150 (143, 156) |
0.007 |
| BMI
(kg/m2) |
260 |
17.5 (15.4, 20.5) |
235 |
18.0 (15.8, 20.6) |
0.3 |
| RMR (kcal/day) |
260 |
1172 (1030, 1333) |
232 |
1043 (928, 1168) |
< 0.001 |
| RMR/BM (kcal/(kg
day)) |
260 |
29 (25, 33) |
232 |
26 (22, 31) |
< 0.001 |
| Fat mass (kg) |
257 |
5 (3, 12) |
234 |
10 (6, 14) |
< 0.001 |
| Fat-free mass
(kg) |
257 |
35 (28, 43) |
234 |
31 (27, 35) |
< 0.001 |
Table 2 Median and IQR of the physical
characteristics in the RMR-USG dataset. Q1:
1st quartile or 25th
percentile; Q3: 3rd quartile or
75th percentile.
| Variables |
Boys (n = 9) |
Girls (n = 9) |
| Median (Q1, Q3) |
Median (Q1, Q3) |
| Age (years) |
7.1 (6.3, 7.7) |
7.6 (7.0, 7.9) |
| Weight (kg) |
19 (17.7, 20.9) |
18.3 (17.6, 19.1) |
| Height (cm) |
120.0 (112.4, 126.8) |
122.5 (114.5, 124.2) |
| BMI
(kg/m2) |
13.8 (13.2, 15.1) |
12.9 (11.9, 13.4) |
| RMR (kcal/day) |
984 (904, 1113) |
873 (726, 936) |
| RMR/BM (kcal/(kg
day)) |
48.1 (43.2, 56.6) |
47.7 (47.1, 50.4) |
| Liver mass (kg) |
0.68 (0.56, 0.73) |
0.52 (0.42, 55) |
| Kidney mass (kg) |
0.091 (0.080, 0.094) |
0.080 (0.076, 0.093) |
Relative organ mass () data
A prominent dataset for reference physiological variables in
North American population compiled by Altman and Dittmer
(Altman and
Dittmer, 1962) was used for organ weights
from birth to maturity. To the best of our knowledge, this
was the only dataset that provided liver, brain, heart, and
kidney weights of children in age groups one year apart,
from birth to adulthood. The reference relative mass
() of liver, kidney,
heart, and brain is illustrated in Figure 1 and 2.
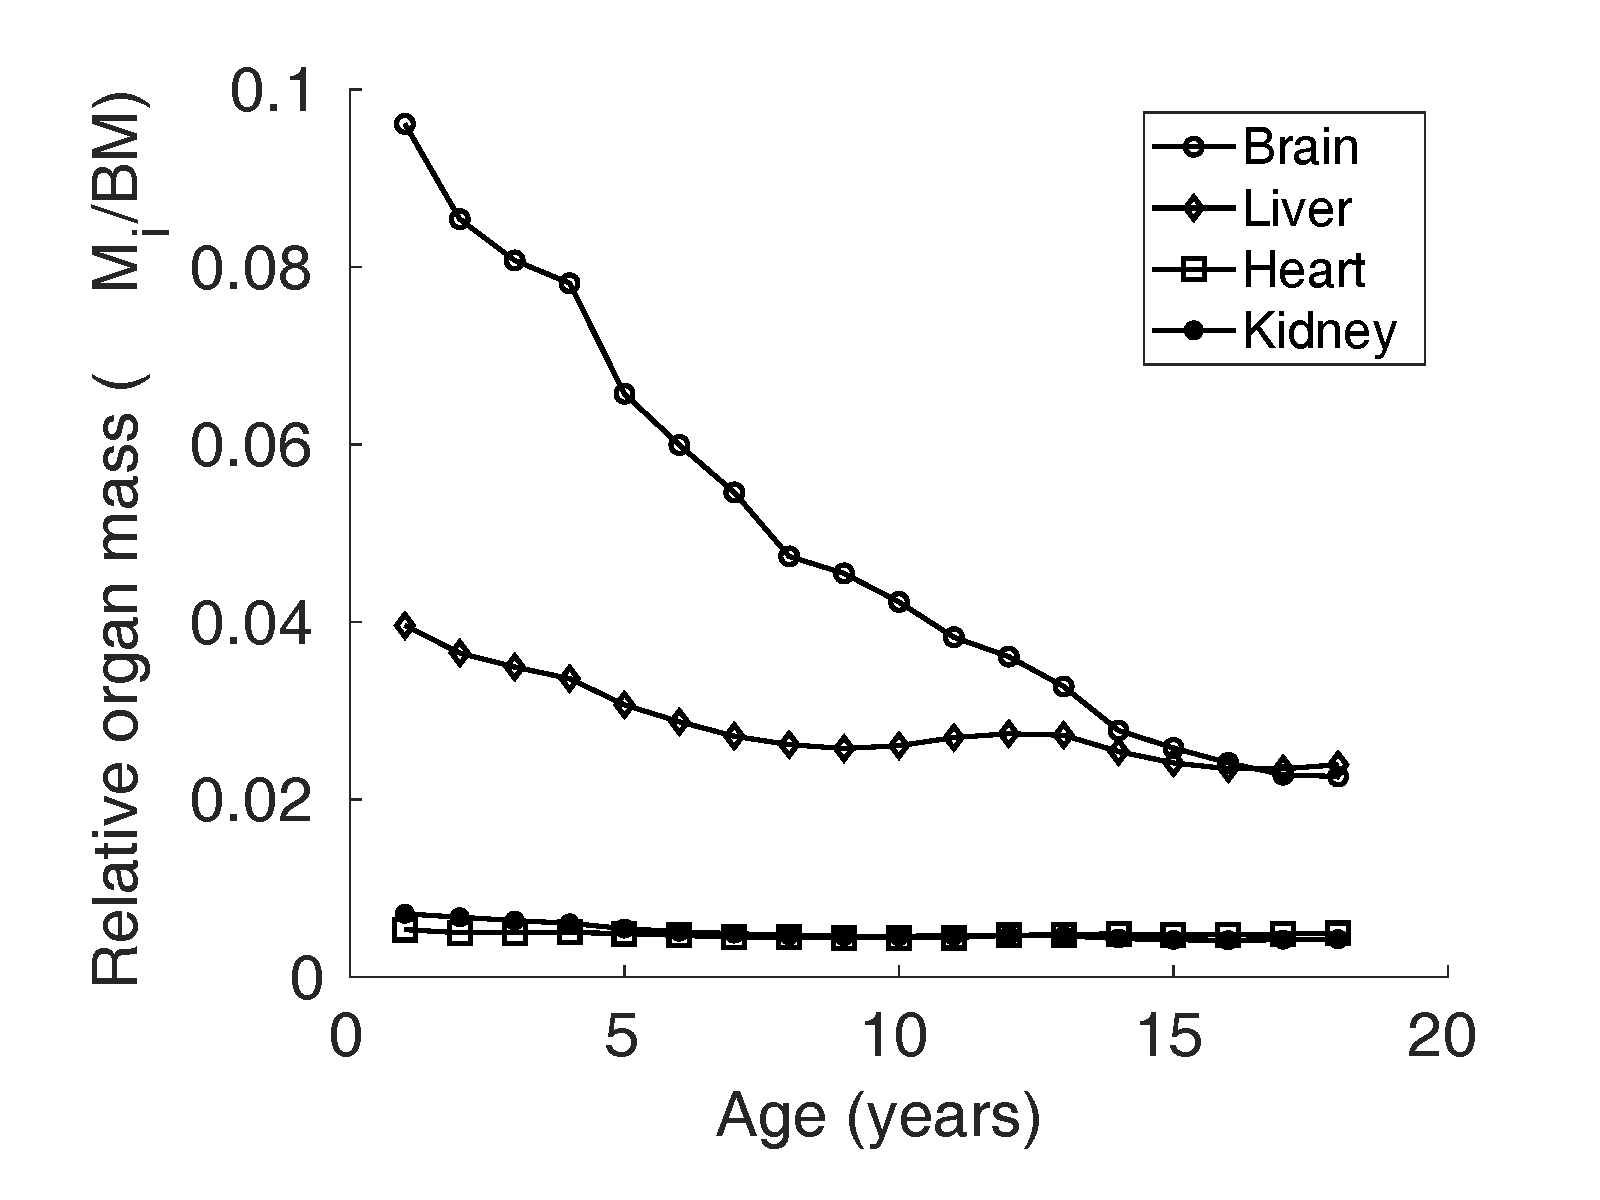
Figure 1 Relative organ mass
of brain, liver,
heart and kidney reported by Altman and Dittmer
(Altman and
Dittmer, 1962) in boys in the North
American population.
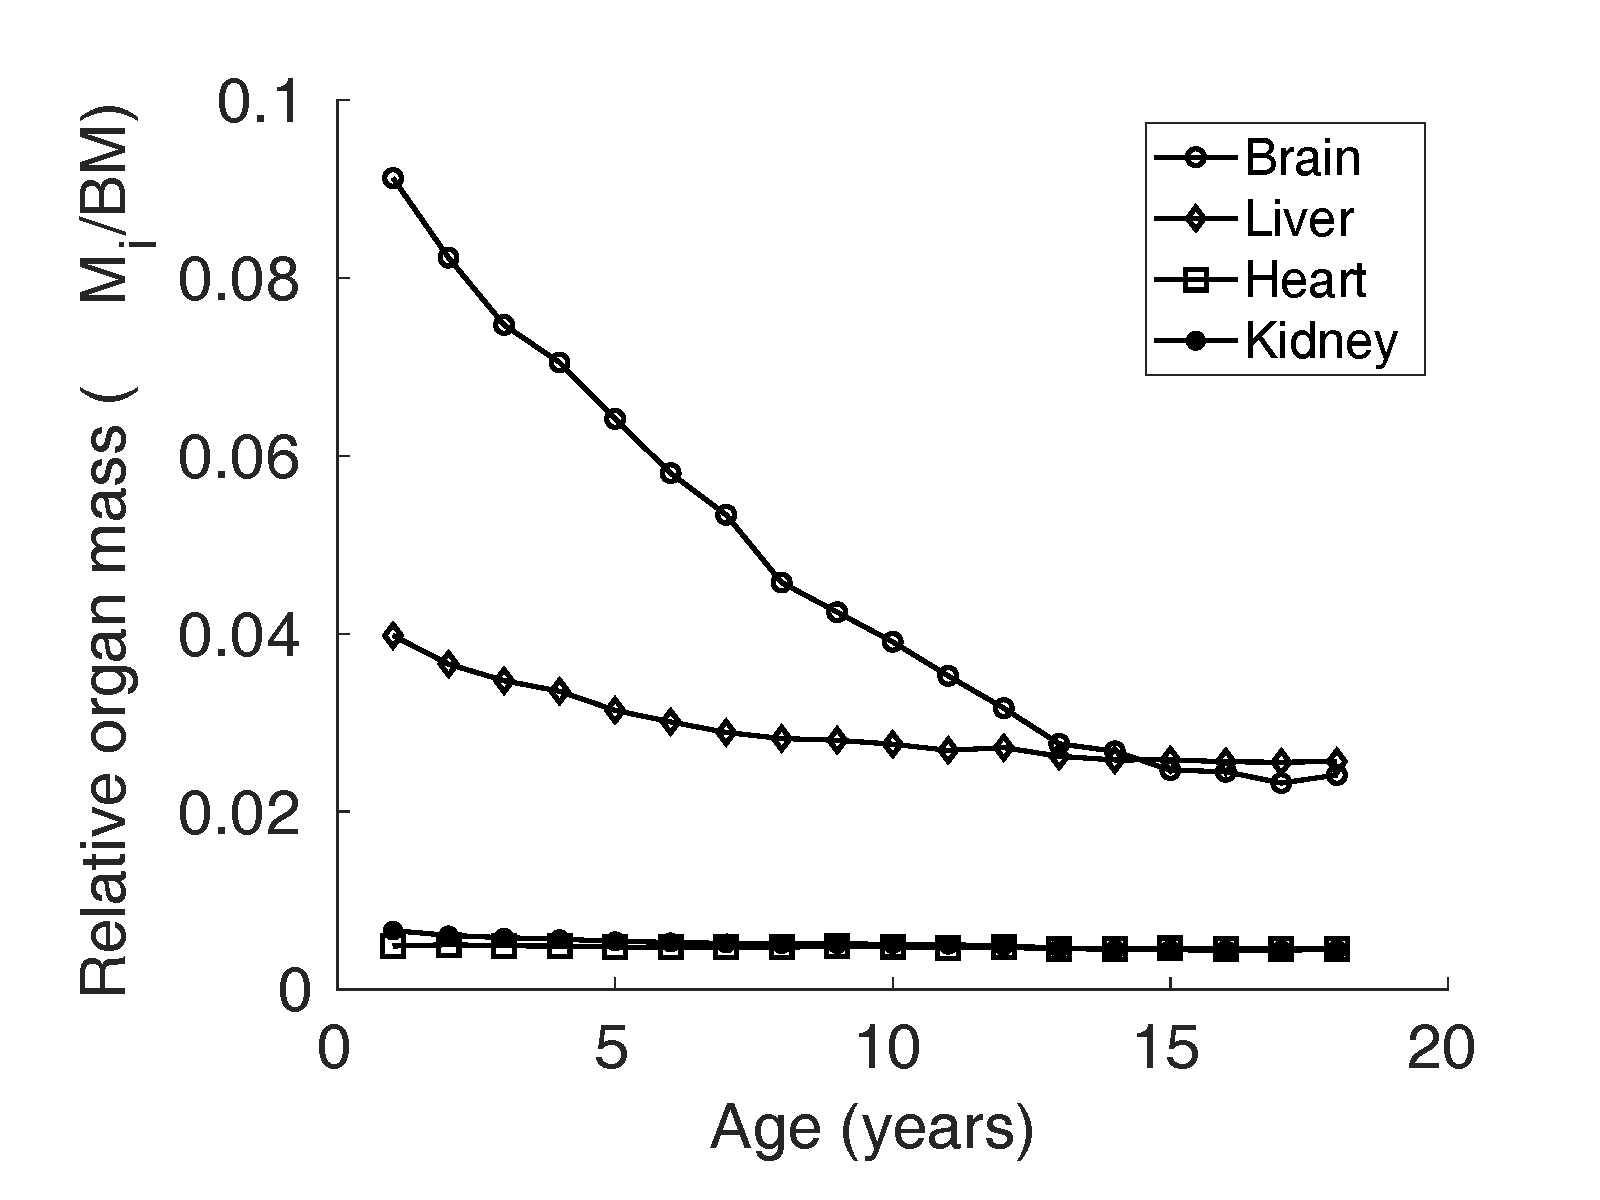
Figure 2 Relative organ mass
of brain, liver,
heart, and kidney reported by Altman and Dittmer
(Altman and
Dittmer, 1962) in girls in the North
American population.
Model
A mechanistic model for in children and
adolescents according to Wang (Wang, 2012) can be written
as
where is the relative
cellularity, is the specific
metabolic rate of an organ ( for brain, heart,
kidney, liver, and the residual mass) and
is the relative mass of
the organ ‘’ with respect to the
body mass (). Residual mass is
obtained by subtracting the sum of the mass of four organs
from the body mass. These physiological parameters in Eq. 1
are described in detail as follows:
Relative cellularity ()
The ratio of body cell mass () to fat-free mass
() is defined as the
whole-body cellularity, which quantifies the
metabolically active portion of
. Whole-body
cellularity is thought to change in the course of
life and is assumed to be smaller in children than
young adults (Wang et al., 2010,
2005). Hence, the factor “relative
cellularity” (), which is defined as
the ratio of in children to that
of adults, is incorporated in Eq. 1. Here,
is assumed to be
proportional to the total body potassium
() and the change in
in children is
estimated through . In the reference
Caucasian adults (Snyder et al., 1975),
(mmol/kg) is reported
to be 68.1 for men and 64.2 for women (Forbes, 1987).
Thus, in children, is approximated as
in boys and
in girls, in a given
age group. Data on from birth to
adulthood were compiled by Wang (Wang, 2012),
based on age-related changes in total body potassium
() relative to
, from studies by
Fomon et al. (Fomon et al., 1982).
Specific metabolic rate ()
Specific metabolic rate (kcal/(kg day)) of an organ
‘’ is the metabolic
rate per unit mass of that organ, denoted as
. The specific
metabolic rate () of organs in adults
was measured in vivo by Elia (Elia, 1992). Elia estimated
the oxygen consumption of organs in vivo by
measuring the difference in arterio-venous oxygen
concentration across tissue and the blood flow rate.
The (kcal/(kg day))
values are reported as 200 for liver, 240 for the
brain, 440 for heart and kidneys, 13 for skeletal
muscle mass, 4 for fat mass, and 12 for residual
mass in adults. values are thought to
be higher in children (Chugani et al., 1987; Wang et al.,
2005). Hence, the adult
values estimated in
vivo by Elia (Elia, 1992) are adjusted in the Wang model
with an age depending factor ‘relative
’ (Wang, 2012),
which is the ratio of values in children to
that of adults. Relative values are assumed
from surrogate physiological parameters such as
brain oxygen consumption (Chugani et al., 1987),
heartbeat rates, and other physiological
parameters.
Modified model of RMR/BM in Indian children.
Eq.1 suggests that relative mass of organs (and tissues) and
their specific metabolic rates are the two major factors
that determine the in children and
adolescents. In this study, we look at two particular
sources of variation influencing the whole-body
. First of all, we
consider the variation in the relative mass of major organs,
assuming the specific metabolic rates of organs are constant
(Elia,
1992). Secondly, we consider the composition
of residual mass and its effect on the metabolic rate of
relative residual mass and in turn on
. We propose two models
for in Indian children as
follows:
Model 1: adjusting the relative mass of high
metabolic rate organs
We modified Eq. 1 by adjusting the relative organ mass of
four major organs (liver, kidney, brain, and heart)
by a fraction . We define
as the ratio of
relative organ mass () in the Indian
population to the in the Caucasian
population. Assuming of major organs
(liver, brain, kidney, heart) are adjusted by the
same fraction , Eq. 1 can be written
for the Indian population as
where
is the residual mass
after adjusting the relative mass of major organs by
a factor , whereas
is the relative
cellularity, and is the specific
metabolic rate of an organ.
Model 2: adjusting the metabolic contribution from
relative residual mass
In Model 2, in Eq. 1 is modified
under the assumption that the metabolic contribution
from residual mass in the Indian population is lower
by factor compared to the
Caucasian population. Thus, the alternate model for
can be written as
where
is the relative
cellularity, is the specific
metabolic rate, and is the relative mass
of the respective organs.
Statistical analysis
All descriptive data are reported as the mean
standard deviation
(SD). The measured and the theoretical values were compared
using the paired t-test with the significance level set at
. The relative organ
mass between the two populations was compared through a
non-parametric Wilcoxon signed-rank test, with the
significance level set at . All the analyses were
carried out using MATLAB R2019b (The MathWorks Inc., 2019) and R
version 3.6.2 (R Core
Team, 2019).
Results
The measured per unit body mass (kcal/(kg
day)) in Indian children is denoted as . represents the theoretical
expectation calculated from the Wang model (Eq. 1) with the
reference organ weights data reported by Altman and Dittmer (Altman and Dittmer,
1962). Similarly, calculated from Model 1 (Eq. 2)
is denoted as and from Model 2 (Eq. 4) as
. Subjects are grouped one year
apart in the analysis. We employ the following notation: Children
above the age of 10 but below the age of 11 years are denoted for
brevity as age group 10, and so on.
RMR/BM in Indian children is significantly lower than in
Caucasian children
We studied RMR/BM in Indian children using a mechanistic model by
Wang (Wang, 2012)
(Eq. 1) which partitions total body mass into four major
organs and residual mass.
The mean measured in the MCS
cohort, stratified by age, was compared with the theoretical
from Eq. 1 calculated
with the relative mass of the four major organs reported for
the Caucasian population (Altman and Dittmer, 1962). In Figure 3 and 4, the solid curve shows the mean
measured
(); the dotted curve is
the theoretical (Wang model) and is
representative of the mean in Caucasian children
(Talbot,
1938; Wang, 2012). In boys, the measured
is significantly lower
than the theoretical in the age groups 11,
13, 14, 15 and 16years (p < 0.05); but
not at 10 and 12 years (p = 0.70.09,
respectively). In girls, is significantly lower
than in all the age groups
from 10 years to 16 years: < 0.05 for 10 years and <
0.001 for 11 to 16 years.
We thus observe a significantly lower mean
in Indian adolescents
(232 girls and 260 boys) compared to the reference Caucasian
adolescents (Talbot,
1938), except in boys aged 9 to 11 years and
12 to 13 years.
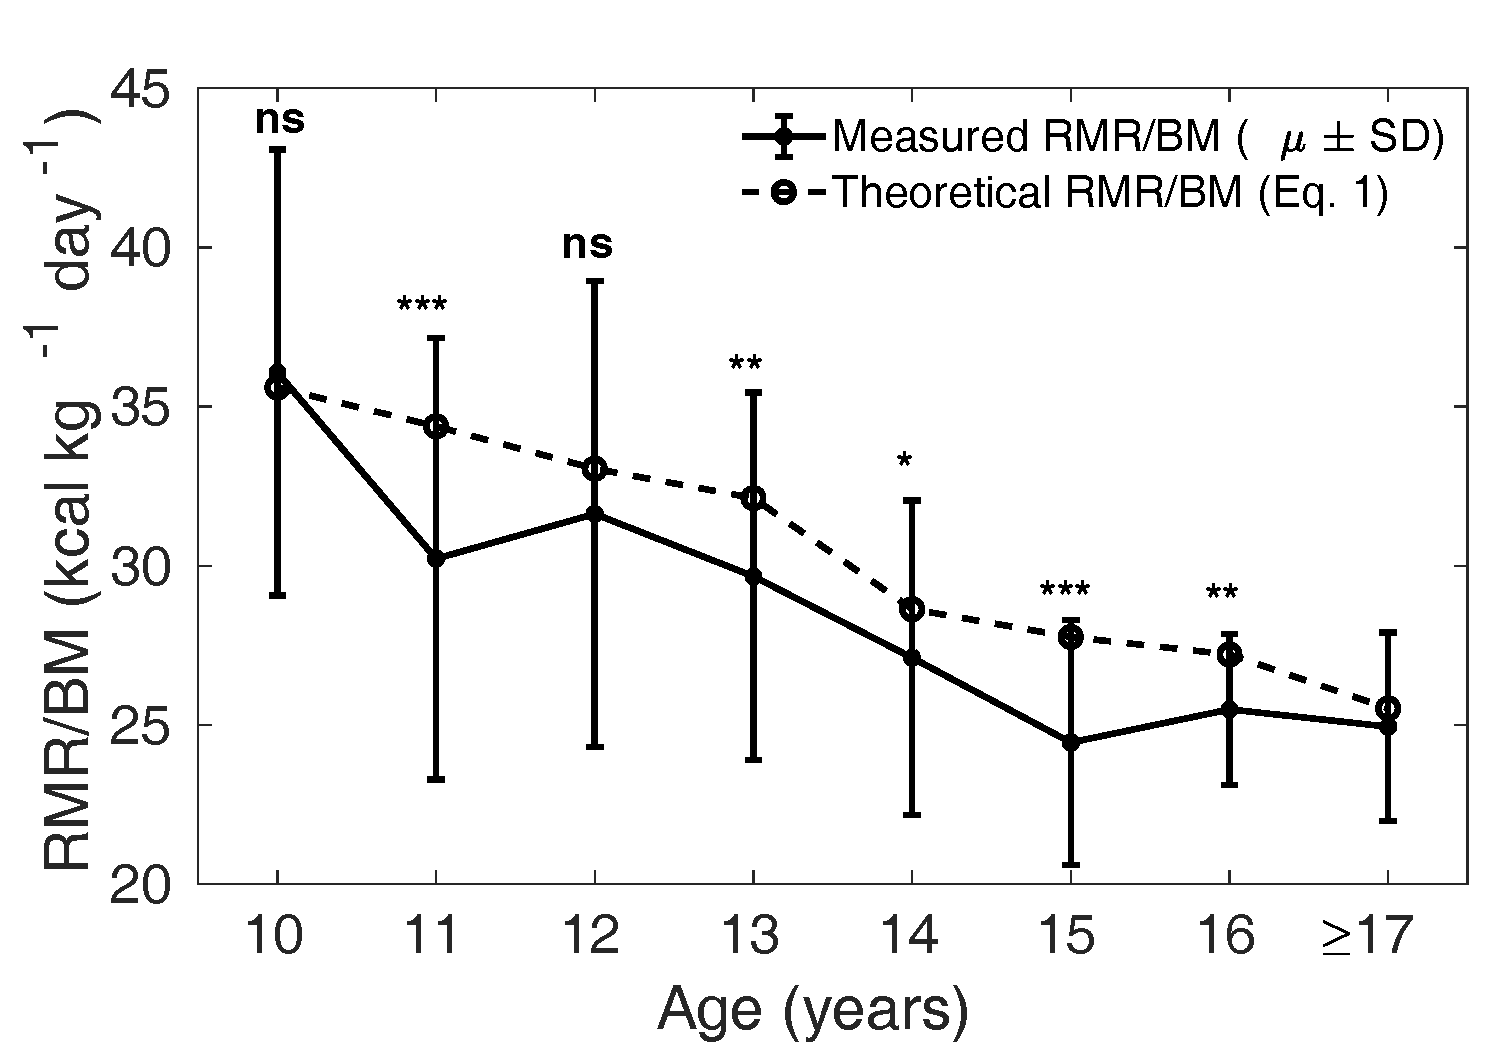
Figure 3 The solid curve shows the mean (± SD)
measured in each age
group, and the dotted line shows the mean
theoretical based on Eq. 1 for the
Caucasian population in boys. ns: not significant,
*:
p
< 0.05, **:
p
< 0.01 and
***:
p
< 0.001. The groups of 9- and
10-year-olds were combined for the statistical
tests. The analysis was not done when the number
of samples was less than 10 (for age 17 years and
above).
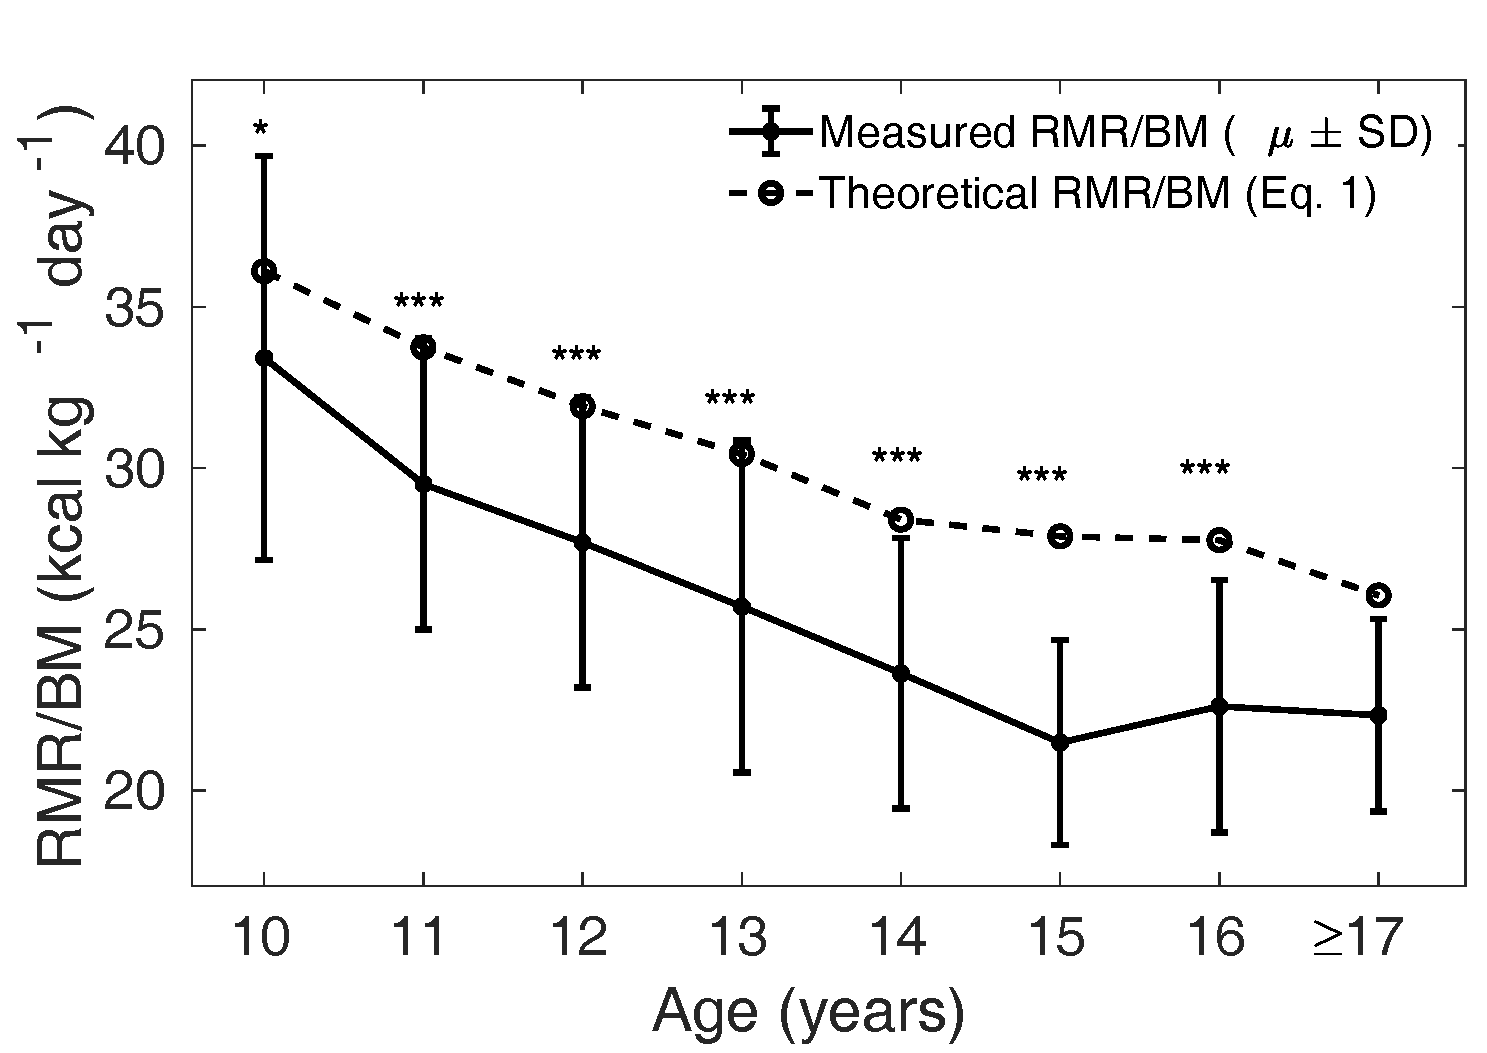
Figure 4 The solid curve shows the mean (± SD)
measured in each age
group, and the dotted line shows the mean
theoretical based on Eq. 1 for the
Caucasian population in girls. ns: not
significant, *:
p
< 0.05, **:
p
< 0.01 and
***:
p
< 0.001. The groups 9- and
10-year-olds were combined for the statistical
tests. The analysis was not done when the number
of samples was less than 10 (for age 17 years and
above).
A modified Wang model of RMR/BM for Indian children
Measured in the MCS dataset is
significantly lower than the mean in the Caucasian
population. In accordance with Eq. 1,
is determined by the
relative mass of four major organs, with smaller (larger)
leading to smaller
(larger) . Thus, we hypothesise
that the lower mean between the Indian and
the Caucasian children is due to a lower mean relative mass
of the four major organs in the Indian population.
We define (see Section 2.3.1
below) as the ratio of relative organ mass
() in the Indian
population to the in the Caucasian
population. Eq. 1 is modified to Eq. 2 by adjusting the mass
of major organs by a fraction (Model 1). We optimised
by minimising the mean
squared error (MSE) between the measured and the model (Eq.
2), for varying from 0 to 1.
The optimal values corresponding to
the least MSE was found to be in boys and
in girls.
Model 1 (Eq. 2) evaluated with optimal was then compared with
the measured , as shown in Figures 5 and 6. The dotted curve
shows the mean calculated from Eq. 2
with in boys (Figure 5) and
in girls (Figure 6). The
solid curve shows the measured
(SD). We verify that the
model is not significantly different from the measured
values, except in the age groups 10 and 15 years in boys and
15 years in girls.
Our modified Wang model (Eq. 2) is thus better suited to
predicting in Indian children
compared to the naive Wang model (Eq. 1). Physiologically
this implies that the relative organ masses in the Indian
population ought to be lower by the factor 0.90 in boys and
0.77 in girls compared to reference relative organ mass in
the Caucasian population (Altman and Dittmer, 1962).
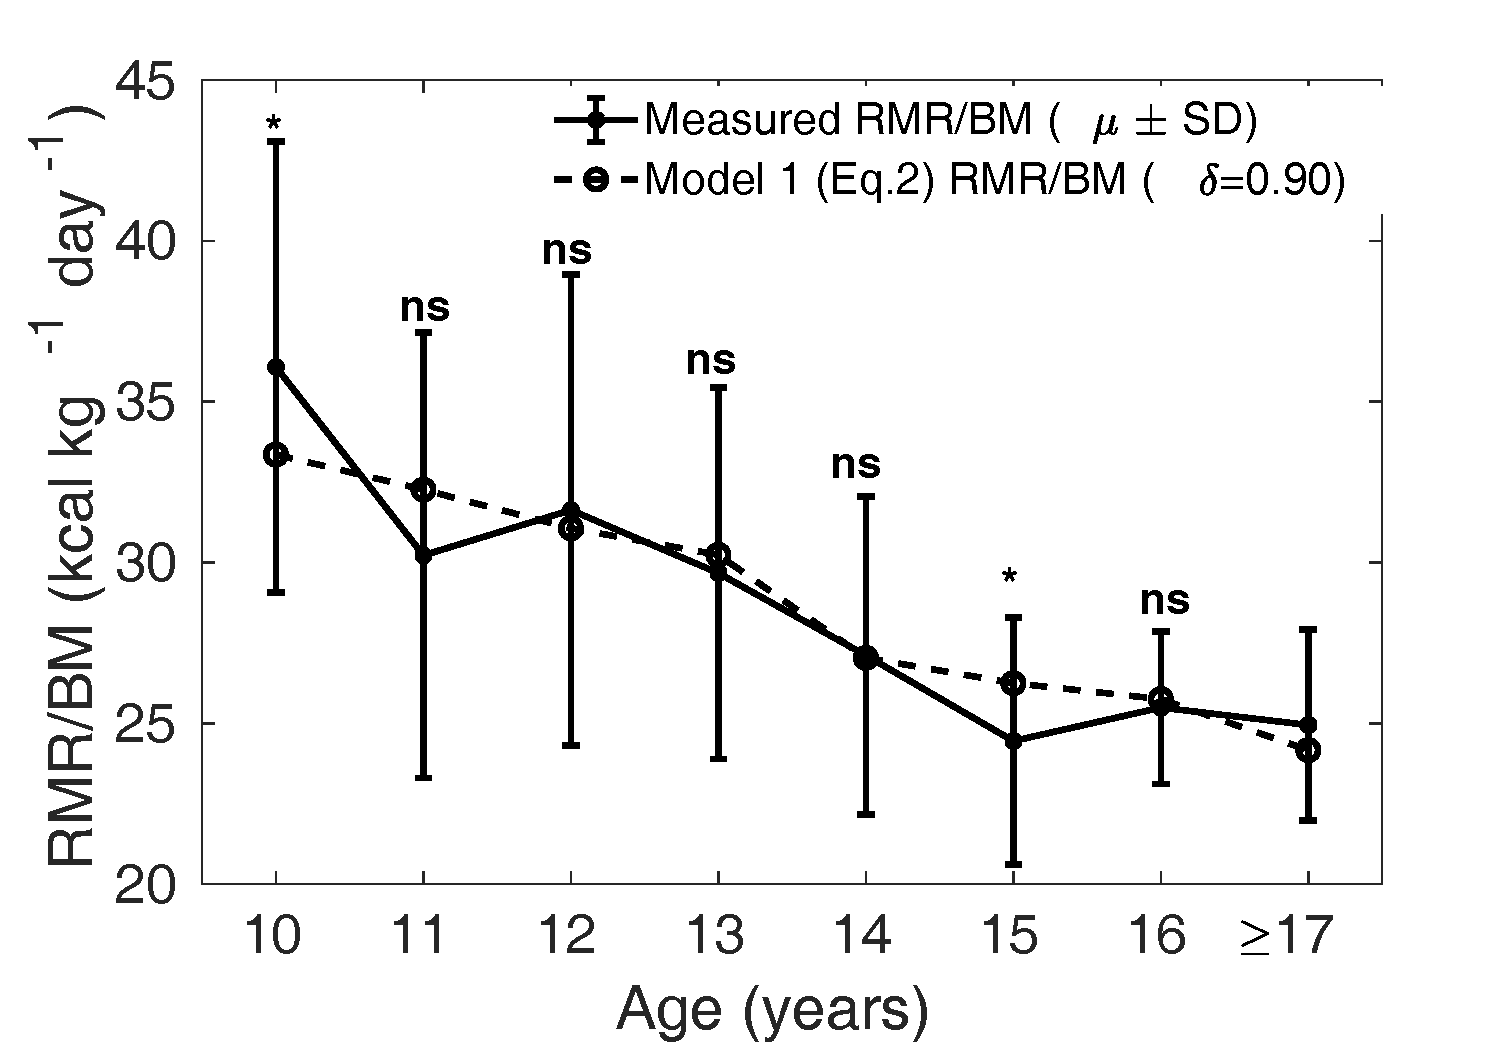
Figure 5 The dotted curve is the adjusted
calculated from Eq.
2 assuming
that the relative mass () of all the organs
(liver, brain, kidney, heart) are smaller by a
fraction of 0.90 in boys compared to that of
Caucasian population (1962), that is with
in Eq. 2. The solid curve
shows the mean measured in MCS dataset. ns:
not significant, *:
p<0.05,
**:
p<0.01
and ***:
p<0.001
(Compare Figure 3).
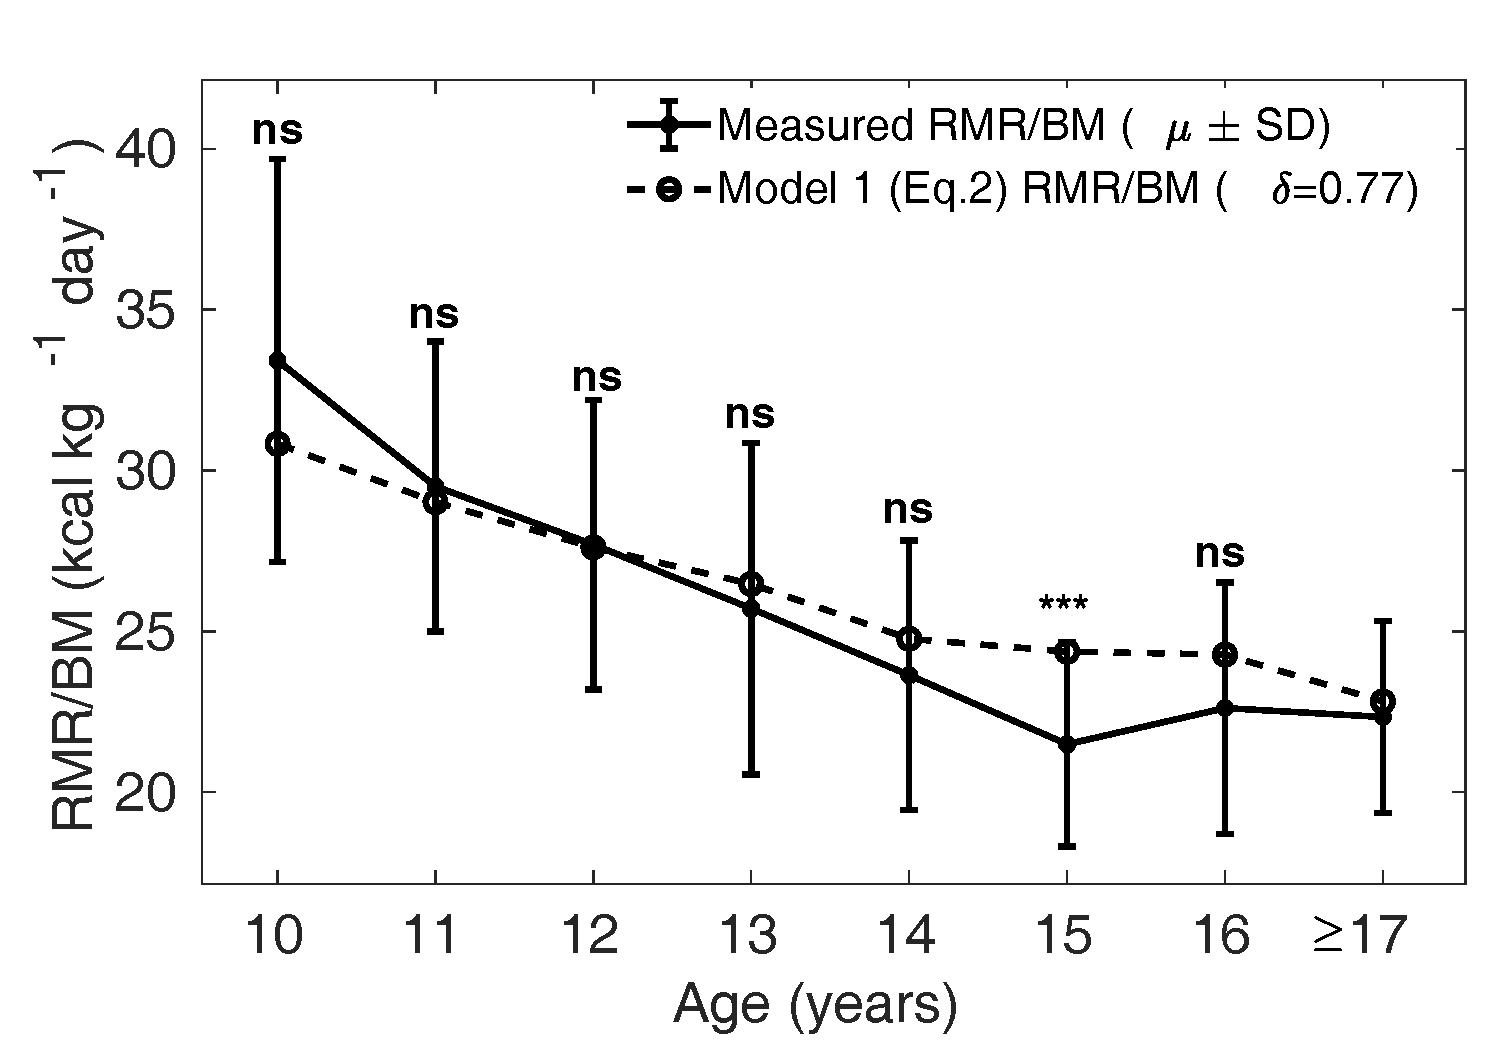
Figure 6 The dotted curve is the adjusted
calculated from Eq. 2
assuming that the relative mass
of all the organs
(liver, brain, kidney, heart) are smaller by a
fraction of 0.77 in girls compared to that of
Caucasian population (1962), that is with
in Eq. 2. The solid curve
shows the mean measured in MCS dataset. ns:
not significant, *:
p
< 0.05, **:
p
< 0.01 and ***:
p
< 0.001 (Compare Figure
4).
Relative kidney mass in 6 to 8 years old Indian children is
significantly lower, but relative liver mass is not.
Model 1 (Eq. 2) predicts that the relative mass of major organs
in the Indian population is lower by 10% in boys and 23% in
girls compared to the Caucasian population. We measured the
liver and kidney masses in 9 girls and 9 boys aged 6 to 8
years from the group of RMR-USG children to validate the
Model 1 predictions. The ratio of relative liver and
relative kidney mass () measured in the
RMR-USG dataset compared to the corresponding
in the Caucasian
counterparts (Altman and
Dittmer, 1962) are denoted as
and
, respectively. Figure 7 shows the
and
observed in the RMR-USG
dataset. The median () observed
is 1.32 (1.02, 1.40) in
boys and 0.92 (0.90, 1.08) in girls, while
is 0.90 (0.83, 0.96) in
boys and 0.83 (0.80, 0.91) in girls.
The observed in the RMR-USG
dataset is significantly lower (p = 0.009
in boys and p = 0.009 in girls; one-sided
Wilcoxon signed-rank test). Consistent with Eq. 2
predictions, the relative kidney mass measured in Indian
children is found to be lower than that of reference
Caucasian children in the respective age groups. However, we
failed to find any significant difference in the observed
(boys p
= 0.5 and girls p = 0.9).
It is noteworthy that the predicted by Eq. 2 was
close to the observed :
was 0.90 (0.83, 0.96)
compared to the prediction 0.9 in boys; in girls
was 0.83 (0.80, 0.91)
compared to the predicted 0.77. However, the
in both girls and boys
was higher than the optimal predicted by Eq 2.
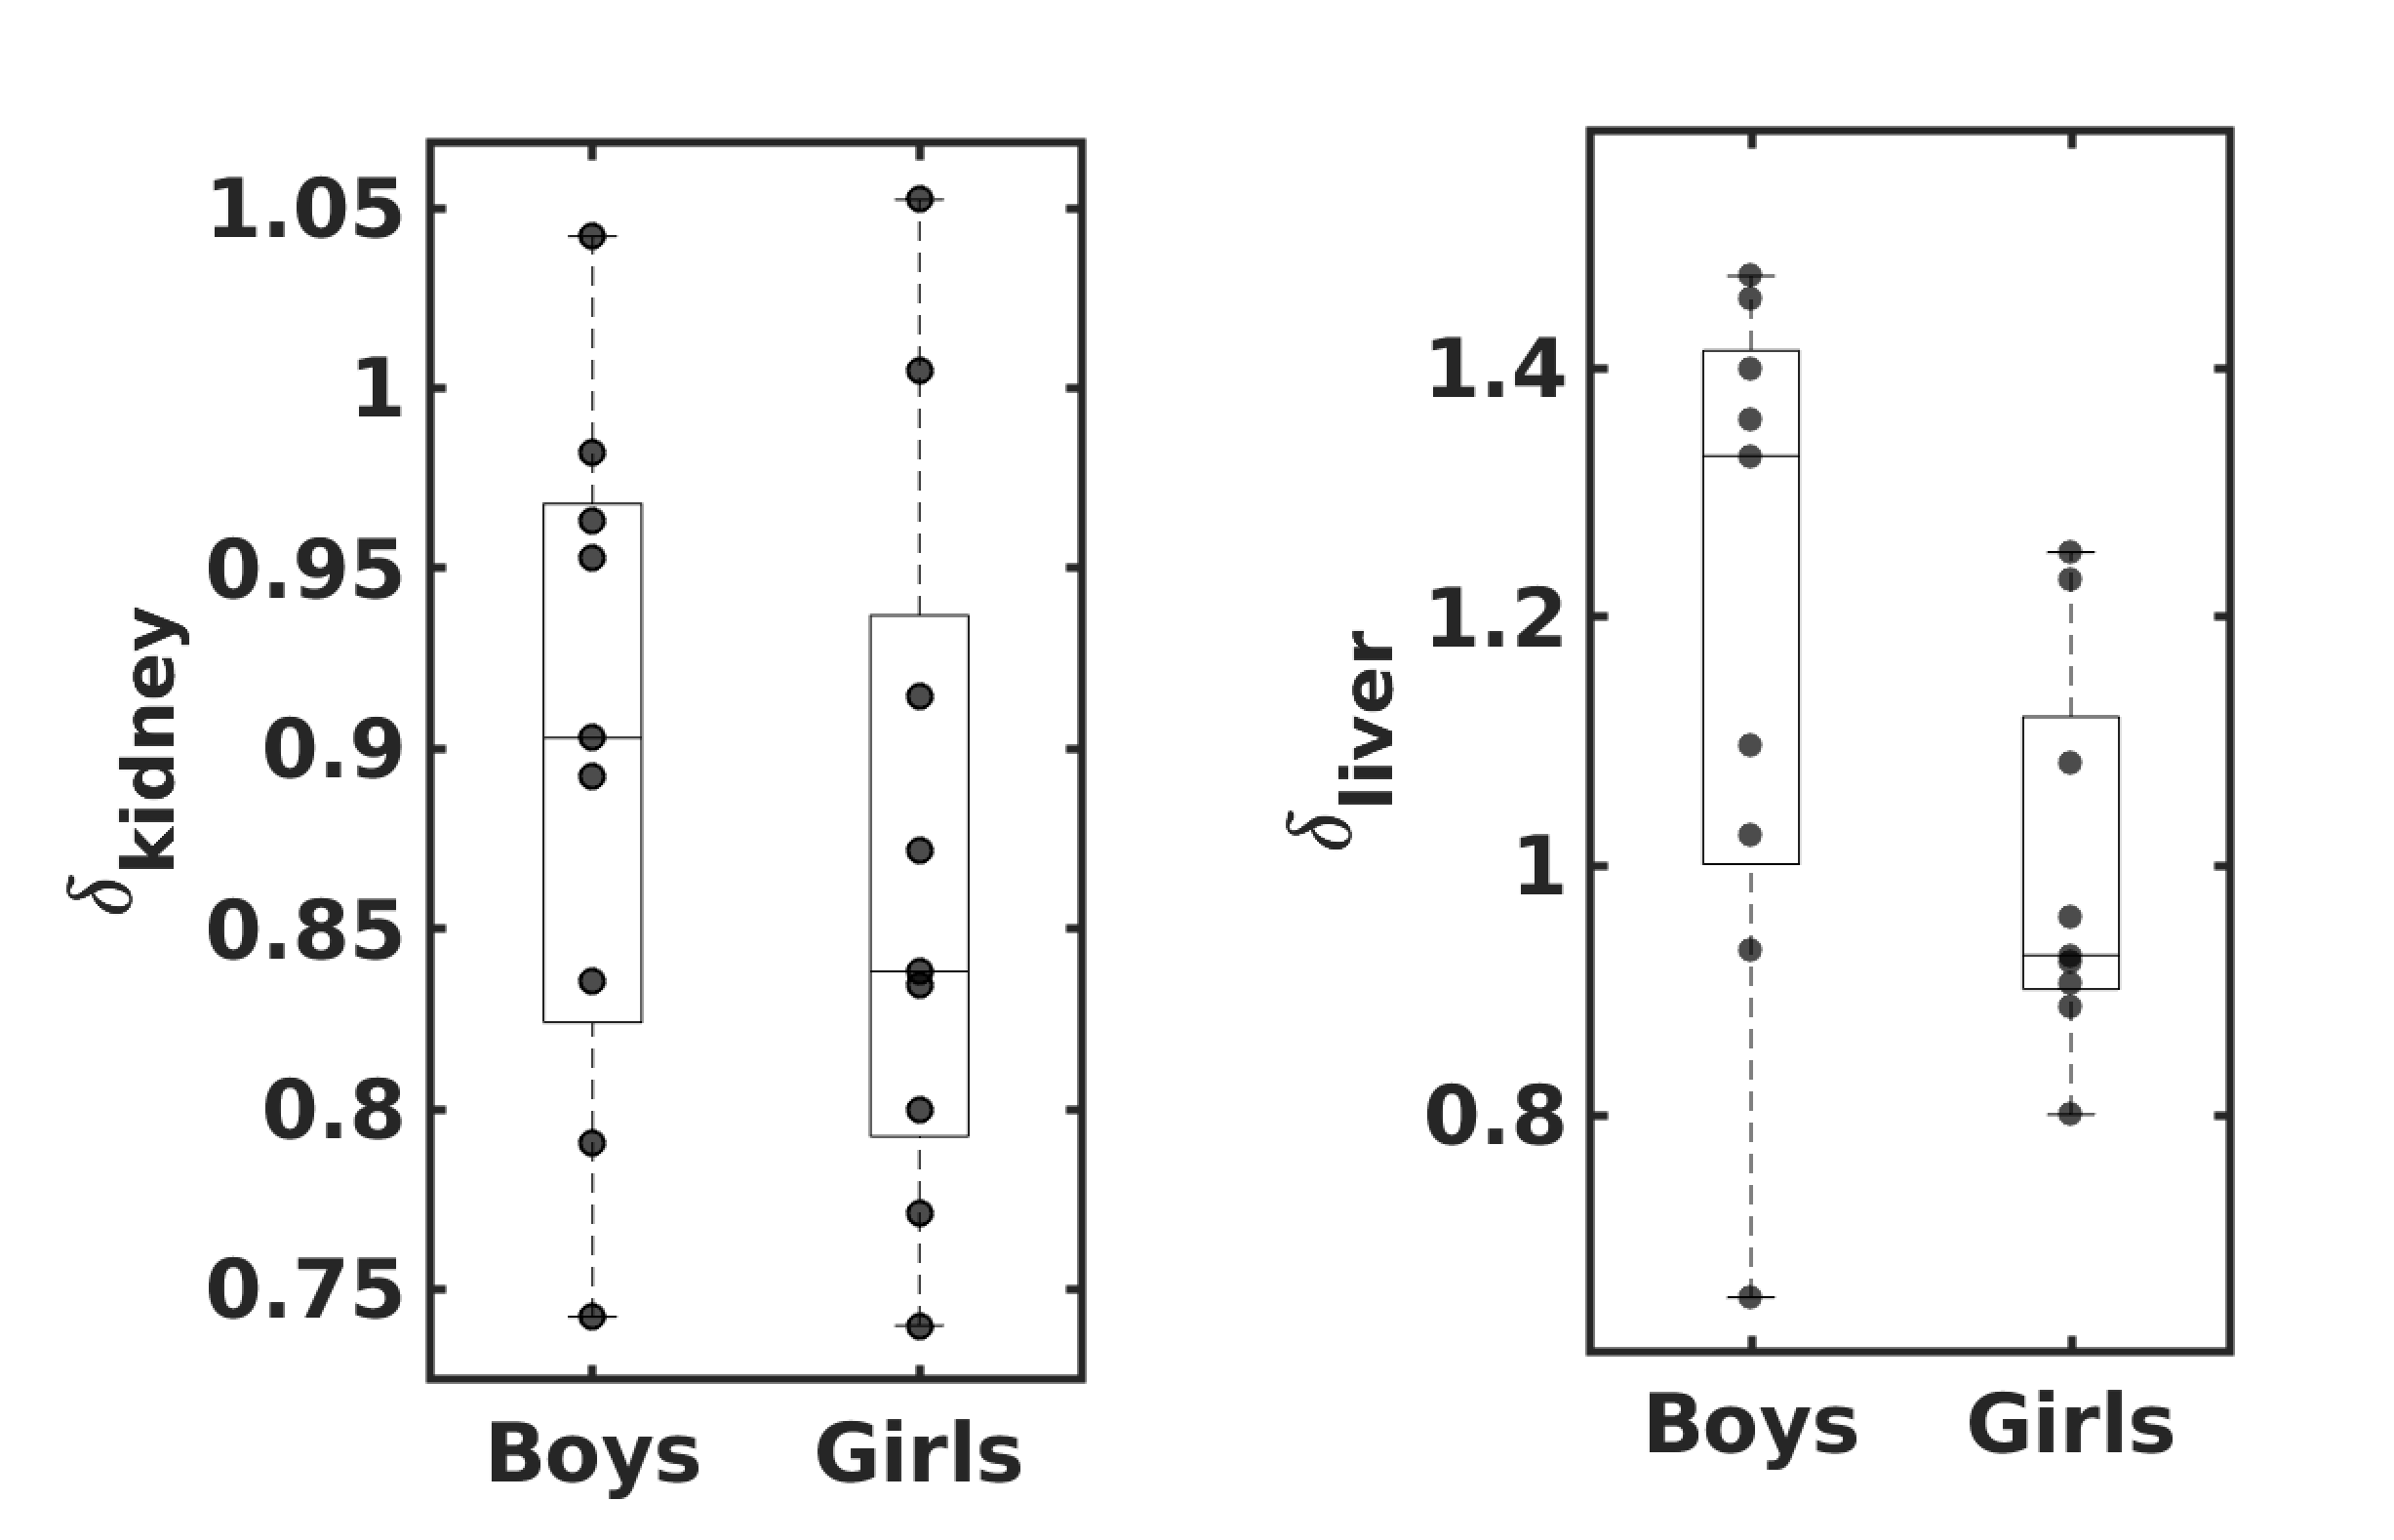
Figure 7
and
observed in Indian
children (9 girls and 9 boys), where
denotes the ratio of
the relative mass of the organ
`'
measured in RMR-USG dataset to that of their
Caucasian counterparts (Altman and Dittmer, 1962). The
lower and upper whiskers indicate the minimum and
the maximum values; and the lower edge, middle
line and the upper edge of the box indicate the
25th percentile, median and the
75th percentile values, respectively.
The dots show the observed individual
values.
Alternate model of in Indian children
based on residual mass
Residual mass (the mass remaining after subtracting liver, brain,
heart, and kidney mass from total body mass) constitutes a
much larger part of the body mass compared to the sum of
masses of four major organs. The residual mass is composed
mainly of skeletal muscle mass and fat mass, along with
lungs, spleen, gastrointestinal tract, connective tissue
etc. Broadly speaking, skeletal muscle mass and fat mass are
the more malleable components of the body compared to the
sizes of the major organs. Moreover, the fat and muscle mass
per cent in Indian children is characteristically different
from the Western population (Chiplonkar et al., 2017). This
can potentially account for the wide variation in
between children. To
examine this possibility, we next studied an alternate model
of (Model 2) which takes
into account the variation in the metabolically active
constituents of residual mass.
We modified Eq. 1 to Eq. 4 (Model 2) by incorporating a factor
which adjusts the
metabolic rate of relative residual mass in the Indian
population. An optimal was obtained by
minimizing the mean squared error between the measured
and the
calculated by Eq. 4 in
the MCS dataset, for ranging from 0 to 1.
The corresponding to the
least MSE is found to be 0.85 in boys and 0.65 in girls.
In Figure 8 and 9, the dotted curve
shows the calculated from Model
2, with in boys and
in girls (Figure 9); the
solid curve shows the measured
() in the MCS dataset. In
boys (Figure 8), the
dotted curve is not significantly different from the mean
measured in the MCS dataset
(solid curve), except in the age groups 11 and 15 years
(p = 0.03 and 0.02, respectively).
Similarly, in girls the solid curve is not significantly
different from the dotted curve, except in the age group 15
years (p = 0.001).
can be interpreted
physiologically as the effect of body composition
differences on . Thus Model 2 raises
the hypothesis that the metabolic contribution from the
relative residual mass is reduced in the Indian children,
lower by 15% in boys and 35% in girls, if the relative mass
of major organs is assumed to be similar in the two
populations. This indicates that variation in body
composition could play a considerable role in determining
in Indian children.
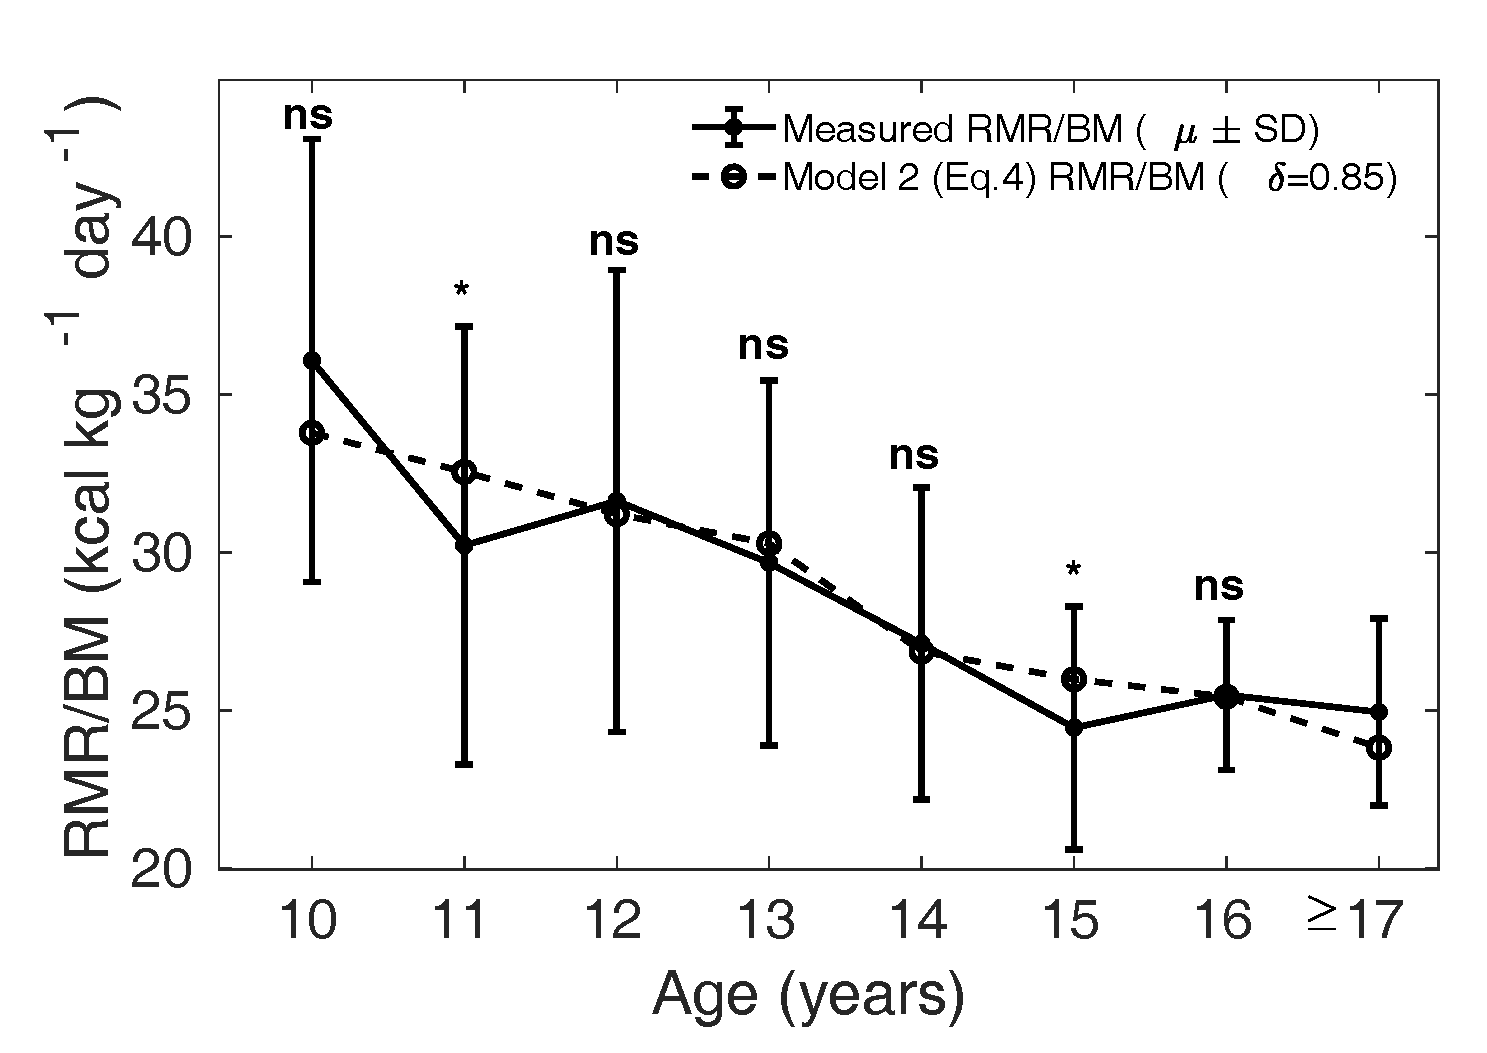
Figure 8 Measured (µ ± SD) is shown as
the solid curve, and the dotted curve shows the
calculated from Eq. 4
with in boys and reference
relative organ mass for the Caucasian population
(1962).
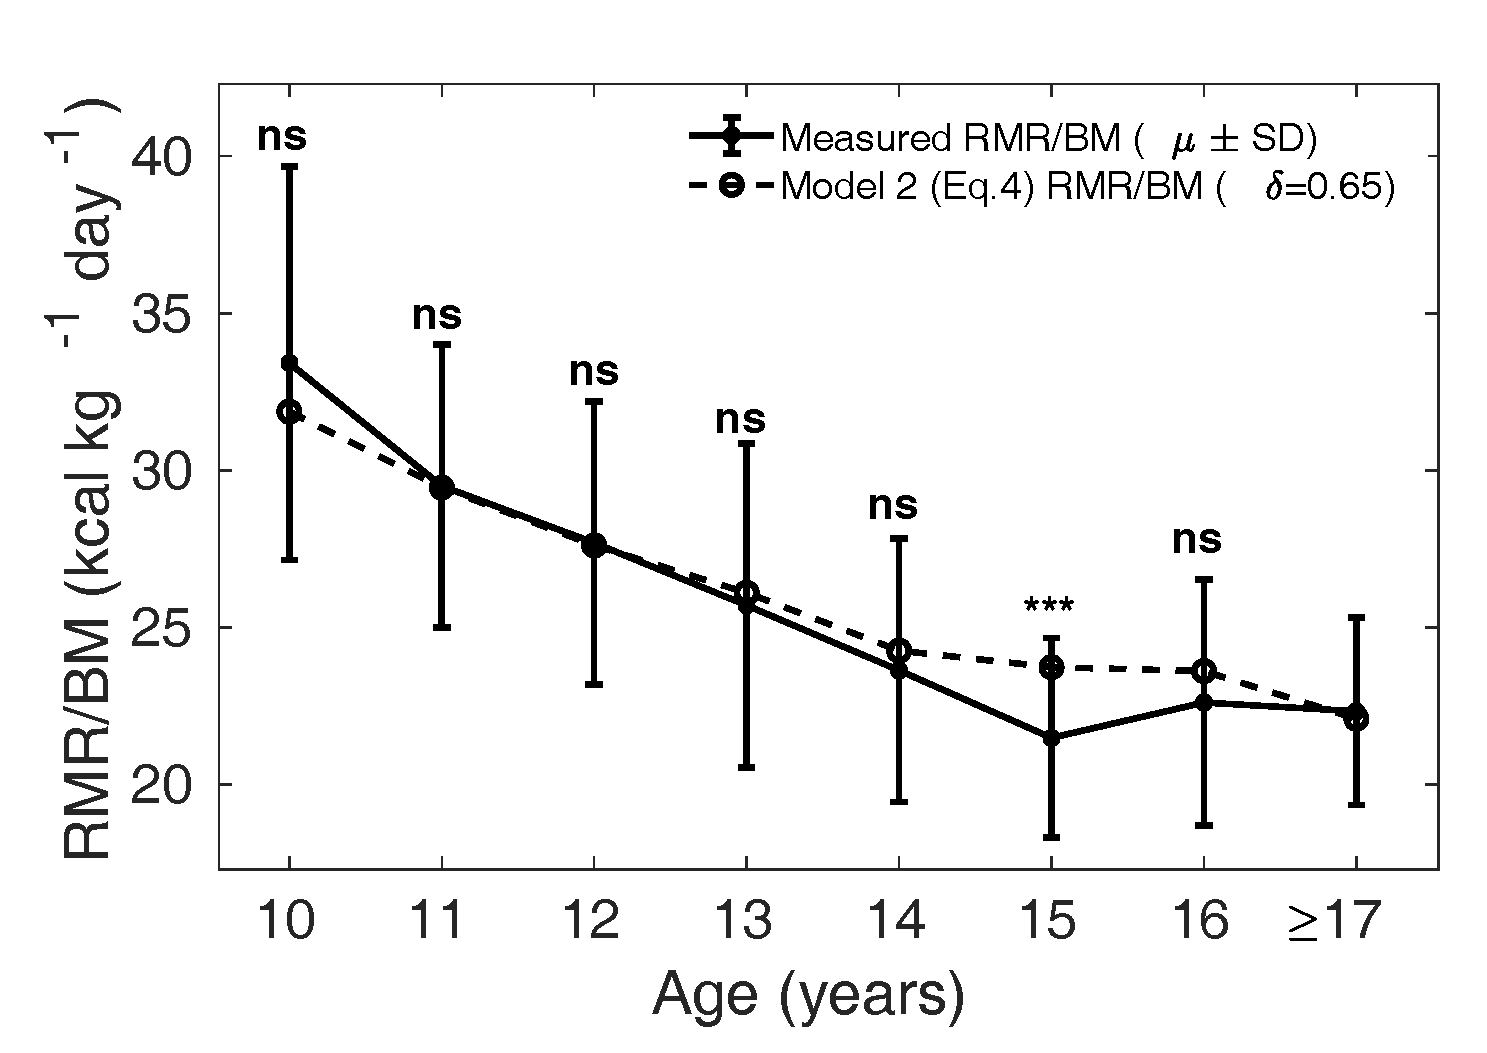
Figure 9 Measured (µ ± SD) is shown as
the solid curve, and the dotted curve shows the
calculated from Eq. 4 with
in girls and
reference relative organ mass for the Caucasian
population (1962).
Discussion
Resting metabolic rate () is a significant factor in
determining energy balance, which in turn critically influences the
energy available for growth from birth to adulthood. The mean RMR
per unit body mass () is not uniform across
populations; Indian children have significantly lower
compared to their Caucasian
counterparts. Not only are these population differences not
understood from a physiological standpoint, but inter-individual
variations are also poorly explained. Several models have been
proposed over the years to try to explain through various anthropometric
variables such as height and weight as well as fat or fat-free mass.
One such prominent model is the Katch-McArdle equation (Katch et al., 1990),
which computes as due to fat-free mass:
. However, such models have been
reported to explain only about 60–80% of the intraspecific
variation. An alternate strategy is to explain the
mean RMR of children clustered into
one-year age groups. A very successful model in this class is the
Wang model, which achieves an . However, it is unclear if the
Wang model is readily applicable to other populations. In
particular, the Caucasian dataset modelled in the Wang study shows
little variation in the age-stratified data, whereas a much wider
variability is expected, in general, in Indian children. In this
study, we attempt to modify the Wang class of models for application
to Indian children. It is worth pointing out that using linear
regression models based on body composition, such as the
Katch-McArdle equation, we could only explain about 70% variation in
the mean in an age group. We also
explored several other regression models based on body composition
and anthropometry, but they each explained only 30–60% of the
inter-individual variation in RMR observed in Indian children
(analysis not shown).
In this work we construct two models of in Indian children based on the
Wang model (Wang, 2012),
which describe the mean stratified by age
phenomenologically. In Model 1, we assume lower organ masses are
responsible for the lower observed ; in Model 2, residual masses
are calibrated to the observed . The coefficients of
determination () in explaining the mean
measured for Model 1 and Model 2 are
0.84 and 0.85 in boys and 0.95 and 0.97 in girls, respectively. The
lower accuracy of these models in describing the
in Indian children compared to
the Caucasian children () is consistent with high
variation in the observed (ranging from 612 to 2370
kcal/day). It seems unlikely that larger sample sizes would
substantially improve the accuracy of the model.
Next, we asked if these models provide a physiological understanding of
the lower observed in Indian children. If
the lower is due to a lower relative mass
of four major organs (liver, kidney, heart, brain) through a
modified Wang model, Model 1 (Eq. 2) predicted that the relative masses of the four
major organs should be lower by 10% in boys and 23% in girls. Our
pilot study designed to test these predictions showed the relative
kidney mass was significantly lower, but it failed to find any
significant difference in the relative liver mass. It is interesting
to note that a lower relative kidney mass in Indian children is
consistent with the Barker hypothesis (Almond and Currie, 2011) and the
observation of fewer nephrons in low birth weight babies (Wlodek et al., 2008). On
the other hand, failure to observe a significant difference in
relative liver weight could suggest a lower
instead, which is consistent
with lower values reported in South Asian
females (Shirley et al.,
2019). One limitation of the current study is the
assumption that brain and heart masses are likely to be relatively
conserved within an age group; due to practical difficulties, these
were not measured in our study.
To provide further contrast, we constructed Model 2, which analyses the
influence of metabolically active constituents of residual mass on
. Model 2 predicts that the
metabolic rate of residual mass is lower by 15% in boys and 35% in
girls in the Indian population compared to the Caucasian population.
Model 2 re-emphasizes the importance of body composition in
explaining variation in . It is interesting that a
century-long attempt to decipher the relationship between body
composition and RMR has not been very successful (Aub and Du Bois, 1917;
Bedale, 1923;
Corrigan et al.,
2020; Cunningham,
1980; FAO/WHO/UNU,
1985; Harris and
Benedict, 1918; Henry, 2005; Katch et al., 1990; Kleiber, 1932; McMurray et al., 2014; Mifflin et al., 1990;
Owen et al., 1987;
Schofield, 1985).
Thus, understanding the physiological underpinnings of Model 2
remains an open problem. Finally, we note that it is plausible that
more complex formulations than basing RMR on either organ mass or
residual mass are necessary. One attractive approach for future work
is to employ data-driven machine learning strategies to discover
these complex relations.
We remark on some refinements of our work that might be possible in
future studies. In children, strict standard conditions for RMR
measurement are difficult to achieve. The terms basal metabolic rate
(), resting metabolic rate
() and resting energy expenditure
() are different measurements of
the resting metabolism and are often used interchangeably; however,
and can be 3–10% higher than
, as they follow less stringent
settings for the measurements (Psota and Chen, 2013). In our study,
in children was not measured
following fasting conditions alone; hence, RMR measured in our study
could be higher than the basal metabolism; such differences could be
up to 100 kcal/day (Haugen
et al., 2003). However, indirect calorimeters have
been reported to underestimate in some studies (Purcell et al., 2020).
We argue that the distinct patterns in boys and girls are of prime
interest, and these are less likely to be explained by measurement
bias alone. Climate and temperature difference during
measurements also add to this
variability.
The ratio was used to normalize the
with respect to
. This ratio has been used by
several studies, including (Rahmandad, 2014; Wang, 2012). However, other authors have critiqued
this ratio due to the observation that a linear
– relationship extrapolates to a
non-zero intercept (Poehlman and
Toth, 1995; Tschöp
et al., 2012). While it is not immediately clear if
should be normalized by
, in our study, we follow the
Wang (Wang, 2012) model
closely. In other words, since our comparisons are with respect to
the Wang model, the appropriate variable in our work is the
normalized .
The significance of our study is that a lower in Indian children can
significantly influence energy balance and amplify the effects of
lower or higher energy intakes. Swinburn and colleagues (Swinburn et al., 2006)
have reported that even a 10% change in total energy expenditure
(; consists of
as a component) could lead to a
4.5% difference in mean weight of children between two populations.
The implications of lower in Indian children on the
dynamics of growth and development will be studied in the future, in
particular, using quantitative models of growth and weight changes
(Hall et al.,
2013). The present study has provided that basis through two
phenomenological models, either of which can be used to estimate
age-wise mean in Indian adolescents. While
predicting individual is far from complete, the
present models are likely to be referred to by clinicians and
policymakers to infer energy expenditure benchmarks in Indian
children. Such studies are critical to understanding the
implications of a lower in growth, development, and
life-course diseases.
Data Availability
The datasets analyzed during the current study are not publicly available
in order to protect subject anonymity. Please contact the
corresponding authors for reasonable requests to access raw
data.
Author contributions statement
PG and AK conceived the study. AK and NK were involved in collecting the
MCS dataset. ASK, AK, and NK were involved in collecting the RMR-USG
dataset. PG and SA carried out the mathematical and statistical
analysis and the analysis was reviewed by AK, NK, and ASK. PG and SA
wrote the paper together with AK. All authors contributed to the
manuscript.
Appendix
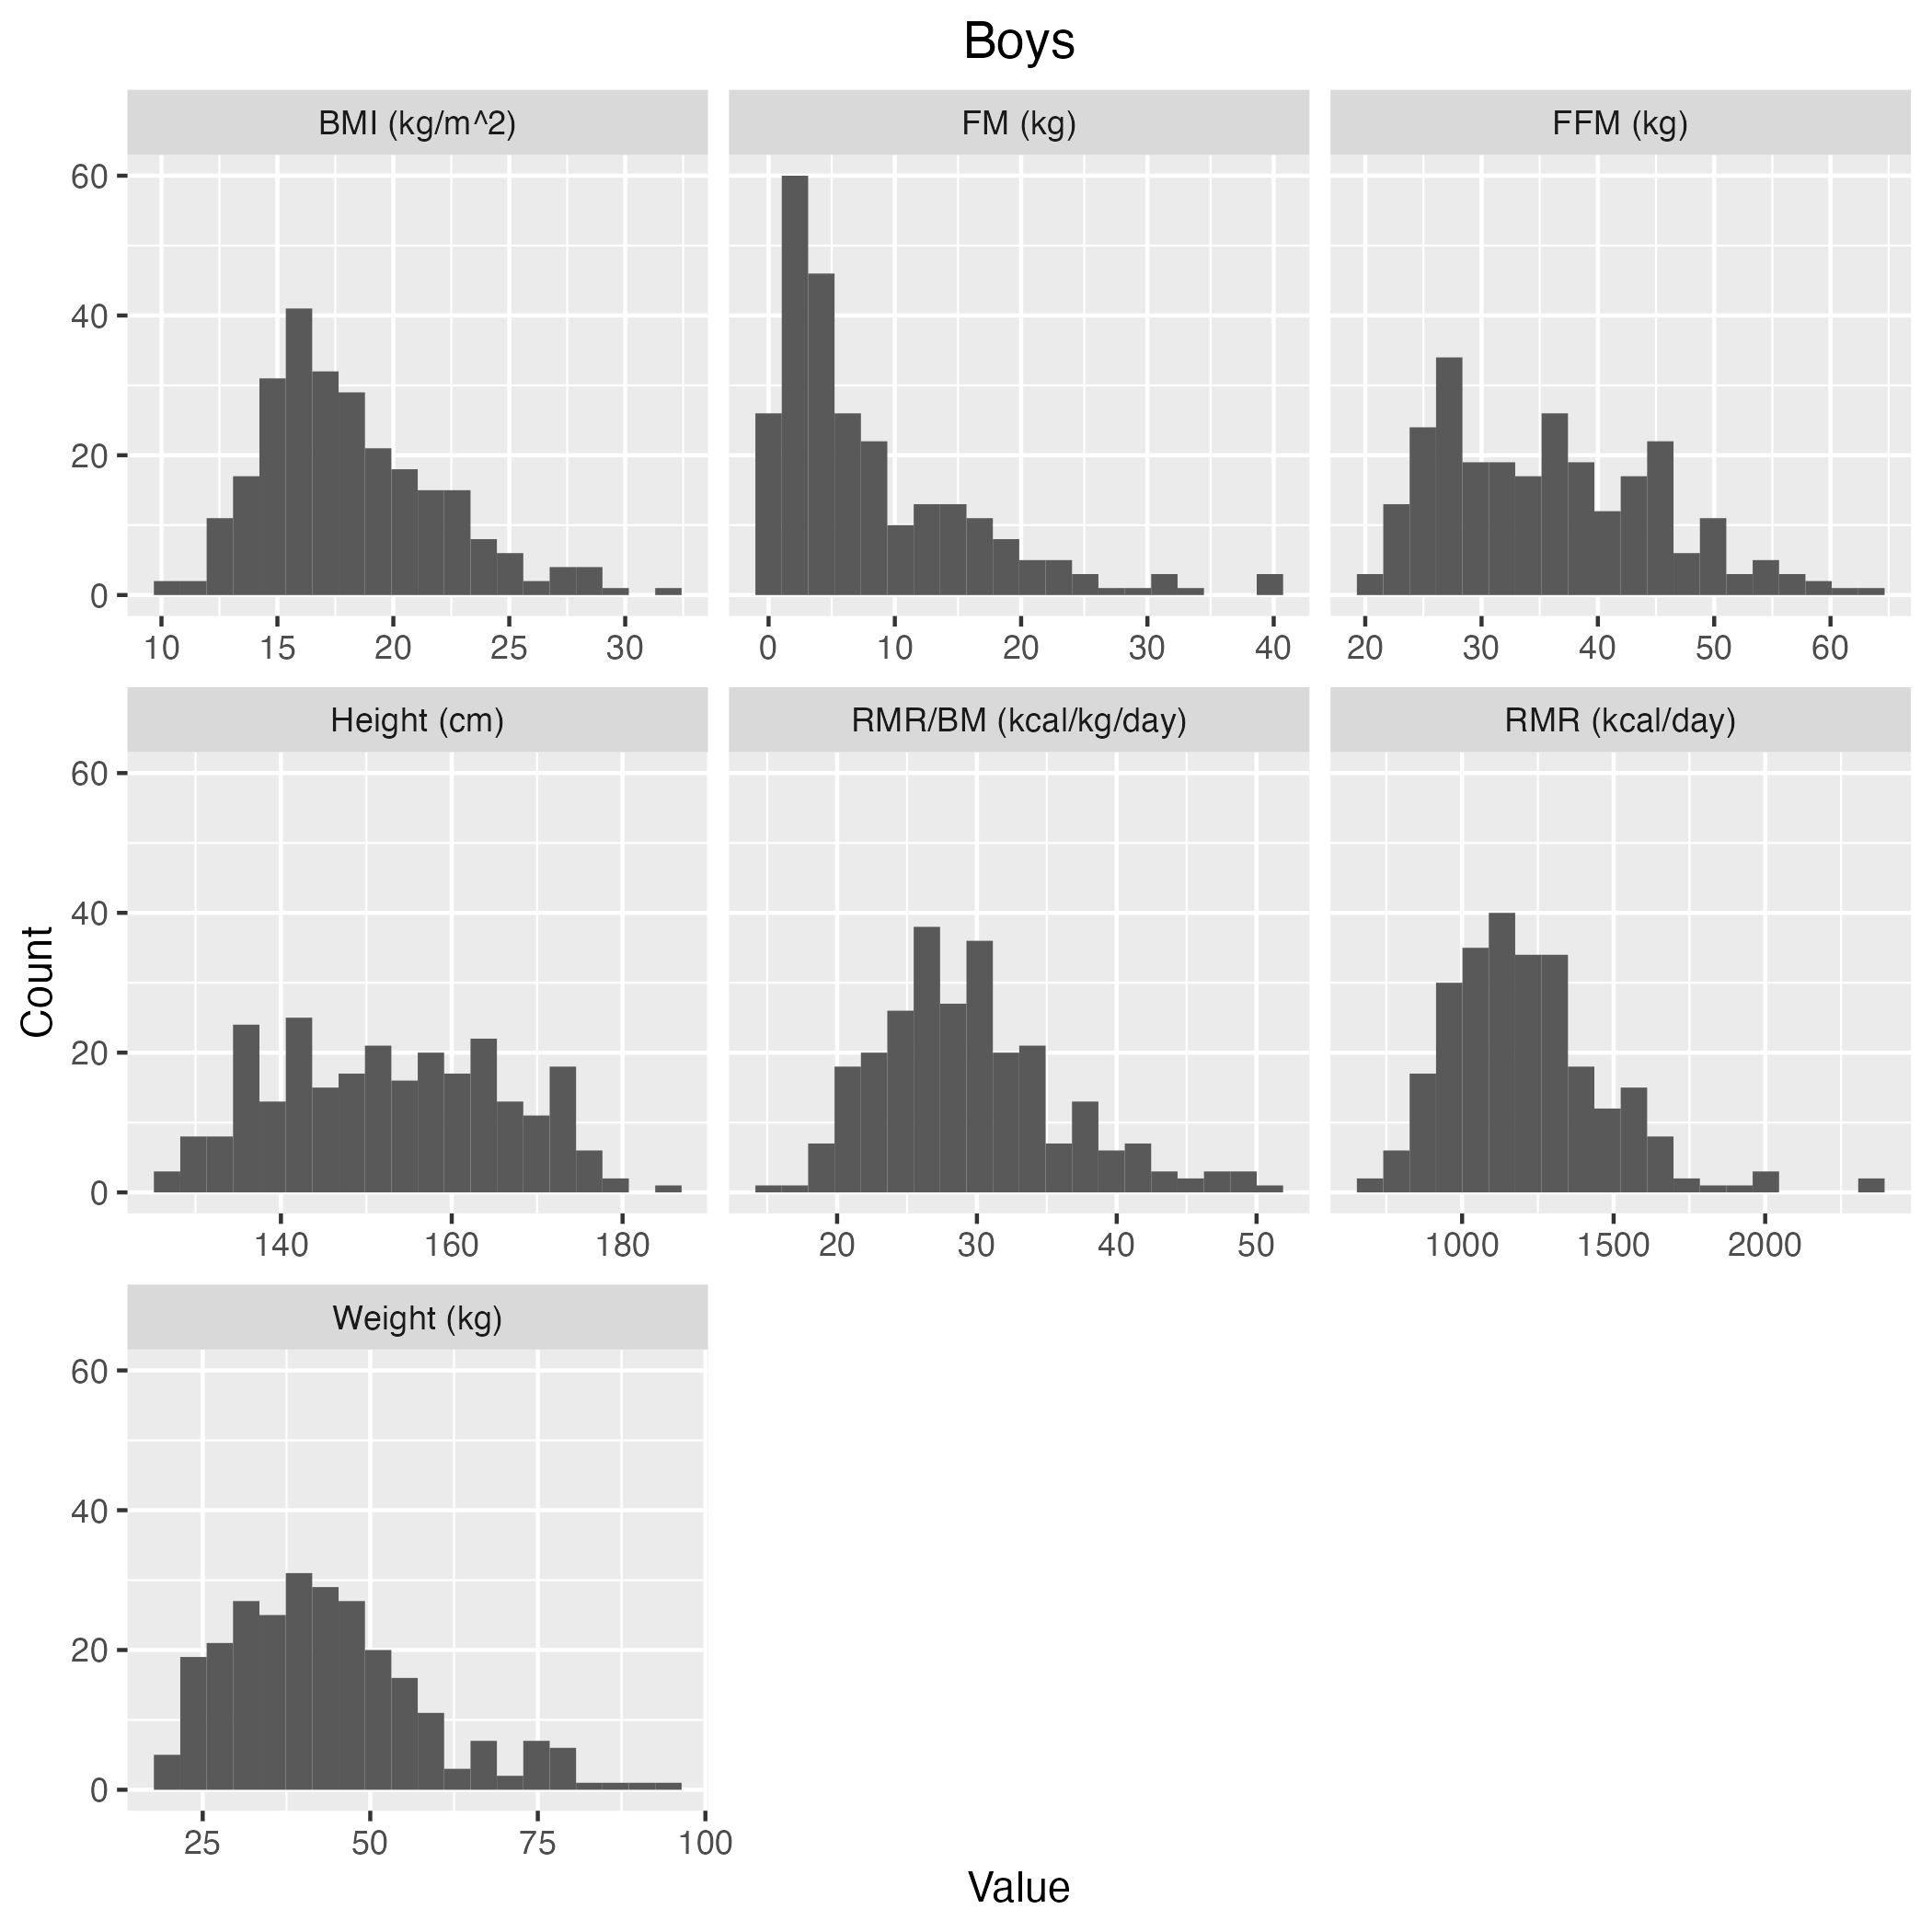
Figure S1 Histogram of the measured covariates in
RMR-MCS dataset in
boys.
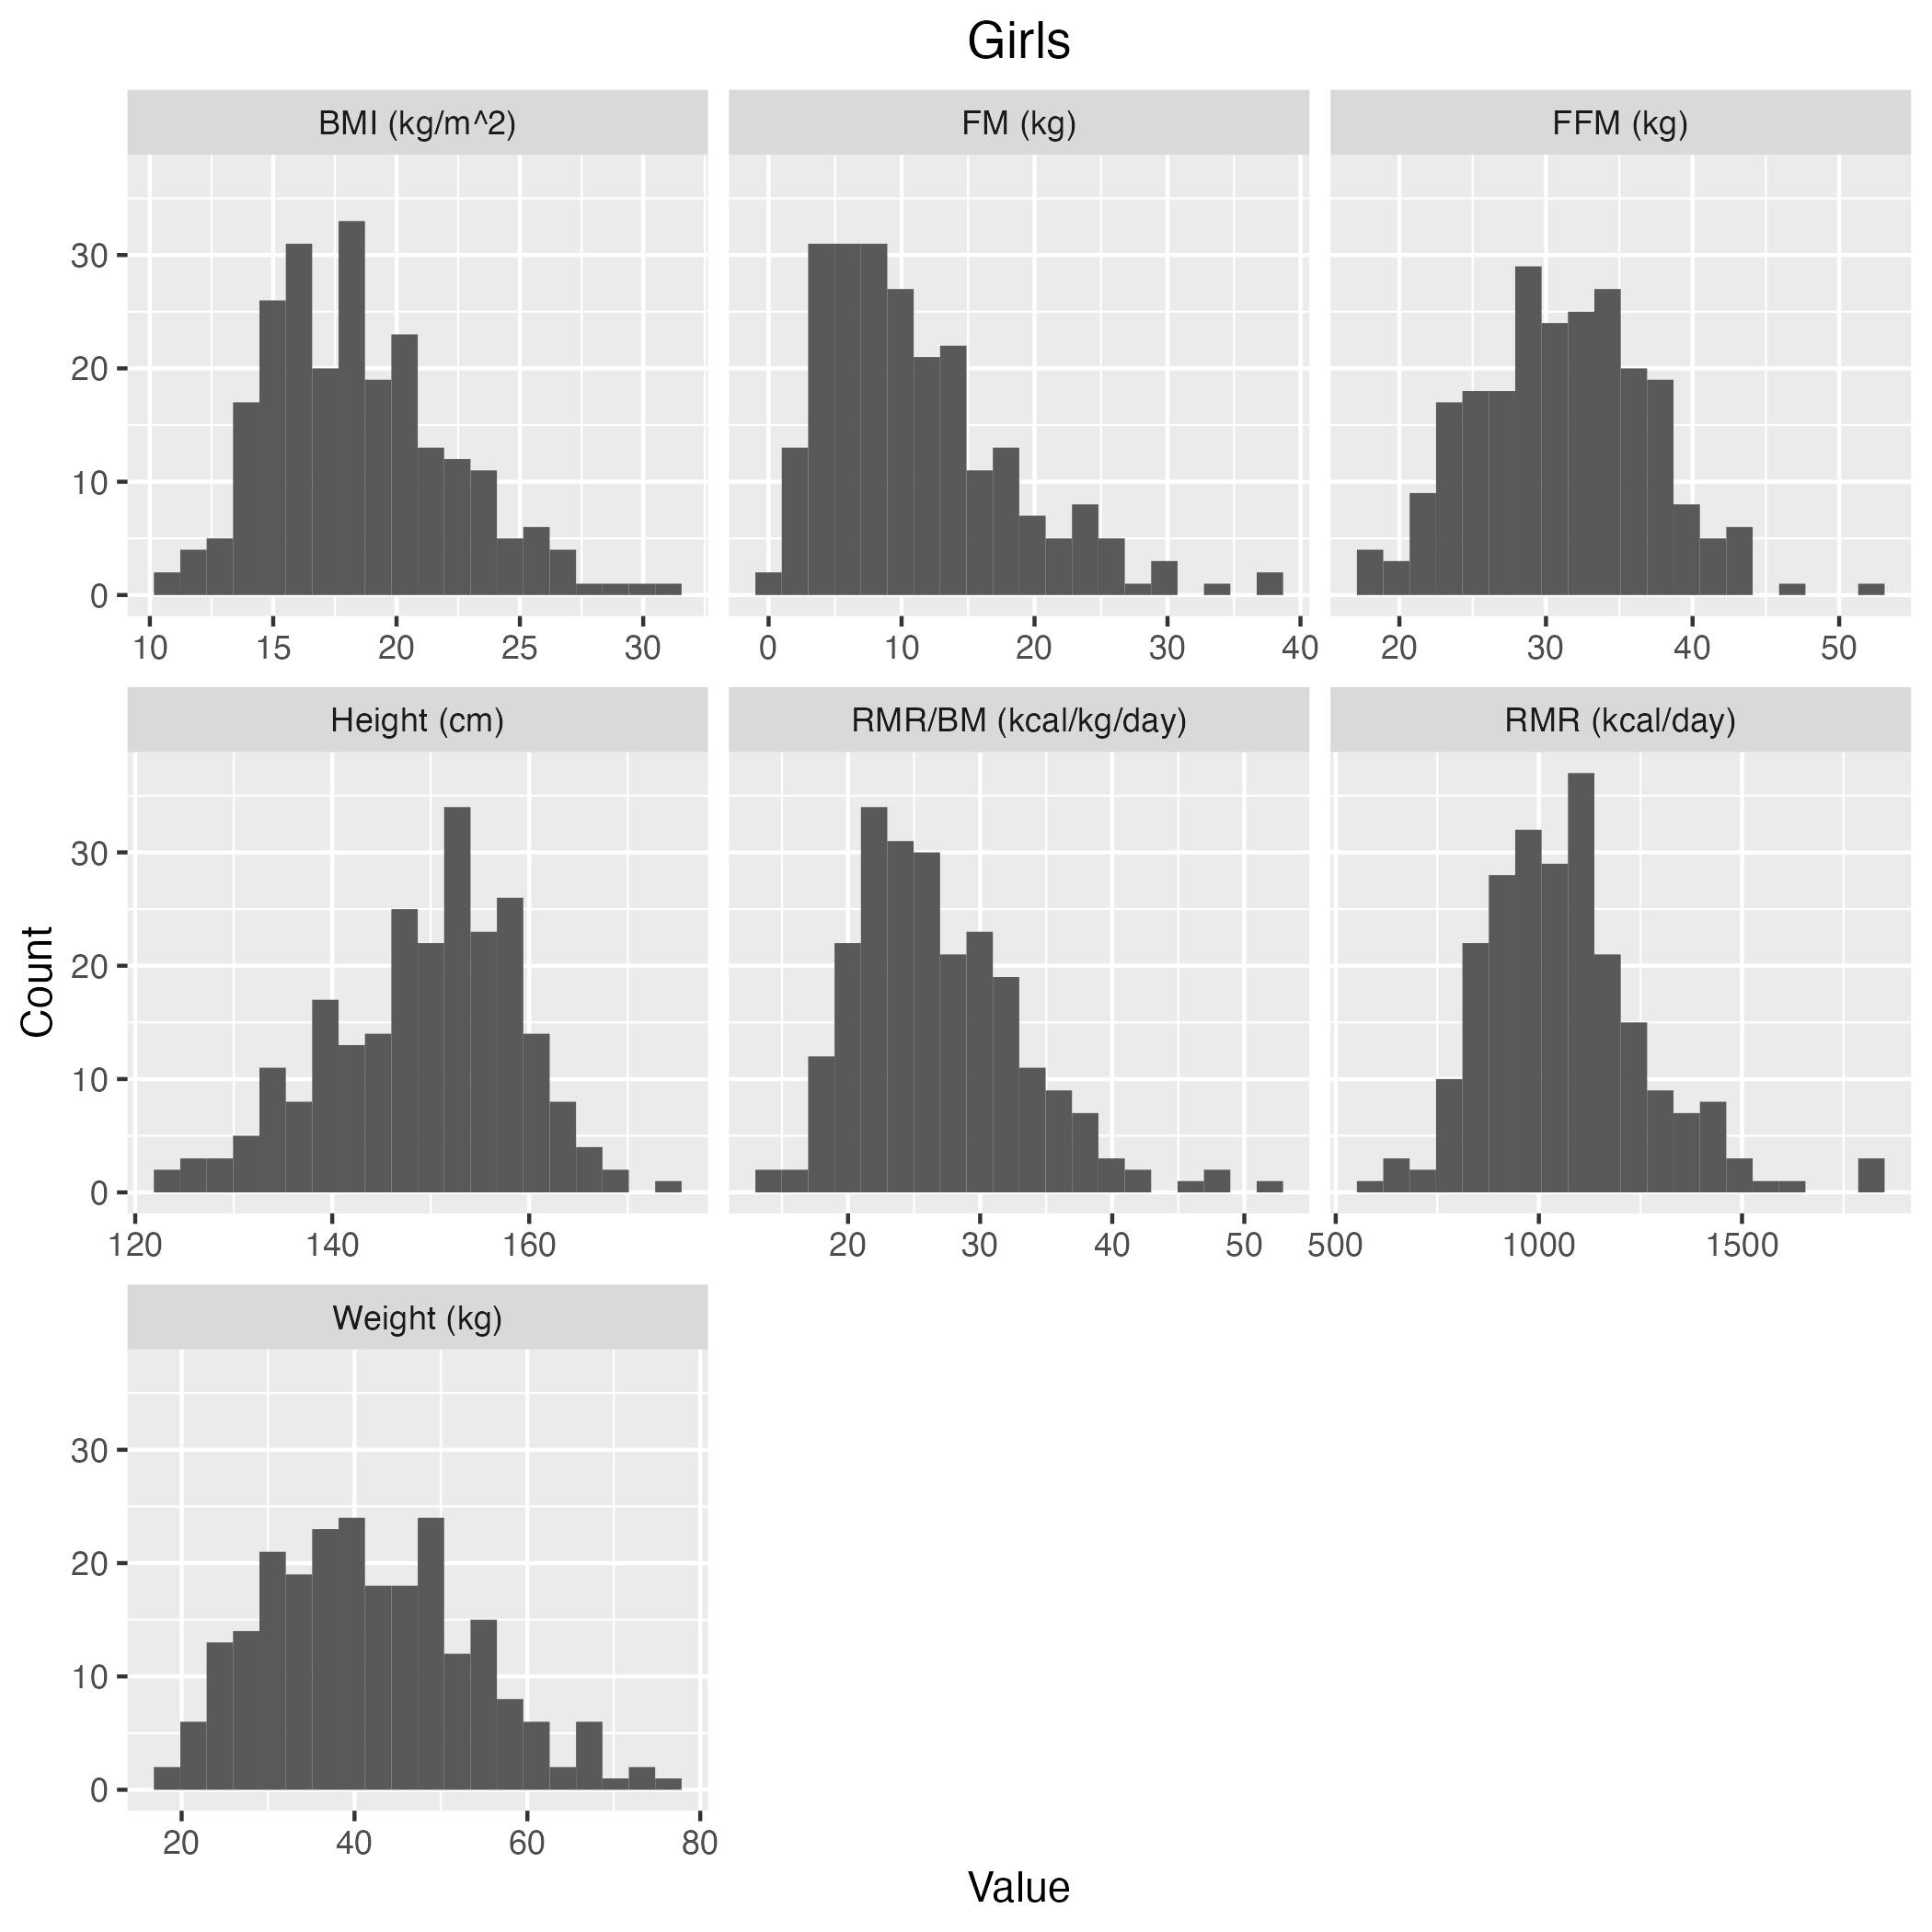
Figure S2 Histogram of the measured covariates in
RMR-MCS dataset in
girls.
Acknowledgements
We thank all the children and parents for their consent to share the data
and participate in this study. SA was supported by the Council of
Scientific and Industrial Research, Govt. of India.
An early version of the manuscript is available as a preprint (Areekal et al.,
2021).
References
Almond, D./Currie, J. (2011). Killing Me Softly: The
Fetal Origins Hypothesis. Journal of Economic Perspectives
25 (3), 153–172. https://doi.org/10.1257/jep.25.3.153
Altman, P. L./Dittmer, D. S. (1962). Growth, including
reproduction and morphological development. Federation of
American Societies for Experimental Biology, Washington,
DC.
Areekal, S. A./Khadilkar, A./Ekbote, V./Kajale,
N./Kinare, A. S./Goel, P. (2021). Two Novel Models
Evaluating the Determinants of Resting Metabolic Rate in
Indian Children (Version 1). Preprint. https://doi.org/10.21203/rs.3.rs-196719/v1
Aub, J. C./Du Bois, E. F. (1917). Clinical
calorimetry: nineteenth paper the basal metabolism of old
men. Archives of Internal Medicine XIX (5_II), 823–831. https://doi.org/10.1001/archinte.1917.00080250002001
Bedale, E. M. (1923). Energy expenditure and food
requirements of children at school. Proceedings of the Royal
Society of London. Series B 94 (662), 368–404. https://doi.org/10.1098/rspb.1923.0009
Bosy-Westphal, A./Reinecke, U./Schlörke, T./Illner, K./Kutzner, D./Heller, M./Müller, M. J. (2004).
Effect of organ and tissue masses on resting energy
expenditure in underweight, normal weight and obese adults.
International Journal of Obesity 28 (1), 72–79. https://doi.org/10.1038/sj.ijo.0802526
Bosy-Westphal, A./Wolf, A./Bührens, F./Hitze, B./Czech, N./Mönig, H./Selberg, O./Settler, U./Pfeuffer,
M./Schrezenmeir, J./Krawczak, M./Müller, M. J. (2008).
Familial influences and obesity-associated metabolic risk
factors contribute to the variation in resting energy
expenditure: the Kiel Obesity Prevention Study. The American
Journal of Clinical Nutrition 87 (6), 1695–1701. https://doi.org/10.1093/ajcn/87.6.1695
Chandramohan, A./Ramakrishna, B./Venkatramani, S. (2012). Formula for calculating standard liver volume in
Indians. Indian Journal of Gastroenterology 31 (1), 15–19.
https://doi.org/10.1007/s12664-011-0152-2
Cherian, K. S./Shahkar, F./Sainoji, A./Balakrishna, N./Yagnambhatt, V. R. (2018). Resting metabolic
rate of Indian Junior Soccer players: Testing agreement
between measured versus selected predictive equations.
American Journal of Human Biology 30 (1), e23066. https://doi.org/10.1002/ajhb.23066
Chiplonkar, S./Kajale, N./Ekbote, V./Mandlik, R./Parthasarathy, L./Borade, A./Patel, P./Patel, P./Khadilkar, V./Khadilkar, A. (2017). Reference centile curves
for body fat percentage, fat-free mass, muscle mass and bone
mass measured by bioelectrical impedance in Asian Indian
children and adolescents. Indian Pediatrics 54 (12), 1005–1011.
https://doi.org/10.1007/s13312-017-1201-4
Chugani, H. T./Phelps, M. E./Mazziotta, J. C. (1987).
Positron emission tomography study of human brain functional
development. Annals of Neurology 22 (4), 487–497. https://doi.org/10.1002/ana.410220408
Corrigan, J. K./Ramachandran, D./He, Y./Palmer,
C. J./Jurczak, M. J./Chen, R./Li, B./Friedline, R. H./Kim,
J. K./Ramsey, J. J./Lantier, L./McGuinness, O. P./Mouse
Metabolic Phenotyping Center Energy Balance Working Group,
Banks, A. S. (2020). A big-data approach to understanding
metabolic rate and response to obesity in laboratory mice.
eLife 9, e53560. https://doi.org/10.7554/eLife.53560
Cunningham, J. J. (1980). A reanalysis of the factors
influencing basal metabolic rate in normal adults. The
American Journal of Clinical Nutrition 33 (11), 2372–2374.
https://doi.org/10.1093/ajcn/33.11.2372
Elia, M. (1992). Organ and tissue contribution to
metabolic rate, in: Kinney, J.M., Tucker, H.N. (Eds.),
Energy Metabolism: Tissue Determinants and Cellular
Corollaries. Raven Press, New York, pp.
61–79.
Esht, V./Midha, D./Chatterjee, S./Sharma, S. (2018). A preliminary report on physical activity patterns
among children aged 8–14 years to predict risk of
cardiovascular diseases in Malwa region of Punjab. Indian
Heart Journal 70 (6), 777–782. https://doi.org/10.1016/j.ihj.2018.01.015
FAO/WHO/UNU (2004). Human energy requirements. Report
of a Joint FAO/WHO/UNU Expert Consultation. Rome, 17–24
October 2001, FAO Food and Nutrition Technical Support
Series. Food and Agriculture Organization of the United
Nations, Rome.
FAO/WHO/UNU (1985). Energy and Protein Requirements.
Report of a Joint FAO/WHO/UNU Expert Consultation. Rome,
5–17 October 1981, World Health Organization Technical
Report Series. World Health Organization,
Geneva.
Fomon, S. J./Haschke, F./Ziegler, E. E./Nelson,
S. E. (1982). Body composition of reference children from
birth to age 10 years. The American Journal of Clinical
Nutrition 35 (5), 1169–1175. https://doi.org/10.1093/ajcn/35.5.1169
Forbes, G. B. (1987). Human Body Composition. Growth,
Aging, Nutrition, and Activity. Springer, New York.
https://doi.org/10.1007/978-1-4612-4654-1
Gallagher, D./Belmonte, D./Deurenberg, P./Wang,
Z./Krasnow, N./Pi-Sunyer, F. X./Heymsfield, S. B. (1998).
Organ-tissue mass measurement allows modeling of REE and
metabolically active tissue mass. The American Journal of
Physiology 275 (2), E249–E258. https://doi.org/10.1152/ajpendo.1998.275.2.E249
Hall, K. D./Butte, N. F./Swinburn, B. A./Chow, C. C.
(2013). Dynamics of childhood growth and obesity: development
and validation of a quantitative mathematical model. The
Lancet Diabetes & Endocrinology 1 (2), 97–105. https://doi.org/10.1016/S2213-8587(13)70051-2
Harris, J. A./Benedict, F. G. ((1918). A Biometric
Study of Human Basal Metabolism. Proceedings of the National
Academy of Sciences 4 (12), 370–373. https://doi.org/10.1073/pnas.4.12.370
Haugen, H. A./Melanson, E. L./Tran, Z. V./Kearney,
J. T./Hill, J. O. (2003). Variability of measured resting
metabolic rate. The American Journal of Clinical Nutrition
78 (6), 1141–1144. https://doi.org/10.1093/ajcn/78.6.1141
Henry, C. J. K. (2005). Basal metabolic rate studies in
humans: measurement and development of new equations. Public
Health Nutrition 8 (7a), 1133–1152. https://doi.org/10.1079/PHN2005801
Hsu, A./Heshka, S./Janumala, I./Song, M.-Y./Horlick, M./Krasnow, N./Gallagher, D. (2003). Larger mass
of high-metabolic-rate organs does not explain higher
resting energy expenditure in children. The American Journal
of Clinical Nutrition 77 (6), 1506–1511. https://doi.org/10.1093/ajcn/77.6.1506
ICRP (2009). Adult reference computational phantoms.
ICRP Publication 110. Ann. ICRP 39 (2). Available online at
https://www.icrp.org/publication.asp?id=icrp%20publication%20110
(accessed 3/13/23).
Indian Council of Medical Research (ICMR) (2010).
Nutrient Requirements and Recommended Dietary Allowances for
Indians. A Report of the Expert Group of the Indian Council
of Medical Research. National Institute of Nutrition,
Hyderabad, India.
Johnstone, A. M./Murison, S. D./Duncan, J. S./Rance,
K. A./Speakman, J. R. (2005). Factors influencing variation in
basal metabolic rate include fat-free mass, fat mass, age,
and circulating thyroxine but not sex, circulating leptin,
or triiodothyronine. The American Journal of Clinical
Nutrition 82 (5), 941–948. https://doi.org/10.1093/ajcn/82.5.941
Kajale, N./Khadilkar, A./Oza, C./Gondhalekar, K./Khadilkar, V. (2022).
Resting metabolic rate and its
association with body composition parameters in 9- to
18-year-old Indian children and adolescents. Nutrition
99–100, 111652. https://doi.org/10.1016/j.nut.2022.111652
Katch, V. L./Marks, C. C./Becque, M. D./Moorehead,
C./Rocchini, A. (1990). Basal metabolism of obese
adolescents: Evidence for energy conservation compared to
normal and lean adolescents. American Journal of Human
Biology 2 (5), 543–551. https://doi.org/10.1002/ajhb.1310020510
Khadilkar, A. V./Lohiya, N./Mistry, S./Chiplonkar,
S./Khadilkar, V./Kajale, N./Ekbote, V./Vispute, S./Mandlik, R./Prasad, H./Singh, N./Agarwal, S./Palande,
S./Ladkat, D. (2019). Random Blood Glucose Concentrations
and their Association with Body Mass Index in Indian School
Children. Indian Journal of Endocrinology and Metabolism 23 (5),
529–535. https://doi.org/10.4103/ijem.IJEM_536_19
Kleiber, M. (1932). Body size and metabolism.
Hilgardia 6 (11), 315–353. https://doi.org/10.3733/hilg.v06n11p315
Krishnan, B. T./Vareed, C. (1932). Basal Metabolism
of Young College Students, Men and Women, in Madras. Indian
Journal of Medical Research 19 (3), 831–858.
Kumar, S./Kumar, N./Sachar, R. S. (1961). Basal
metabolic rate in normal Indian adult males. Indian Journal
of Medical Research 49, 702–709.
Kyle, U. G./Bosaeus, I./De Lorenzo, A. D./Deurenberg, P./Elia, M./Gómez, J. M./Heitmann, B. L./Kent-Smith,
L./Melchior, J.-C./Pirlich, M., Scharfetter,
H./Schols, A. M. W. J./Pichard, C. (2004). Bioelectrical
impedance analysis—part II: utilization in clinical
practice. Clinical Nutrition 23 (6), 1430–1453. https://doi.org/10.1016/j.clnu.2004.09.012
Mason, E. D./Benedict, F. G. (1931). The basal
metabolism of South Indian women. Indian Journal of Medical
Research 19, 75–98.
Mason, E. D./Mundkur, V./Jacob, M. (1963). Basal
energy metabolism and heights, weights, arm skinfold and
muscle of young Indian women in Bombay, with prediction
standards for B.M.R. Indian Journal of Medical Research 51,
925–932.
McMurray, R. G./Soares, J./Caspersen, C. J./McCurdy, T. (2014).
Examining Variations of Resting Metabolic
Rate of Adults: A Public Health Perspective. Medicine &
Science in Sports & Exercise 46 (7), 1352–1358. https://doi.org/10.1249/MSS.0000000000000232
Menzel, H.-G./Clement, C./DeLuca, P. (2009).
Realistic reference phantoms: An ICRP/ICRU joint effort.
Annals of the ICRP, ICRP Publication 110: Adult Reference
Computational Phantoms 39 (2), 3–5. https://doi.org/10.1016/j.icrp.2009.09.001
Mifflin, M. D./St. Jeor, S. T./Hill, L. A./Scott,
B. J./Daugherty, S. A./Koh, Y. O. (1990). A new predictive
equation for resting energy expenditure in healthy
individuals. The American Journal of Clinical Nutrition 51 (2),
241–247. https://doi.org/10.1093/ajcn/51.2.241
Mukherjee, H. N./Gupta, P. C. (1931). The basal
metabolism of Indians (Bengalis). Indian Journal of Medical
Research 18, 807–812.
Müller, M. J./Langemann, D./Gehrke, I./Later, W./Heller,
M./Glüer, C. C./Heymsfield, S. B./Bosy-Westphal,
A. (2011). Effect of Constitution on Mass of Individual
Organs and Their Association with Metabolic Rate in Humans—A
Detailed View on Allometric Scaling. PLOS ONE 6 (7), e22732.
https://doi.org/10.1371/journal.pone.0022732
NCD Risk Factor Collaboration (2017). Worldwide
trends in body-mass index, underweight, overweight, and
obesity from 1975 to 2016: a pooled analysis of 2416
population-based measurement studies in 128.9 million
children, adolescents, and adults. The Lancet 390 (10113),
2627–2642. https://doi.org/10.1016/S0140-6736(17)32129-3
Nieman, D. C./Austin, M. D./Benezra, L./Pearce, S./McInnis,
T./Unick, J./Gross, S. J. (2006). Validation of
Cosmed’s FitMateTM in Measuring Oxygen
Consumption and Estimating Resting Metabolic Rate. Research
in Sports Medicine 14 (2), 89–96. https://doi.org/10.1080/15438620600651512
Niyogi, S. P./Patwardhan, V. N./Mordecai, J. ((1939).
Studies on Basal Metabolism in Bombay. Part I. Indian
Journal of Medical Research 27, 99–113.
Owen, O.E., Holup, J.L., D’Alessio, D.A., Craig,
E.S., Polansky, M., Smalley, K.J., Kavle, E.C., Bushman,
M.C., Owen, L.R., Mozzoli, M.A., 1987. A reappraisal of the
caloric requirements of men. The American Journal of
Clinical Nutrition 46 (6), 875–885. https://doi.org/10.1093/ajcn/46.6.875
Owen, O. E./Kavle, E./Owen, R. S./Polansky, M./Caprio,
S./Mozzoli, M. A./Kendrick, Z. V./Bushman, M.C./Boden,
G. (1986). A reappraisal of caloric requirements in
healthy women. The American Journal of Clinical Nutrition
44 (1), 1–19. https://doi.org/10.1093/ajcn/44.1.1
Patil, S. R./Bharadwaj, J. (2013). Development of new
equations for basal metabolic rate for adolescent student
Indian population. Journal of Postgraduate Medicine 59 (1),
25–29. https://doi.org/10.4103/0022-3859.109491
Poehlman, E. T./Toth, M. J. (1995). Mathematical
ratios lead to spurious conclusions regarding age- and
sex-related differences in resting metabolic rate. The
American Journal of Clinical Nutrition 61 (3), 482–485.
https://doi.org/10.1093/ajcn/61.3.482
Psota, T./Chen, K. Y. (2013). Measuring energy
expenditure in clinical populations: rewards and challenges.
European Journal of Clinical Nutrition 67 (5), 436–442.
https://doi.org/10.1038/ejcn.2013.38
Purcell, S. A./Johnson-Stoklossa, C./Tibaes,
J. R. B./Frankish, A./Elliott, S. A./Padwal, R./Prado,
C. M. (2020). Accuracy and reliability of a portable indirect
calorimeter compared to whole-body indirect calorimetry for
measuring resting energy expenditure. Clinical Nutrition
ESPEN 39, 67–73. https://doi.org/10.1016/j.clnesp.2020.07.017
R Core Team (2019). The R Project for Statistical
Computing. Available online at https://www.r-project.org/ (accessed
12/2/22).
Rahman, S. A. (1936). The basal metabolism of young
men at Hyderabad (Deccan) with a study of their physical
characters. Indian Journal of Medical Research 24,
173–199.
Rahmandad, H. (2014). Human Growth and Body Weight
Dynamics: An Integrative Systems Model. PLOS ONE 9, e114609.
https://doi.org/10.1371/journal.pone.0114609
Rajagopal, K. (1938). The Basal Metabolism of Indian
and European Men on the Nilgiri Hills (S. India). Indian
Journal of Medical Research 26, 411–426.
Reneau, J./Obi, B./Moosreiner, A./Kidambi, S.
(2019). Do we need race-specific resting metabolic rate
prediction equations? Nutrition & Diabetes 9, 21.
https://doi.org/10.1038/s41387-019-0087-8
Schofield, W. N. (1985). Predicting basal metabolic
rate, new standards and review of previous work. Human
Nutrition. Clinical Nutrition 39c (Suppl. 1), 5–41.
Shirley, M. K./Arthurs, O. J./Seunarine, K. K./Cole,
T. J./Eaton, S./Williams, J. E./Clark, C. A./Wells, J. C. K.
(2019). Metabolic rate of major organs and tissues in young
adult South Asian women. European Journal of Clinical
Nutrition 73 (8), 1164–1171. https://doi.org/10.1038/s41430-018-0362-0
Snyder, W./Cook, M./Nasset, E./Karhausen, L./Howells,
G./Tipton, I. (1975). Report of the Task Group on
Reference Man, ICRP Publication. Pergamon Press,
Oxford.
Soares, M. J./Piers, L. S./O’Dea, K./Shetty, P. S.
(1998). No evidence for an ethnic influence on basal
metabolism: an examination of data from India and Australia.
British Journal of Nutrition 79 (4), 333–341. https://doi.org/10.1079/BJN19980057
Srivastava, R./Batra, A./Dhawan, D./Bakhshi, S.
(2017). Association of energy intake and expenditure with
obesity: A cross-sectional study of 150 pediatric patients
following treatment for leukemia. Pediatric Hematology and
Oncology 34 (1), 29–35. https://doi.org/10.1080/08880018.2016.1272025
Swaminathan, S./Thomas, T./Yusuf, S./Vaz, M.
(2013). Clustering of diet, physical activity and overweight
in parents and offspring in South India. European Journal of Clinical Nutrition 67 (2),
128–34. https://doi.org/10.1038/ejcn.2012.192
Swinburn, B. A./Jolley, D./Kremer, P. J./Salbe,
A. D./Ravussin, E. (2006). Estimating the effects of energy
imbalance on changes in body weight in children. The
American Journal of Clinical Nutrition 83 (4), 859–863.
https://doi.org/10.1093/ajcn/83.4.859
Talbot, F.B., 1938. Basal metabolism standards for
childern. American Journal of Diseases of Children 55 (3),
455–459. https://doi.org/10.1001/archpedi.1938.01980090003001
The MathWorks Inc. (2019). MATLAB version: 9.7.0
(R2019b), Natick, Massachusetts. Available online at
https://in.mathworks.com/ (accessed
11/30/22).
Tschöp, M. H./Speakman, J. R./Arch, J. R. S./Auwerx,
J./Brüning, J. C./Chan, L./Eckel, R. H./Farese, R. V./Galgani,
J. E./Hambly, C./Herman, M. A./Horvath, T. L./Kahn,
B. B./Kozma, S. C./Maratos-Flier, E./Müller, T. D./Münzberg,
H./Pfluger, P. T./Plum, L./Reitman, M. L./Rahmouni,
K./Shulman, G. I./Thomas, G./Kahn, C. R./Ravussin,
E. (2012). A guide to analysis of mouse energy
metabolism. Nature Methods 9 (1), 57–63. https://doi.org/10.1038/nmeth.1806
Vandarakis, D./Salacinski, A. J./Broeder, C. E.
(2013). A Comparison of Cosmed Metabolic Systems for the
Determination of Resting Metabolic Rate. Research in Sports
Medicine 21 (2), 187–194. https://doi.org/10.1080/15438627.2012.757226
Wang, Z. (2012). High ratio of resting energy
expenditure to body mass in childhood and adolescence: A
mechanistic model. American Journal of Human Biology 24 (4),
460–467. https://doi.org/10.1002/ajhb.22246
Wang, Z./Heshka, S./Heymsfield, S. B./Shen, W./Gallagher,
D. (2005). A cellular-level approach to predicting
resting energy expenditure across the adult years. The
American Journal of Clinical Nutrition 81 (4), 799–806.
https://doi.org/10.1093/ajcn/81.4.799
Wang, Z./Heshka, S./Zhang, K./Boozer, C. N./Heymsfield,
S. B. (2001). Resting Energy Expenditure:
Systematic Organization and Critique of Prediction Methods.
Obesity Research 9 (5), 331–336. https://doi.org/10.1038/oby.2001.42
Wang, Z./Ying, Z./Bosy-Westphal, A./Zhang, J./Schautz,
B./Later, W./Heymsfield, S. B./Müller, M. J.
(2010). Specific metabolic rates of major organs and tissues
across adulthood: evaluation by mechanistic model of resting
energy expenditure. The American Journal of Clinical
Nutrition 92 (6), 1369–1377. https://doi.org/10.3945/ajcn.2010.29885
Weir, J. B. de V. (1949). New methods for calculating
metabolic rate with special reference to protein metabolism.
The Journal of Physiology 109 (1-2), 1–9. https://doi.org/10.1113/jphysiol.1949.sp004363
WHO (2020). The double burden of malnutrition: policy
brief. Available online at https://apps.who.int/iris/handle/10665/255413
(accessed 3/9/20).
Wlodek, M. E./Westcott, K./Siebel, A. L./Owens,
J. A./Moritz, K. M. (2008). Growth restriction before or after
birth reduces nephron number and increases blood pressure in
male rats. Kidney International 74 (2), 187–195. https://doi.org/10.1038/ki.2008.153