Westernization of Self-Perception in Modern Affluent Indonesian School
Children
Sonja Boeker ✉
✉
Institute of Biology and Biochemistry, Human Biology, University of Potsdam,
Am Neuen Palais 10, 14467 Potsdam, Germany
Michael Hermanussen
Christiane Scheffler
Institute of Biology and Biochemistry, Human Biology, University of Potsdam,
Am Neuen Palais 10, 14467 Potsdam, Germany
DOI: https://doi.org/10.52905/hbph.v1.4
Abstract
Background
Subjective Social Status is used as an important predictor for psychological and
physiological findings, most commonly measured with the MacArthur Scale (Ladder Test).
Previous studies have shown that this test fits better in Western cultures. The idea of
a social ladder itself and ranking oneself “higher” or “lower” is a concept that accords
to the Western thinking.
Objectives
We hypothesize that in a culture where only the elites have adapted to a Western
lifestyle, the test results reflect a higher level of accuracy for this stratum. We also
expect that self-perception differs per sex.
Sample and Methods
We implemented the Ladder Test in a study of Indonesian schoolchildren aged between 5
and 13 years (boys N = 369, girls N= 364) from non-private and private schools in Kupang
in 2020.
Results
Our analysis showed that the Ladder Test results were according to the Western
expectations only for the private school, as the Ladder Scores significantly decreased
with age (LM: p = 0.04). The Ladder Test results are best explained by
“Education Father” for the non-private school pupils (p = 0.01) and all
boys (p = 0.04), by “School Grades” for the private school cohort
(p = 0.06) and by “Household Score” for girls (p
=0.09).
Conclusion
This finding indicates that the concept of ranking oneself “high” or “low” on a social
ladder is strongly implicated with Western ideas. A ladder implies social movement by
“climbing” up or down. According to that, reflection of self-perception is influenced by
culture.
Keywords: self-perception, social status, Westernization, cultural dependence
Conflict of Interest: There are no
conflicts of interest.
Citation: Boeker, S,Hermanussen, M,Scheffler, C, (2021), Westernization of Self-Perception in Modern Affluent Indonesian School
Children, Human Biology and Public Health 1. https://doi.org/10.52905/hbph.v1.4.
Copyright: This is an open access article distributed under the terms of the Creative Commons Attribution License which permits unrestricted use, distribution, and reproduction in any medium, provided the original author and source are credited.
Received: 09-10-2020 | Accepted: 26-11-2020 | Published: 22-06-2021
Take home message for students
Most Indonesian children lack a Western concept of social positioning and in perceiving their social position as “high” or “low” among their peers. This is different in affluent children. With increasing age, they become capable of ranking their position within the social hierarchy, and to recognize life as a career.
Contents
Introduction
Self-perception and social identity is that aspect of an individual's self-concept that is
derived from perceived membership in a relevant social group, group identification and
identity signaling, and shapes common goals and social norms (Tajfel, H., Turner, J. C. 1986; Smaldino 2019).
The Western culture, that arose in Europe from Judaism (homo aequalis) to Christianity to
the Enlightenment, is perhaps best characterized by the concept of individualism. Liberty
and equality are in place to ensure that, ideally, only the individual’s effort and
education determines what (social rank) one can achieve in life, rather than marital status,
external social pressure, or any kind of religious restrictions and regulations (Lal 2000). This creates a social dynamic in which all
social positions are interconnected. Since these positions are traditionally ordered in a
vertical hierarchy, individuals perceive their status in a group or in society as “high” or
“low” (Hoebel et al. 2015). A social ladder is
commonly used to illustrate such Western social dynamics, as one can actively “climb” up or
down due to one’s actions but also personality traits (shy, dominant) (Massey et al. 2015).
The question we want to answer in this study is whether children raised in a social
environment that greatly differs from European and Western norms and cultural concepts are
able to perceive their social status in terms of “high” and “low”, or “up” and “down”, and
to express this self-perception on a rank scale visualized by a wooden ladder.
To address this question, we used the MacArthur Scale of Subjective Social Status (SSS). In
this simple test an individual is asked to rank himself/herself by marking that rung on a
picture of a ladder, in which the highest rung is considered “best of” and the lowest is
considered “worst of” reflecting his/her own position within a specific society (Adler and Stewart 2007). This method has been
successfully used in medical research to predict the risk of human disease and has been
shown to be more accurate for this task than the objective socioeconomic status (SES) (Adler et al. 2000), which is generally measured with the
variables “education”, “occupation” and “income” (Kumar
et al. 2012). It is assumed that the feeling of being treated unfairly or of having
fewer opportunities for social participation and realization compared to others, is likely
to influence the perception and evaluation of one's own social status (Hoebel et al. 2013; Jackman and
Jackman 1973). Associated worries about the future and status fears could trigger
psycho-social stress and thus lead to a higher vulnerability to diseases (Adler et al. 2000).
Despite its simplicity the accuracy of this test depends on the participants’ cultural
background. Studies carried out in Brazil or Indonesia, for example, showed inconsistencies
in their results that were difficult to interpret in relation to objective social status or
health risk (de Almeida Ferreira et al. 2018; Nobles et al. 2013). The authors considered various
aspects as possible explanations for the deviations in perceived social status for some
social groups, ranging from poor education and thus a lack of proper understanding the task,
to having different concepts of social status. This alludes to a characteristic problem of
such tests that are almost exclusively conducted in and adapted to Western, educated,
industrialized, rich and democratic (WEIRD) societies, yet are claimed to be representative
for all societies (Henrich et al. 2010).
In a study conducted by Amir et al. (2019), in which Western and non-Western societies were
compared, a tendency was shown that the less a population resembled a WIERD society, the
less the MacArthur test results followed the expected pattern. Also a test’s
sensitivity to different ethnic groups within one society has been revealed, as in American
studies the test appeared to work best for White and Chinese Americans (Ostrove et al. 2000) and less well for Latino and
African Americans (Ostrove et al. 2000; Allen et al. 2014). This further indicates a certain
bias in the test, which apparently applies to specific types of people only.
Self-ranking by MacArthur Scale appears higher in younger pupils and declines
with age until it stabilizes in older teenage years. Goodman et al. (2001) suggest that the
perception of social stratification matures with age, as more developed abstract thinking
enables a reliable assessment of social position. This age-dependent pattern, which Goodman
found in adolescents, was also confirmed by Amir
et al. (2019) for younger participants
(aged between 4 and 18 years).
The presented study was carried out in Kupang, (West-Timor) Indonesia. The MacArthur Scale
(referred to as the Ladder Test) was implemented in an anthropometric examination of
schoolchildren, aged 5 to 13 years (see Table 1), derived from different social backgrounds
as reflected by the status of the attended school (private school, middle class school,
school for people living in poverty). In order to improve our approach with these children,
we slightly altered the original MacArthur Scale test version in cooperation with local
pediatricians. The social situation on the individual level was assessed by using the
variables of parents’ education, school grades and the presence of basic home equipment.
To reveal the general influence of social class and age towards the test’s functionality,
the following two hypotheses were tested:
1. If the social background influences a child’s
self-perception, the Ladder Test results should differ between
schools.
2. With increasing age a child’s self-perception of its
social position in society should change towards a rank that reflects its family’s objective
social status more realistically.
Additionally, we took into account that Indonesia is generally a patriarchal society with
different demands on the sexes (Kollo and Sunarso
2018; Wulan and Bajari 2021). Even though
positive developments are in progress; for instance, Indonesia has the highest literacy rate
in Asia (females 93.59%, males 97.17%) and investments are directed to reduce maternal
mortality, women still face structural and cultural inequality. Discriminatory laws on taxes
and inheritance are still in place and so are legal barriers in the economy
(https://data.em2030.org/countries/indonesia/). The 2016 Women’s Health and Life Experiences
Survey found that one in three women reportedly experienced sexual violence, often with
little to no legal consequences for the offenders. This patriarchal structure seems to be
religiously independent. The majority of Indonesia is Muslim. In our study location Kupang
(West-Timor) 81% are Christians (Hutagalung 2016).
Generally, monotheistic religions have been brought to Indonesia by various rulers
throughout history, and traditional animism and beliefs in magic and witchcraft remain
strong (Farram 2002).
The inequality women experience in society are based on cultural constructs of gender, not
on factual differences in biological sex. Since gender is a broad and complex topic, we have
only assessed biological sex and will use it throughout the study as a representative of
gender.
With the following hypotheses, we examine whether these gender-related unequal conditions
that the children are exposed to influence their self-perception.
3. Self-perception of social position differs between boys and girls.
4. Self-perception of boys and girls are influenced by different social variables.
To test this hypothesis we used the attended schools and the social variables which were
evaluated during the study as markers for the social background.
Sample and Method
Sample
In Kupang, Indonesia, three different types of schools were visited, a private school for
children from affluent social backgrounds, (referred to as School 1), two state schools
(put together as School 2) and a rather dilapidated school for very poor children (School
3). In total 723 children between 5 and 13 years of age participated in the study (mean
age 9.05 ± 1.62), 369 boys and 364 girls (Table
1). For tests, in which age was relevant, 5 and 13 year old age groups were
eliminated because of their low number.
Table 1 Number of Indonesian children (boys and girls) by age and school
|
School 1 |
School 2 |
School 3 |
| Age |
Boys |
Girls |
Boys |
Girls |
Boys |
Girls |
| 5 |
0 |
0 |
1 |
0 |
0 |
0 |
| 6 |
10 |
8 |
14 |
9 |
5 |
2 |
| 7 |
12 |
18 |
31 |
29 |
6 |
7 |
| 8 |
12 |
9 |
38 |
49 |
13 |
4 |
| 9 |
26 |
22 |
37 |
52 |
3 |
7 |
| 10 |
26 |
23 |
39 |
43 |
6 |
6 |
| 11 |
14 |
12 |
47 |
37 |
6 |
4 |
| 12 |
4 |
0 |
12 |
10 |
4 |
2 |
| 13 |
0 |
0 |
3 |
1 |
0 |
0 |
| Totals |
104 |
92 |
222 |
230 |
43 |
32 |
| Overall |
723 |
|
|
|
|
|
The social situation on the individual level is represented by the variables education of
mother and father, school grades of the child (“education”) and the access at home to
water, TV and a fridge (“income”).
The education level of the parents was categorized in the approximate years of attending
an educational facility, ranging from 1 (no school) to 18 (PhD degree). Access to water
was ranked from the least favorable condition 1 (getting water from a lake or river) to
the most optimal condition 5 (having running water at home). The presence or absence of a
TV and a fridge at home was noted as 0 (absent) and 1 (present). These three equipment
factors (water, TV, fridge) were later summed up in a “Household Score” which ranked from
1 (least favorable access to water, absence of TV and Fridge:1 + 0 + 0 = 1) to 7 (optimal
water access, presents of TV and fridge: 5 + 1 + 1 = 7).
The school grades of each child were asked for the subject “math” and “language” and were
given in percentage (0-100%). The mean of the two grades were calculated and used in the
later analysis.
Lastly, each pupil was asked to rank themselves on an eight-level toy ladder. The highest
rung (8) was stated to be presidential-like for the reason that the Indonesian president
is a familiar figure to each child. Two steps below was associated with the social rank of
a medical doctor. Although, all other ladder steps were left without any particular
symbolic figure, it was clear, that the lowest rung represented the weakest and poorest in
society. Note, the original MacArthur Scale is predicated on a ten level-ladder scale in
which the highest rung is considered “best of” and the lowest rung “worse of”. Since more
specific associations per rung are left open to the research setting, the reduction of two
steps, and the usage of a toy ladder instead of an illustration, are the only deviations
that were made to the MacArthur Scale in this study.
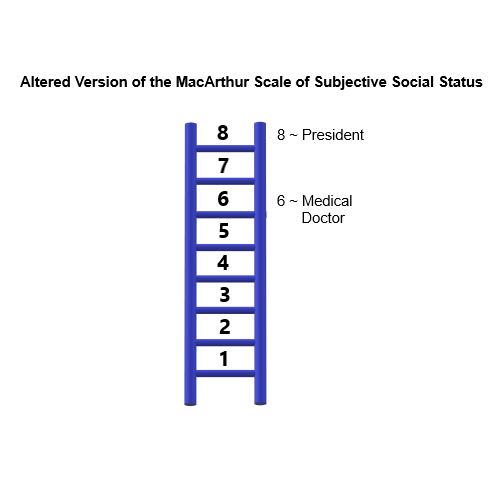
Figure 1 This picture of an eight-level ladder illustrates a wooden toy ladder that was
used to assess students’ self-perception within the society. Via putting their finger
on it the students were asked where they see themselves most represented on the
ladder, with level 8 regarded as the most powerful (presidential like), level 6 as a
respected citizen (medical doctor) and each step below as persons of decreasing
importance and power.
The questions and the Ladder Test were performed by local-language speaking physicians
and pediatricians in the presence of the children’s teachers. Parental informed consent
was given. Anonymity was maintained throughout the study. Ethical approval was provided by
the Medical and Health Research Ethics Committee, Faculty of Medicine, Gadjah Mada
University, Yogyakarta, Ref. no. KE/FK/1140/EC/2019.
Statistics
For the analysis the program R-Studio was used with R 4.0.2 as running system.
As the Ladder Test consists of discrete numbers (1-8) and the results did not follow a
normal distribution for school, sex or age (Shapiro-Wilk Test), we used non-parametric
tests to assess whether the outcomes of the SSS differed between cohorts. In order to
compare the two groups (per sex, private vs. non-private school) the Mann-Whitney U Test
was performed. Additionally, the Kruskal Wallice Test was conducted in order to compare
more than two groups (per school, per age in complete years). The critical p-value was set
at 0.05.
Additionally we used a linear model to identify a potential relationship between age and
the Ladder Test results for the whole data set and per school. Due to the similar trend in
schools 2 and 3 and the low student numbers in School 3, these two schools were
categorized as “non-private school”, in contrast to the “private school” - School 1.
Using the “step” function of the multiple linear model, we tested whether and which
variables of the social components were suitable to explain the results of the Ladder
Test. The input for the model was “Education Mother”, “Education Father”, “Grades”,
“Household Score”, “Age in Completed Years”, “School” and “Sex”. With the settings on
“backwards” this function generates different multiple linear models by step-wise taking
out variables. The final output is the model with a combination of variables that achieve
the lowest AIC value. With this approach our goal was to examine a general, possibly
subtle trend. For this reason, the critical p-value of a variable's contribution to the
model was set at 0.1 instead of 0.05. A step-wise generation of multiple linear models was
performed for the data set as a whole as well as for the private and non-private schools
and for boys and girls separately.
Results
Per school
For School 1, the most frequently chosen level on the MacArthur Scale was rung 5 at
27.6%. Twenty nine point 9 percent and and 28.0% of pupils from Schools 2 and 3 frequently
ranked themselves at level 7 and 8 respectively, indicating an exaggerated
self-perception. The distribution of each school is shifted to the high levels of the
Ladder Score (Figure 2). The median was 6 for
School 1 and 3 and 7 for School 2. The means of the different schools showed no
significant differences when analyzed with the Kruskal-Wallis Test.
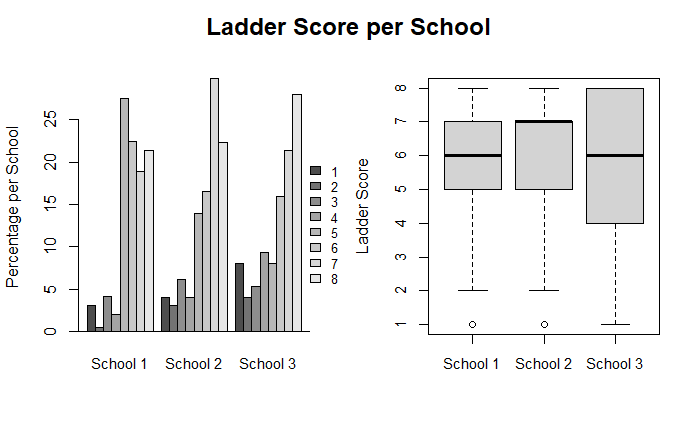
Figure 2 Distribution of the Ladder Score results per school (Kupang, West-Timor,
Indonesia). The Kruskal-Wallis Test shows no significant difference between the means:
χ² = 1.25, df = 2, p = 0.53
(School 1 = private school, School 2 and 3 = non-private schools).
Per age
The age groups 5 and 13 years were omitted due to low numbers (Table 1). The median rung for all ages ranged between 6 and 7 years.
No significant difference was found between the results of any age group (Figure 3). A linear relationship between age and Ladder
Score results for the whole group could not be found.
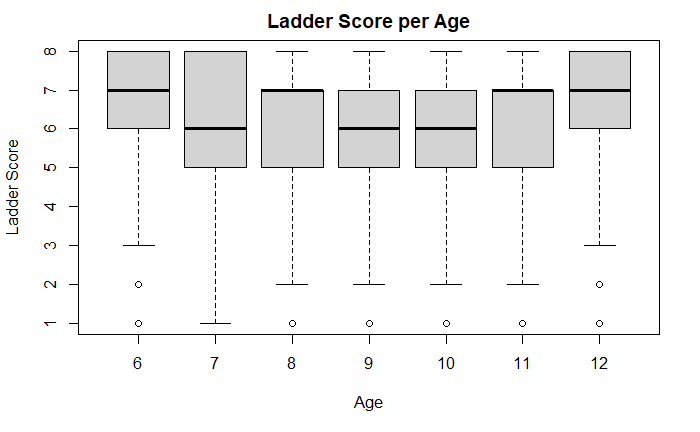
Figure 3 Box-plots of the distribution of the Ladder Score results per age in complete
years for all children (Kupang, West-Timor, Indonesia). The median ranges between 6
and 7. The Kruskal-Wallis Test shows no significant difference in means between the
age groups: χ² = 10.222, df = 8, p = 0.2498.
Per age and social class
To further evaluate the relationship between age and Ladder Score results, we divided the
data by private (School 1) and non-private schools (School 2 and 3). For the private
school a significant linear relationship was found, as with increasing age the Ladder
Score ranking tended towards the lower levels, i.e. from the imperious self-perception “I
am the greatest” to a view that we would consider more realistic in terms of social
position within Indonesian society. For the non-private schools such a relationship was
not found (Figure 4).
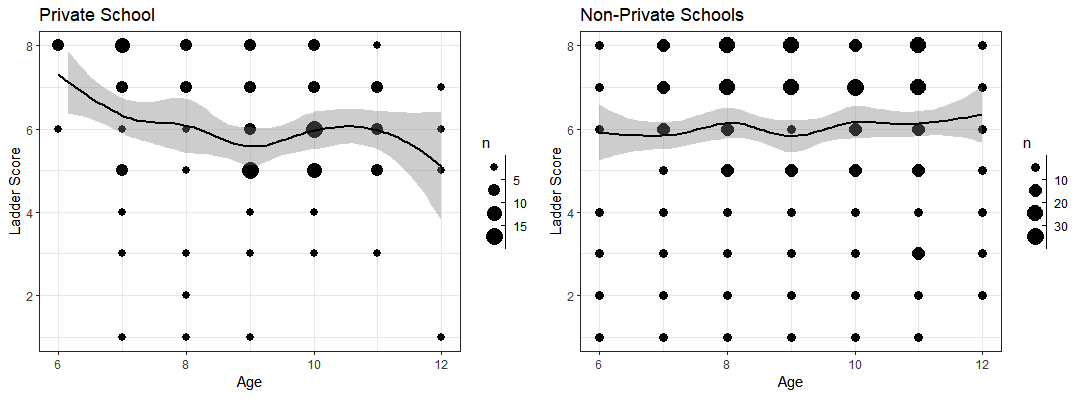
Figure 4 Linear relationship between age and Ladder Score for private and non-private
schools (Kupang, West-Timor, Indonesia). Private School: intercept = 7.4, slope = -
0.156, p-value = 0.0398 *, Non-Private School: intercept = 8.87, slope = 0.0375,
p-value = 0.314.
Per sex
When assessing the data according to sex, the distribution was shifted towards the higher
Ladder Scores for boys as well as for girls (Figure
5). In both groups the second-best level 7 was most often chosen, with 28.8% for
girls and 23.3% for the boys. The median for the girls was 7, and for the boys it was 6.
However, conducting the Mann-Whitney U Test showed that the mean did not significantly
differ between the sexes.
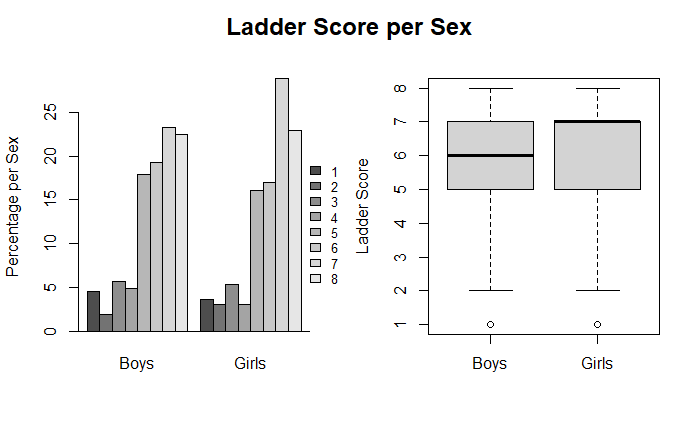
Figure 5 Ladder Score distribution per sex of schoolchildren (Kupang, West-Timor,
Indonesia). The Mann-Whitney U Test shows no significant differences in means between
the groups (W = 0.624, p = 0.29).
Linear model
Using the step-wise function for the multiple linear model to explain the Ladder Test
outcome for the whole data set, the variables “School”, “Sex” and “Age in Completed Years”
were discarded, leaving “Education Mother”, “Education Father”, “Grades” and “Household
Score”. As we set the threshold of significance at a p-value of 0.1, all variables but
“Grades” had a significant influence to the model (Table
2).
When separating the data by sex, the boys’ Ladder Score was best explained with the
variable “Education Father” (p = 0.01). For the girls only “Household
Score” had a significant contribution to the model (p = 0.09).
We also divided the data in terms of private and non-private schools. “Education Father”
explained the Ladder Test outcome for the non-private pupils significantly
(p = 0.04), for the private school children, the variable “School
Grades” shaped the Ladder Test results the most (p = 0.06).
In the plots shown in Figure 6, we can see the
significant relationships per school cohort graphically.
Table 2 Output values of the Multiple Linear Models per cohort from children in Kupang
(West-Timor, Indonesia) with the variables that explain the variance of the Ladder
Test outcome the best (generated via a Step-wise Regression, a
p-value of 0.1 was considered as significant, significant codes: 0.00
= ***, 0.01 = *, 0.05 = .).
| Groups |
Estimate |
Std. Error |
t value |
p value |
| Overall |
|
|
|
|
|
(Intercept) |
4.23 |
0.68 |
6.2 |
0.00 *** |
|
Edu. Mother |
-0.06 |
0.03 |
-1.88 |
0.06. |
|
Edu. Father |
0.06 |
0.03 |
1.8 |
0.07. |
|
Grades |
0.01 |
0.01 |
1.48 |
0.14 |
|
Household-Score |
0.17 |
0.08 |
2.15 |
0.03 * |
|
R² |
0.02 |
|
|
|
|
R² adj. |
0.01 |
|
|
|
| Private School |
|
|
|
|
|
(intercept) |
5.10 |
0.90 |
5.66 |
0.00 *** |
|
Edu. Mother |
-0.07 |
0.04 |
-1.61 |
0.11 |
|
Grades |
0.02 |
0.01 |
1.91 |
0.06. |
|
R² |
0.03 |
|
|
|
|
R² adj. |
0.02 |
|
|
|
| Non-private
School |
|
|
|
|
|
(intercept) |
4.54 |
0.51 |
8.88 |
0.00 *** |
|
Edu. Father |
0.07 |
0.03 |
2.07 |
0.04 * |
|
Household-Score |
0.13 |
0.09 |
1.56 |
0.12 |
|
R² |
0.02 |
|
|
|
|
R² adj. |
0.02 |
|
|
|
| Boys |
|
|
|
|
|
(Intercept) |
4.95 |
0.39 |
12.82 |
0.00 *** |
|
Edu. Father |
0.09 |
0.03 |
2.65 |
0.01 * |
|
R² |
0.02 |
|
|
|
|
R² adj. |
0.02 |
|
|
|
| Girls |
|
|
|
|
|
(Intercept) |
4.12 |
1.08 |
3.81 |
0.00 *** |
|
Edu. Mother |
-0.05 |
0.04 |
-1.46 |
0.15 |
|
Grades |
0.02 |
0.01 |
1.56 |
0.12 |
|
Household-Score |
0.19 |
0.11 |
1.72 |
0.09. |
|
R² |
0.02 |
|
|
|
|
R² adj. |
0.01 |
|
|
|
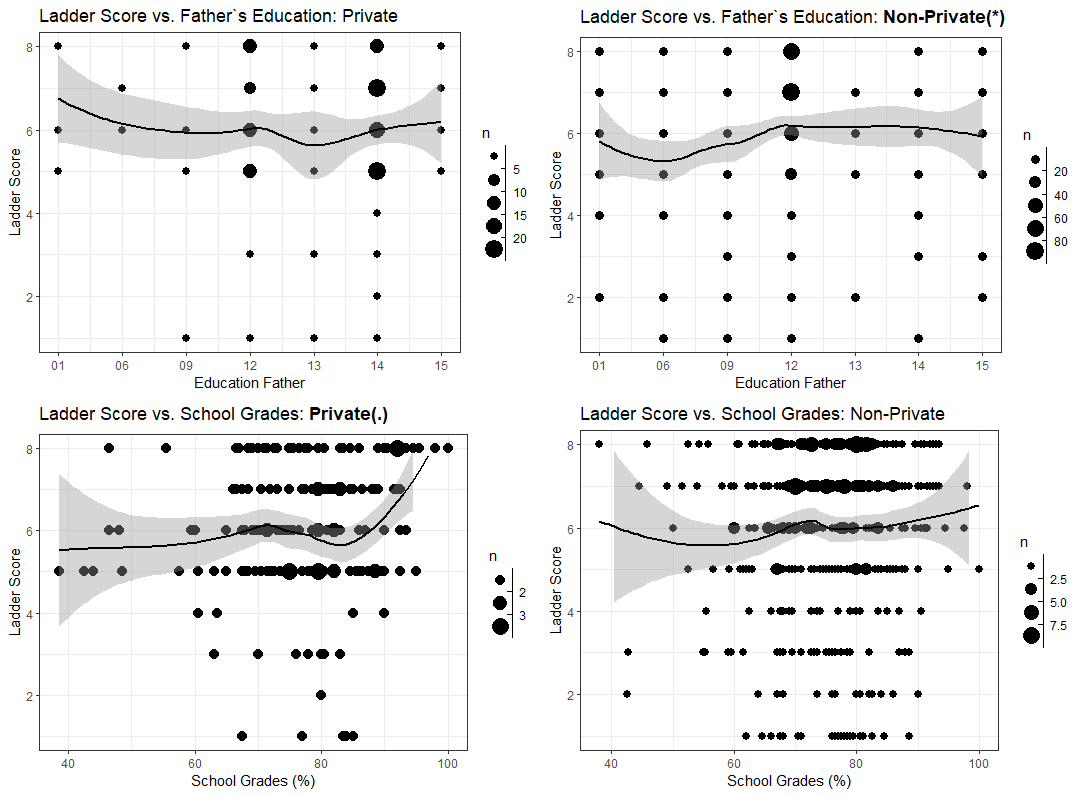
Figure 6 Linear relationship between the social variables and the Ladder Score for
private and non-private peers (Kupang, West-Timor, Indonesia). Note: If the variable
is part of the multiple linear model output (using step-wise regression), the
concerned cohort is printed in bold. If there is a significant relationship according
to that model, this is also added to the title (significant codes: 0.01 = *, 0.05 =
.).
Discussion
In this paper, we examined to what extent the social backgrounds of Indonesian children
influenced their self-perception. We used Ladder Test results in order to highlight the
differences in self-perception in relation to the kind of schools they attend.
The MacArthur Scale of Subjective Social Status (Ladder Test) has been shown to be a
suitable instrument to assess the relationship between children’s self-perception and status
in society. We primarily assumed that if children were able to correctly assign their social
status position in society, children living in poverty would rank themselves lower than
children living in an affluent environment did.
Thus, we expected differences in the self-perception between private school children and
children attending state schools (hypothesis 1).
Regardless of the social background, we generally observed a broad overestimation of
children's perception of their social position.
The Ladder Test results indicated that approximately 50% of children from non-private
schools and 40% of children from private schools regarded themselves to be in a higher
social position than a medical doctor, with approximately half of them perceiving themselves
to be on the same level as the Indonesian president.
They ranked themselves as “the greatest”. This concurs with previous findings, in that
younger children rank themselves high on the MacArthur Scale (Goodman et al. 2001; Amir et al.
2019). Yet, in contrast with our second hypothesis: “With increasing age a child’s
self-perception of its social position in society should change towards a rank that reflects
its family’s objective social status more realistically”, there was no decline in ranking
with increasing age when evaluating the entire group. Only when assessing the data
separately for each school that we found the decline in ranking solely in older children
from private schools. Children attending non-private schools continued ranking themselves at
a high level at all ages (Figure 4).
To sum up we found that Indonesian children attending upper class private schools ranked
their position in society in a more moderate, and therefore, more realistic manner than
other school participants. Only the responses of the private school pupils were
age-dependent. In other words, the MacArthur Scale of Subjective Social Status worked as
expected only for Indonesian children from a high social class.
Within the last two decades, globalization has led to the trend for Indonesian elites and
upper class families to “Westernize” and adapt to an “international” lifestyle (Tanu 2014). Our findings suggest that results obtained
by the MacArthur test will be more reliable the more a tested cohort resembles a Western
(WIERD) society (Amir et al. 2019; Henrich et al. 2010). The private school pupils seemed
to be better adapted to the Western culture and therefore the Ladder Test is more suited for
them than for their non-private school peers.
Being able to judge one’s position in society using the symbolic figure of a ladder, is an
artifact of Western culture. For people socialized in a Western way, symbols such as a
ladder, or a staircase are familiar pictures to visualize the hierarchical structure of
society. Individualism is the key aspect here: all of these pictured structures are meant to
be “climbed”, or actively moved on, and depending on the individual’s effort and/or starting
position one will end up on a level in society considered “high” or “low”. In contrast,
painting a feudal society as a ladder would be rather ridiculous, as social classes are
predestined by birth with no intention for an individual of moving up or down. A ladder or
any corresponding image thus is unable to appropriately illustrate such a society.
Presumably, the children from non-private schools neither have a concept of a hierarchic
ladder nor do they grasp the idea of placing themselves “higher” or “lower” in relation to
the social status of others.
In an Indonesian Family Life Survey, that was conducted in the years 1997, 2000 and 2007,
the SSS was assessed for adults using a version of the Ladder Test. With great computational
efforts and various assumptions, attempts were made to align the self-ranking to health risk
with no significant outcome (Nobles et al. 2013).
Powdthavee (2007) used the same data set to examine what influences the sensation of feeling
“richer” or “poorer” than others in Indonesia. He concluded that the degree of collectivism
leads to the distortion of self-ranking: The poor tended to rank themselves higher, the rich
tended to rank themselves lower. Saraswati (2003) states in his dissertation that Western
individualism has a negative connotation for traditional Indonesians. These findings further
support our assumption, that the concept of Western individualism is a prerequisite embedded
in the MacArthur Scale, making it unsuitable for non-Western cultures.
Nevertheless, in the multiple linear model we found explanatory variables that seem to
reflect cultural influences for all tested cohorts.
Self-perception according to “School Grades” offers an interesting explanation for the
responses of the private school pupils. This aligns with Western ideology as it strongly
emphasizes the individual and his*her own responsibility for accruing social status and
prestige.
In contrast, the non-private school group seems to have been significantly influenced by
the variable “Education Father”. Indonesia is a patriarchal society. Hence, children’s
responses to the Ladder Score appeared to depend on structural norms in which the father is
considered the “breadwinner” and head of the household (Sathiparsad et al. 2008).
The distribution of the global self-rating of boys and girls did not differ significantly.
Thus, we rejected hypothesis 3: “The self-perception of social position differs between boys
and girls”. However, even though the distribution was similar, we found that the results per
sex were influenced by different social variables. That in turn fits to our last hypothesis:
“Self-perception of boys and girls are influenced by different social variables”. The
self-perception of boys significantly correlated with “Education Father”. For girls,
domestic wealth (represented by “Household Score”) was the variable that influenced
self-perception the most.
Boys apparently orient more towards the dominant father figure, as they are expected to be
the future household heads, reflecting enduring patriarchal structures in modern Indonesia.
Girls being far less independent, appear to rely on external financial security provided by
someone else (family, husband). Even though Indonesia is changing laws to ensure women’s
equality, the unemployment rate is disproportionally high for females (Equal Measures 2030), indicating that women are often seen as
subordinate and are expected to be home carers and mothers (Sathiparsad et al. 2008).
The present findings suggest to modify the notion that measuring self-perception of one's
social position using the Ladder Test is not suitable for non-Western societies. Our
analysis showed that children’s responses do differ from Western concepts of the social
structure. Western cultures tend to describe social positions in terms of “high” and “low”,
or “up” and “down”, often visualizing such constructions by a ladder. People are able to
rank themselves within a vertical hierarchical model. This appears to be different in
non-Western societies. These people appear to have difficulties ranking themselves on a
vertical scale. They may rank themselves as “great” and “strong”. This perception reflects
their personal self-appraisal, but it does not describe their social position as “high” or
“low” within a vertically structured concept.
In conclusion, the present study shows that Indonesian children from non-private schools
lack a Western concept of social positioning and fail to self-perceive their social position
as either “high” or “low” among their peers. This is different in children from affluent
backgrounds attending private schools. With increasing age, private school children
increasingly rank their position within the social hierarchy, and appear to recognize life
in terms of career and social opportunities based on success in school.
References
Adler, N. E./Epel, E. S./Castellazzo, G./Ickovics,
J. R. (2000). Relationship of subjective and objective social status with psychological
and physiological functioning: Preliminary data in healthy white women. Health
Psychology : Official Journal of the Division of Health Psychology, American
Psychological Association 19 (6), 586–592. https://doi.org/10.1037//0278-6133.19.6.586.
Adler, N./Stewart, J. (2007). The MacArthur scale
of subjective social status. University of Califonia.
Allen, A. J./McNeely, J. M./Waldstein, S.
R./Evans, M. K./Zonderman, A. B. (2014). Subjective Socioeconomic Status Predicts
Framingham Cardiovascular Disease Risk for Whites, not Blacks. Ethnicity and Disease
(24), 150–154.
Amir, D./Valeggia, C./Srinivasan, M./Sugiyama, L.
S./Dunham, Y. (2019). Measuring subjective social status in children of diverse
societies. PloS One 14 (12), e0226550. https://doi.org/10.1371/journal.pone.0226550.
de Almeida Ferreira, W./Giatti, L./Carvalho de
Figueiredo, R./Ribeiro de Mello, H./Barreto, S. M. (2018). Validade concorrente e de
face da escala de MacArthur para avaliação do status social subjetivo: estudo
longitudinal de Saúde do adulto (ELSA-Brasil). Ciencia & Saude Coletiva 23 (4),
1267–1280. https://doi.org/10.1590/1413-81232018234.16972016.
Equal Measures 2030.
Farram, S. (2002). Revolution, religion and magic;
the PKI in West Timor, 1924-1966. Bijdragen tot de Taal-, Land- en Volkenkunde / Journal
of the Humanities and Social Sciences of Southeast Asia 158 (1), 21–48. https://doi.org/10.1163/22134379-90003785.
Goodman, E./Adler, N. E./Kawachi, I./Frazier, A.
L./Huang, B./Colditz, G. A. (2001). Adolescents' perceptions of social status:
development and evaluation of a new indicator. Pediatrics 108 (2), E31. https://doi.org/10.1542/peds.108.2.e31.
Henrich, J./Heine, S. J./Norenzayan, A. (2010).
The weirdest people in the world? The Behavioral and Brain Sciences 33 (2-3), 61-83;
discussion 83-135. https://doi.org/10.1017/S0140525X0999152X.
Hoebel, J./Kuntz, B./Müters, S./Lampert, T.
(2013). Subjektiver Sozialstatus und gesundheitsbezogene Lebensqualität bei Erwachsenen
in Deutschland. Ergebnisse der Allgemeinen Bevölkerungsumfrage der Sozialwissenschaften
(ALLBUS 2010). Das Gesundheitswesen 75 (10), 643–651. https://doi.org/10.1055/s-0032-1333211.
Hoebel, J./Müters, S./Kuntz, B./Lange, C./Lampert,
T. (2015). Messung des subjektiven sozialen Status in der Gesundheitsforschung mit einer
deutschen Version der MacArthur Scale. Bundesgesundheitsblatt, Gesundheitsforschung,
Gesundheitsschutz 58 (7), 749–757. https://doi.org/10.1007/s00103-015-2166-x.
Hutagalung, S. A. (2016). Muslim–Christian
relations in Kupang: negotiating space and maintaining peace. The Asia Pacific Journal
of Anthropology 17 (5), 439–459. https://doi.org/10.1080/14442213.2016.1226943.
Jackman, M. R./Jackman, R. W. (1973). An
interpretation of the relation between objective and subjective social status. American
Sociological Review 38 (5), 569. https://doi.org/10.2307/2094408.
Kollo, F. L./Sunarso, S. (2018). Patriarchy
culture and injustice for women in politics. In: Proceedings of the annual civic
education conference (ACEC 2018), Proceedings of the Annual Civic Education Conference
(ACEC 2018), Bandung, Indonesia, 27.04.2018 - 28.04.2018. Paris, France, Atlantis
Press.
Kumar, R./Dudala, S. R./Rao, A. R. (2012).
Kuppuswamy's socio-economic status scale: a revision of economic parameter for 2012.
International Journal of Research and Development of Health (1), 2–4.
Lal, D. (2000). Does modernization require
Westernization? The Independent Review (1), 5–24.
Massey, A. R./Byrd-Craven, J./Auer, B.
J./Swearingen, C. L. (2015). Climbing the social ladder: physiological response to
social status in adolescents. Adaptive Human Behavior and Physiology 1 (1), 72–92.
https://doi.org/10.1007/s40750-014-0009-x.
Nobles, J/Ritterman Weintraub, M./Adler, N. E.
(2013). Subjective socioeconomic status and health: relationships reconsidered. Social
Science & Medicine 82, 58–66. https://doi.org/10.1016/j.socscimed.2013.01.021.
Ostrove, J. M./Adler, N. E./Kuppermann,
M./Washington, A. E. (2000). Objective and subjective assessments of socioeconomic
status and their relationship to self-rated health in an ethnically diverse sample of
pregnant women. Health Psychology : Official Journal of the Division of Health
Psychology, American Psychological Association 19 (6), 613–618. https://doi.org/10.1037/0278-6133.19.6.613.
Powdthavee, N. (2007). Feeling richer or poorer
than others: a cross-section and panel analysis of subjective economic status in
Indonesia. Asian Economic Journal 21 (2), 169–194. https://doi.org/10.1111/j.1467-8381.2007.00253.x.
Saraswati, J. (2003). Entwicklungspfade einer
Übergangsgesellschaft am Beispiel der Entwicklung Indonesiens. Dissertation. Regensburg,
Universität.
Sathiparsad, R./Taylor, M./Dlamini, S. (2008).
Patriarchy and family life: alternative views of male youth in rural South Africa.
Agenda 22 (76), 4–16.
Smaldino, P. E. (2019). Social identity and
cooperation in cultural evolution. Behavioural processes 161, 108–116. https://doi.org/10.1016/j.beproc.2017.11.015.
Tajfel, H., Turner, J. C. (1986). The social
identity theory of inter-group behavior. In: S. Worchel/L. W. Austin (Eds.). Psychology
of intergroup relations. Chicago, Ill., Nelson-Hall, 7–24.
Tanu, D. (2014). Becoming ‘international’: the
cultural reproduction of the local elite at an international school in Indonesia. South
East Asia Research 22 (4), 579–596. https://doi.org/10.5367/sear.2014.0237.
Wulan, R. R./Bajari, A. (2021). Post colonial
studies in Indonesia: women identity in colonial mechanism. n.d.