Nutrition, size, and tempo
Michael Hermanussen ✉
✉
Aschauhof 3, 24340 Eckernförde – Altenhof, Germany.
Christiane Scheffler
University of Potsdam, Human Biology, 14469 Potsdam, Germany.
DOI: https://doi.org/10.52905/hbph2022.3.37
Abstract
Nutrition is a prerequisite, but not a regulator of growth. Growth is defined as increase
in size over time. The understanding of growth includes an understanding of the binary
concept of physical time and individual tempo. Excess food causes
tempo acceleration. Food restriction delays tempo.
Tempo reflects the pace of life. It is a dynamic physical response to a
broad spectrum of social, economic, political, and emotional (SEPE) factors and can affect
life expectancy. Variations in tempo create distortions of the z-score
patterns of height and weight. Illness or intermediate food shortage lead to intermediate
halts in development and create short dips in the z-score patterns. Children who develop
throughout life at delayed pace usually run at lower z-scores for height and weight, and
show a characteristic adolescent trough; children who develop throughout life at faster
than average pace usually run at higher z-scores and show a characteristic adolescent peak
in their z-score patterns. During adolescence, almost half of the height variance is due
to tempo variation. There is not one tempo for the whole
body. Different organ systems grow and mature at different pace.
Keywords: food access, physical time, SEPE factors, pace of life, catch-up-growth
Conflicts of interest: There are
no conflicts of interest.
Citation: Hermanussen, M. / Scheffler, C. (2022). Nutrition, size, and tempo. Human Biology and Public Health 3. https://doi.org/10.52905/hbph2022.3.37.
Copyright: This is an open access article distributed under the terms of the Creative Commons Attribution License which permits unrestricted use, distribution, and reproduction in any medium, provided the original author and source are credited.
Received: 22-05-2022 | Accepted: 12-12-2022 | Published: 10-03-2023
Take-home message for students
Nutrition is a prerequisite, but not a regulator of growth. Nutrition influences the
developmental tempo. Tempo reflects the pace of life,
and is a dynamic physical response not only to food supply, but to a broad spectrum of
social, economic, political, and emotional (SEPE) factors.
Contents
Introduction
Nutrition is a prerequisite of growth. This general biological principle is long known, and
also applies to the human species from conception to adulthood. Severe maternal starvation
is associated with smaller size already at birth – multiple historic birth weight data
support this association, with data from the siege of Leningrad (Antonov 1947) and the Dutch hunger winter during World War II (Rooij et al. 2010). On the other side, maternal
overweight and obesity are associated with larger neonatal weights. Table 1 exemplifies observations of the mid-19th century
(Gassner 1862). Yet, this association is
deceptive. Growth is sensitive to food shortages and food excess (Brix et al. 2020; Li et al.
2017), but food is not the regulator of growth and final height in the proper
sense. Neither tall stature nor short stature mirror food supply. Short stature is not a
synonym of malnutrition (Scheffler and Hermanussen
2022b; Scheffler et al. 2019).
Growth is defined as increase in size over time. But whereas size is easily expressible in
measures of length and volume, the commensurability of time is ambiguous. Physical time is
measurable with clocks and calendars, but growth demands for an understanding of the
pace of life (POL) (Dammhahn et al.
2018; Hermanussen and Meigen 2007; Réale et al. 2010). The POL differs between species and
between individuals of the same species. The day length of the fruit fly differs in its
meaning from the day length of the tortoise. Fruit fly and tortoise differ in POL, they live
at different speed and differ in developmental tempo. So do humans. When
most of the 6th and 7th grade school girls have started to exhibit the
obvious signs of sexual maturity, most of their male classmates are still pre-pubertal. Even
though girls and boys do not differ in calendar age, girls mature at faster pace than boys.
Skeletal age (bone age (Greulich and Pyle 1959;
Tanner et al. 1991)) that has become the gold
standard for determining the state of maturity (Serinelli
et al. 2011) clearly shows the differences between the sexes, and also the
variation of maturity within the same sex (table
2). The same is true for dentition. Assessing the dental state is less accurate, but
may serve as a radiation-free alternative for estimating the state of maturity in
pre-pubertal children (Boeker et al. 2022; Almonaitiene et al. 2012; Lewis 1991).
Table 1 Average weight of newborns is related to body weight of women in labor. Data from
(Gassner 1862)
| N |
weight of woman in labor (kg) |
weight of newborn (kg) |
| 7 |
45-50 |
2.835 |
| 23 |
50-55 |
2.995 |
| 56 |
55-60 |
3.203 |
| 70 |
60-65 |
3.260 |
| 49 |
65-70 |
3.416 |
| 27 |
70-75 |
3.541 |
| 6 |
75-80 |
3.677 |
The aim of this review is to highlight the association between nutrition and the
developmental tempo. Excess food causes tempo
acceleration. Food restriction delays tempo.
The binary concept of time tempo
An understanding of the binary concept of physical time and individual
tempo is essential for the understanding of growth.
Tempo varies throughout life. Some people mature at slower, others at
faster than average pace. Illness, stress, intermediate food shortage and other adverse
environmental impacts, may lead to additional halts or periods of deceleration in the
development of a child. In many cases, subsequent catch-up compensates for those halts: for
a while, children may grow faster than normal. Yet, catch-up may not be complete. Periods of
developmental delay may accumulate and in the long run decelerate an individual’s
developmental pace. Tempo deceleration affects z-score patterns. Short
developmental halts create short dips in the z-scores. Children who permanently mature at
delayed or accelerated pace, show characteristic z-score patterns.
Children with delayed growth appear younger than documented in their passports, they are on
average shorter and lighter than their classmates of the same age, and tend to grow at low
z-scores for height and weight. At pubertal age their height and weight z-scores further
decrease forming a V-shape trough, and thereafter rise to final size (Hermanussen 2010). Children with accelerated growth appear older, they
are taller and heavier than their calendar age suggests. They tend to grow at high z-scores
with a pubertal peak. Absolute height at a certain age depends on tempo,
but height also depends on the prospective “true” size. “Truly” tall, but developmentally
delayed children may appear normal in size, whereas a developmentally accelerated child may
temporarily appear tall and mature early, but will finally end up normal in height (Llop-Viñolas et al. 2004). For better describing the
“true” size in the sense of final outcome, the term amplitude has become
established for many years. In analogy to the sine function – the sine value depends on both
phase and amplitude – the term tempo refers to phase, that
is the speed of development and to the state of maturity at a given calendar age; the term
amplitude describes the maximum extension.
Table 2 Standard deviation (SD) of skeletal age in months found among healthy American
children aged 2 to 17 years. Data from (Greulich and
Pyle 1959)
|
SD of skeletal age in month |
| Age (years) |
Boys |
girls |
| 2 |
4 |
4 |
| 3 |
6 |
5.6 |
| 4 |
7 |
7.2 |
| 5 |
8.4 |
8.6 |
| 6 |
9.3 |
9 |
| 7 |
10.1 |
8.3 |
| 8 |
10.8 |
8.8 |
| 9 |
11 |
9.3 |
| 10 |
11.4 |
10.8 |
| 11 |
10.5 |
12.3 |
| 12 |
10.4 |
14 |
| 13 |
11.1 |
14.6 |
| 14 |
12 |
12.6 |
| 15 |
14.2 |
11.2 |
| 16 |
15.1 |
na |
| 17 |
15.4 |
na |
Tempo varies considerably among healthy individuals as reflected by the
standard deviation of skeletal age in American children (Greulich and Pyle 1959) (table 2). It
significantly contributes to the variation in momentary size. During adolescence, almost
half of the height variance is due to tempo variation (Hermanussen and Meigen 2007). Thus, when talking about
variation in growth velocity, we need to carefully consider calendar versus biological age,
and to clearly distinguish between the aspects of amplitude and
tempo of the growth process.
The inter-individual variability of tempo and its sensitivity to nutrition
has caused much confusion. Overfeeding causes mild developmental acceleration. For many
years child obesity has been related with tall stature, and was even specifically termed as
“Adiposogigantismus” in German literature (Joppich et al.
1975). Meanwhile, the spurious association between food excess and
tempo acceleration has been recognized well (Brix et al. 2020; Li et al.
2017). Nowadays, nobody would propagate to treat tall stature by means of diet
anymore, but this is much less obvious in the case of short stature and food restriction.
The clinical audience is still wedded to the idea that short stature, called stunting, is
caused by malnutritional (Scheffler and Hermanussen
2022b; Scheffler et al. 2019; Hermanussen et al. 2019; Scheffler and Hermanussen 2022a). Also, among the nutrition community,
there is “…convergence on the use of length‐for‐age as the indicator of choice in monitoring
the long‐term impact of chronic nutritional deficiency” (Lartey 2015). Food restriction delays tempo. Schlesinger (1919) wrote: “The difficult living conditions in the last years of the war [World
War I] might even more often cause the delay of the increase in growth
during puberty,“ and: “The whole growth disturbance described here is also to be
regarded as a simple inhibition; the growth type, the growth curve, did not undergo any
significant change in its form, apart from the occasionally observed slight delay of the
puberty drive, the onset of puberty increase”. The fact of inhibition of the longitudinal
growth of children during the last years of the war is of more scientific interest than
practical importance for the above-mentioned reason of the expected reparative capacity; it
is an indication of the intensity of the general malnutrition of children. Schlesinger
considered the “whole growth disturbance” as a “simple inhibition” that does not affect the
form of the growth curve. He also mentioned “expected reparative capacity”, that is
catch-up growth in modern terminology.
Catch-up growth
The term catch-up growth (Wit et al.
2013) insinuates catch-up in amplitude. But this is not the
case. Catch-up growth describes the compensatory and transitory
tempo acceleration following a preceding deceleration in
tempo. Catch-up in “growth” is in fact catch-up in
tempo. Catch-up growth is cause-specific and
characterized by height velocity above the limits of normal for a certain age. It follows
a removal of previous biological or psychosocial growth-inhibiting conditions and may
occur already within a few days. Catch-up growth is an immediate dynamic
physical response and a sensitive indicator of preceding developmental malfunction (Scheffler et al. 2021; Scheffler et al. 2020).
The historic perspective
The sensitivity of tempo is not restricted to nutrition.
Tempo is sensitive to a broad spectrum of social, economic, political,
and emotional (SEPE) factors (Bogin 2021a; Bogin 2021b). Historic growth data obtained in
boarding school boys in 18th century Germany (Komlos et al. 1992) illustrate the social and political impact on developmental
tempo. Adolescents of high aristocratic background are not only taller,
but they enter puberty some two years earlier than their non-aristocratic classmates. In
the second half of the 19th century, Kotelmann
(1879) studied male students of a Latin school
in Hamburg. The boys increased in height velocity from 2.17cm per year in the 9th to 10th
year of age to a maximum of 7.46 cm in the 15th to 16th year of age, i.e. they experienced
their adolescent growth spurt some 2-3 years later than modern boys. Similarly, late
adolescent growth was repeatedly reported throughout the second half of the
19th century and also in the rural areas in the first half of the
20th century. Further evidence for the sensitivity of tempo
to environmental stimuli was provided by studies of menarcheal age. First menstrual
bleedings occurred at a surprising 4–5 year delay in the mid-19th century
compared with modern European girls. We assume that social networking and the collective
inhibition of sexuality in the 19th century bourgeoisie was responsible for
this “collective social amenorrhea” that, by far, exceeded the delay in growth and
physical development of the girls (Hermanussen et al.
2012).
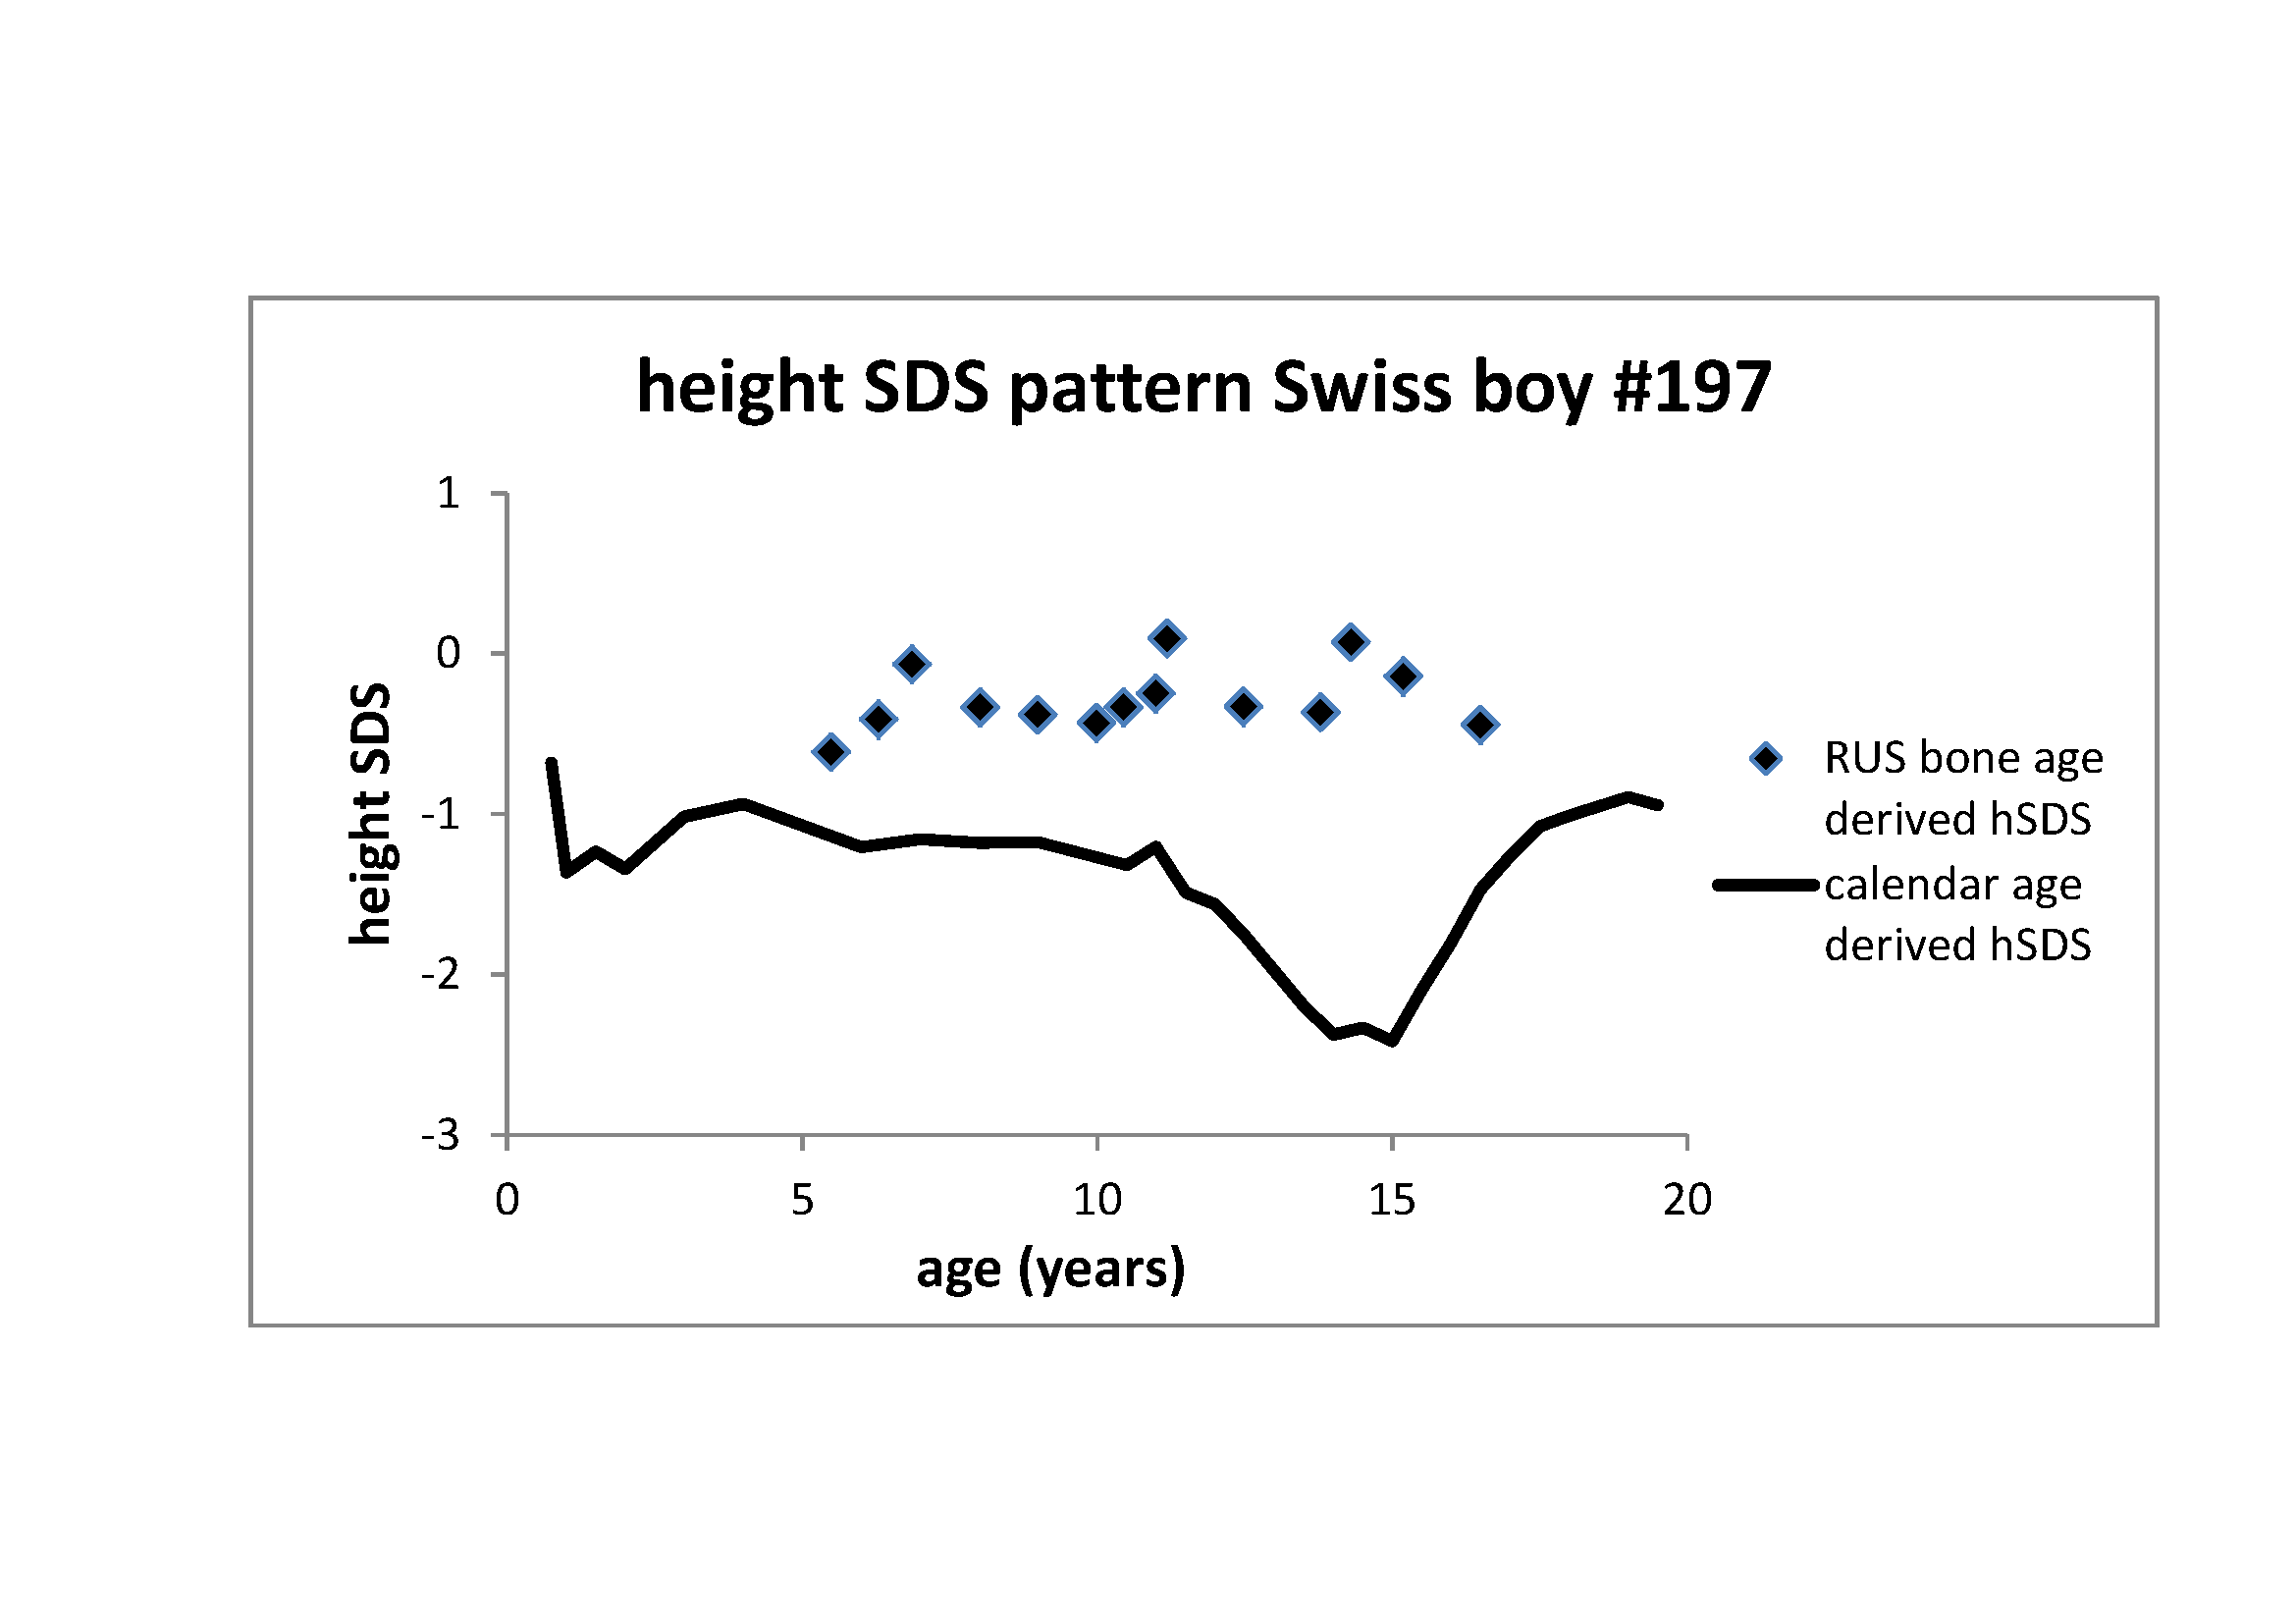
Figure 2 Height z-score pattern of the Swiss boy #197 (see Figure 1). Through line: Z-score pattern based on calendar age.
The significant distortion of this z-score pattern with its characteristic adolescent
trough coincides with the delay in bone age maturation. Rectangles: Z-score pattern
based on RUS (radius, ulnar, small bones) bone age (Tanner et al. 1991). This pattern adjusts for tempo and lacks the adolescent
trough as it refers to skeletal maturity
Pace of life (POL)
The POL (Dammhahn et al. 2018; Réale et al. 2010) as reflected in the concept of
tempo in human growth is not restricted to early development. Factors
that affect tempo tend to persist throughout life. Caloric restriction as
one of the most obvious modulators of developmental tempo can extend mean
and maximal lifespan. This was first shown in rats (McCay et al. 1935), and thereafter in many other species. The studies
contributed essential pieces of knowledge for our understanding of the mechanisms of
ageing (McDonald and Ramsey 2010). Thompson
et al. showed that humans who grow fastest have the highest hazard of death, and the
shortest life expectancy.
These data question modern notions of “optima” and “maxima” in nutrition and height. We
appreciate superabundant choices of food in supermarkets and tall and fast-growing
children, but we must be increasingly cautious when linking maxima and optima. There is
increasing evidence that optimum nutrition rather propends to what we may call “mild
caloric restriction”. The association between tempo and life expectancy
on the one side – the latter being one of the most frequently used health status
indicators (Health status - life expectancy at birth -
OECD Data 2022) – and nutritional supply on the other side, suggests modesty in
our recommendations and warrens serious contemplation when linking shortness in stature
and any necessity of nutrition interventions.
Both tempo and amplitude are dynamic physical responses
to environmental circumstances. The wide margin within which both parameters can vary
suggests that life-history trade-offs and the plasticity of tempo and
amplitude have been most advantageous traits in the bio-cultural
evolution of our species.
Many years ago, Jim Tanner [personal communication 1988] borrowed a picture from the
world of music: tempo does not change the number of notes or harmonies
within a particular piece of music. Yet, it makes an essential difference whether you play
this piece of music largo, adagio, or
presto.
The Swiss boy #197 (First Zürich Growth Study (Prader et al. 1989))
Figure 2 illustrates height z-score patterns of
the Swiss boy #197. Z-scores are usually based on calendar age. Calendar age-based
z-scores of the Swiss boy #197 (through line) are low between the age of 1 and 2 years,
recover at early childhood and again decrease at the age of 15 years. The pattern
exemplifies the characteristic z-score distortion of developmentally delayed children
and adolescents. Developmental delay in growth coincides with delay in bone age
maturation. When instead of referring to calendar age, z-scores are based on bone age,
the pattern changes (rectangles). Z-scores based on bone age lack the characteristics of
delayed development, and rather appear horizontal imitating growth at average
tempo. The figure highlights the necessity of recognizing the concept
of tempo for the understanding of growth.
The effect of tempo on z-score patterns
It has become common practice to depict anthropometric variables on centile curves, or to
transform the raw measurement values into z-scores (standard deviation scores, SDS), and
thereby relating individual measurements to a reference population of the same sex and the
same calendar age (Cole and Green 1992). Z-scores
are most appropriate for describing patterns of human growth.
Z-scores depict both amplitude and tempo. But whereas
taller than average amplitude results in positive, and smaller than
average amplitude in negative z-scores, variations in
tempo result in the distortion of the z-score pattern. Children who
develop at delayed pace with late onset pubertal growth show an adolescent trough in their
z-score pattern (Figure 1, center row), children
who develop at faster than average pace temporarily increase in z-scores with an
adolescent peak (Figure 1, bottom row).
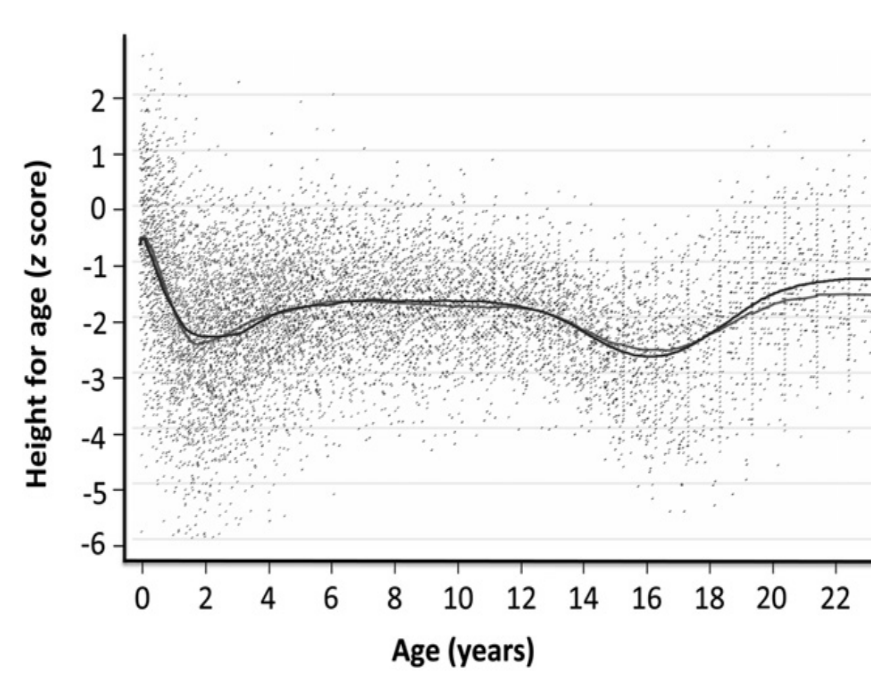
Figure 3 LOWESS-fitted curves applied to semi-longitudinal data on growth collected
between 1951 and 2006 in rural Gambian males. Height-for-age z scores were calculated
against the UK 1990 reference. The slightly higher lines in adulthood are the
post-1970 data (Prentice et al. 2013). The
height-for-age z-score pattern resembles the pattern in Figure 2 suggesting tempo delay of the Gambian male population
(reprinted with kind permission of Oxford University Press, November 30th
2020).
The Gambian males (Prentice et al.
2013)
Similar distortions of z-score patterns can occur in entire populations. In 2013,
Prentice et al. (Prentice et al. 2013)
published semi-longitudinal data on growth collected between 1951 and 2006 in rural
Gambia, and plotted height-for-age z-scores against the UK 1990 reference (Figure 3). The authors were aware of the “artefact
arising from their later entry into puberty”, but most modern researches are not. The
current literature is full of speculations linking z-score patterns to food supply and
demands for nutrition interventions when height z-scores deviate from horizontal
patterns (Hermanussen 2010). Many are
indicative for tempo deceleration at the population level independent
of food supply.
Allometry
There is not one tempo for the whole body. Allometry describes the growth
of body parts and organ systems at different pace, resulting in changes of proportions. Even
the sequence of organ maturation may vary within the body. The maturation of the endocrine
system may uncouple from the tempo at which the skeletal maturation
proceeds as illustrated in growth studies of girls adopted from orphanages in India or
Bangladesh into high-income Scandinavian households (Teilmann et al. 2006; Kuzawa and Bragg
2012). Proos (2009) reported that adopted
Indian girls tended to start pubertal development already at age 11.6 (range of 7.3 –14.6)
years which was much earlier than Swedish (13.0 years) and wealthy Indian girls (12.4 –12.9
years). The degree to which maturation was sped up in these girls depended on their age of
adoption: girls adopted at older ages who spent more time in less favorable conditions,
entered puberty earliest upon environmental improvement (Proos et al. 1991). The premature onset of the endocrine regulation seriously
interfered with skeletal maturation, and impaired the adolescent growth component. The
adolescent growth spurt, though normal in duration and magnitude, was on average 1.5 years
earlier, started at shorter height, with final height being reduced to 154 cm. 8% of the
adopted Indian girls remained 145 cm or shorter. Several studies from India (Datta Banik 2022b) and Mexico (Datta Banik 2022a) refer to the effect of nutrition and unfavorable
living conditions on relative leg length and body proportion.
Conclusion
Nutrition is a prerequisite, but not a regulator of growth in the sense of final outcome in
height or weight (amplitude). Nutrition influences the developmental tempo.
Excess food causes acceleration, food restriction delays tempo.
Tempo acceleration makes children mature at faster pace, and makes them
temporarily appear taller than their age mates. Delay in tempo makes children appear short,
but it is temporary shortness. Narrowing the view on calendar age leads to the delusion that
it is the food that regulates growth. Yet this is deceptive. Tempo reflects
the pace of life (POL), and is a dynamic physical response to a broad spectrum also of
stressful social, economic, political, and emotional (SEPE) factors. Slowing down
tempo e.g. by mild starvation retards the pace of life and thereby, can
even extend life expectancy. Tempo is organ specific. Different organ
systems grow and mature at different pace.
Appendix
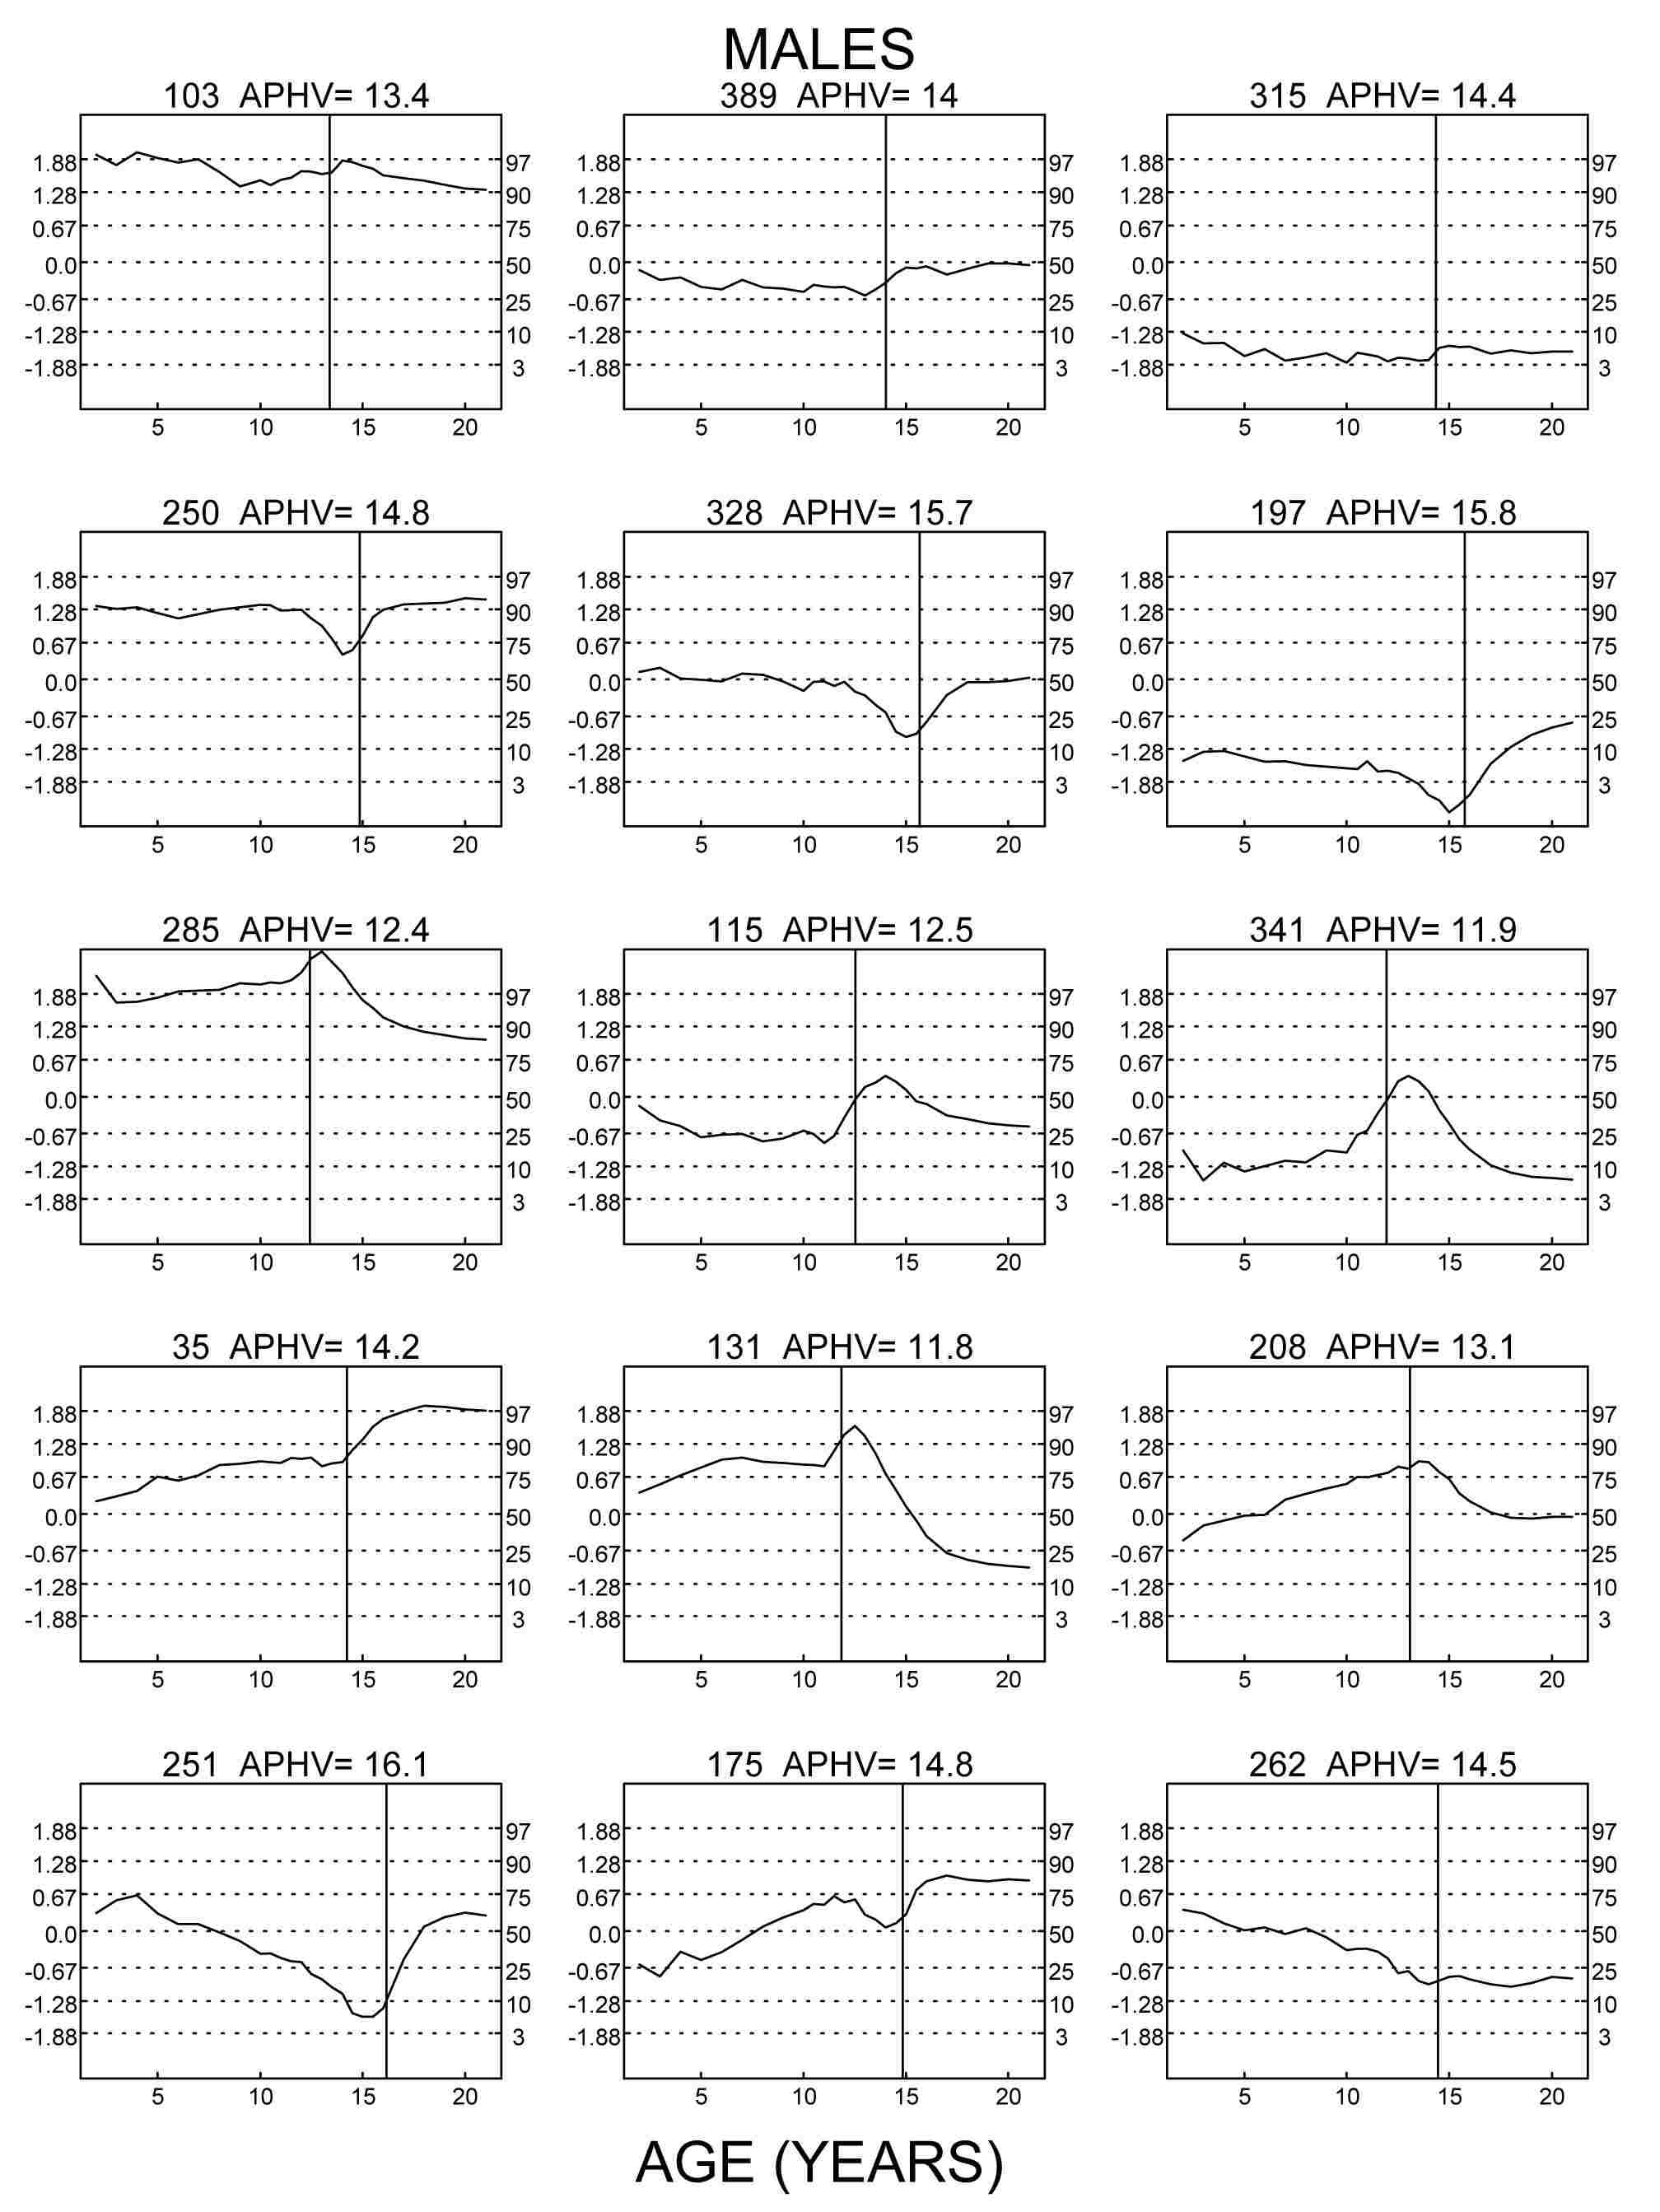
Figure 1 Z-scores for height (centiles for height on the right margins) of nine
exemplarily chosen boys of the Swiss longitudinal growth study (Prader et al. 1989) aged 2 to 19 years. Numbers refer to the
original numbering of the studied children. APHV indicates age at peak height
velocity. Left column: three tall boys, center column: three average height boys,
right column: three short boys. Top row: Z-score patterns of children who grow at
average tempo (APHV 13.4 to 14.4 years) tend to be horizontal. Center row: Z-score
patterns of delayed children (APHV 14.8 to 15.8 years) show an adolescent trough.
Bottom row: Z-score patterns of accelerated children (APHV 11.9 to 12.5 years) show an
adolescent peak.
References
Almonaitiene, R./Balciuniene, I./Tutkuviene, J.
(2012). Standards for permanent teeth emergence time and sequence in Lithuanian
children, residents of Vilnius city. Stomatologija 14 (3), 93–100.
Antonov, A. N. (1947). Children born during the
siege of Leningrad in 1942. The Journal of Pediatrics 30 (3), 250–259. https://doi.org/10.1016/s0022-3476(47)80160-x.
Boeker, S./Hermanussen, M./Scheffler, C. (2022).
Dental age is an independent marker of biological age. Human Biology and Public Health
3. https://doi.org/10.52905/hbph2021.3.24.
Bogin, B. (2021a). Patterns of human growth.
Cambridge, Cambridge University Press.
Bogin, B. (2021b).
Social-Economic-Political-Emotional (SEPE) factors regulate human growth. Human Biology
and Public Health 1. https://doi.org/10.52905/hbph.v1.10.
Brix, N./Ernst, A./Lauridsen, L. L. B./Parner, E.
T./Arah, O. A./Olsen, J./Henriksen, T. B./Ramlau-Hansena, C. H. (2020). Childhood
overweight and obesity and timing of puberty in boys and girls: cohort and
sibling-matched analyses. International Journal of Epidemiology 49 (3), 834–844.
https://doi.org/10.1093/ije/dyaa056.
Cole, T. J./Green, P. J. (1992). Smothing
reference centile curves: The LMS Method and penalized likelihood. Statistics in
Medicine 11, 1305–1319.
Dammhahn, M./Dingemanse, N. J./Niemelä, P.
T./Réale, D. (2018). Pace-of-life syndromes: a framework for the adaptive integration of
behaviour, physiology and life history. Behavioral Ecology and Sociobiology 72 (3).
https://doi.org/10.1007/s00265-018-2473-y.
Datta Banik, S. (2022a). Association of early
menarche with elevated BMI, lower body height and relative leg length among 14- to
16-year-old post-menarcheal girls from a Maya community in Yucatan, Mexico.
Anthropological Review 85 (1), 85–100. https://doi.org/10.18778/1898-6773.85.1.06.
Datta Banik, S. (2022b). Inter-relationships
between percentage body fat, relative subischial leg length and body mass index among
adolescents and adults from the Limbu community of Darjeeling, West Bengal. Journal of
Biosocial Science 54 (1), 124–134. https://doi.org/10.1017/S0021932020000723.
Gassner, U. K. (1862). Über die Veränderungen des
Körpergewichts bei Schwangeren, Gebärenden und Wöchnerinnen. Monatsschrift für
Geburtskunde und Frauenkrankheiten 19, 1–68.
Greulich, W. W./Pyle, Sarah I. (1959).
Radiographic atlas of skeletal development of the hand and wrist. 2nd ed. Stanford,
California, Stanford University Press.
Hermanussen, M. (2010). Auxology: an update.
Hormone Research in Paediatrics 74 (3), 153–164. https://doi.org/10.1159/000317440.
Hermanussen, M./Bogin, B./Scheffler, C. (2019).
The impact of social identity and social dominance on the regulation of human growth: a
viewpoint. Acta Paediatrica 108 (12), 2132–2134. https://doi.org/10.1111/apa.14970.
Hermanussen, M./Lehmann, A./Scheffler, C. (2012).
Psychosocial pressure and menarche: a review of historic evidence for social amenorrhea.
Obstetrical & Gynecological Survey 67 (4), 237–241. https://doi.org/10.1097/OGX.0b013e31824c94ad.
Hermanussen, M./Meigen, C. (2007). Phase variation
in child and adolescent growth. The International Journal of Biostatistics 3 (1),
Article 9. https://doi.org/10.2202/1557-4679.1045.
Joppich, G./Asperger, H./Feer, E. (Eds.) (1975).
Lehrbuch der Kinderheilkunde. 23rd ed. Stuttgart, Fischer.
Komlos, J./Tanner, J. M./Davies, P. S./Cole, T.
(1992). The growth of boys in the Stuttgart Carlschule, 1771-93. Annals of Human Biology
19 (2), 139–152. https://doi.org/10.1080/03014469200002022.
Kotelmann, L. (1879). Die Körperverhältnisse der
Gelehrtenschüler des Johanneums in Hamburg: Ein statistischer Beitrag zur Schulhygiene.
Zeitschrift des Königlich Preussischen Statistischen Bureaus.
Kuzawa, C. W./Bragg, J. M. (2012). Plasticity in
human life history strategy. Current Anthropology 53 (S6), S369-S382. https://doi.org/10.1086/667410.
Lartey, A. (2015). What would it take to prevent
stunted growth in children in sub-Saharan Africa? The Proceedings of the Nutrition
Society 74 (4), 449–453. https://doi.org/10.1017/S0029665115001688.
Lewis, A. B. (1991). Comparisons between dental
and skeletal ages. Angle Orthodontist 61 (87-92). https://doi.org/10.1043/0003-3219(1991)061<0087:CBDASA>2.0.CO;2.
Li, W./Liu, Q./Deng, X./Chen, Y./Liu, S./Story, M.
(2017). Association between obesity and puberty timing: a systematic review and
meta-analysis. International Journal of Environmental Research and Public Health 14
(10). https://doi.org/10.3390/ijerph14101266.
Llop-Viñolas, D./Vizmanos, B./Closa Monasterolo,
R./Escribano Subías, J./Fernández-Ballart, J. D./Martí-Henneberg, C. (2004). Onset of
puberty at eight years of age in girls determines a specific tempo of puberty but does
not affect adult height. Acta Paediatrica 93 (7), 874–879. https://doi.org/10.1111/j.1651-2227.2004.tb02683.x.
McCay, C. M./Crowell, Mary F./Maynard, L. A.
(1935). The effect of retarded growth upon the length of life span and upon the ultimate
body size. The Journal of Nutrition 10 (1), 63–79. https://doi.org/10.1093/jn/10.1.63.
McDonald, R. B./Ramsey, J. J. (2010). Honoring
Clive McCay and 75 years of calorie restriction research. The Journal of Nutrition 140
(7), 1205–1210. https://doi.org/10.3945/jn.110.122804.
OECD (2022). Health status - life expectancy at
birth - OECD Data. Available online at https://data.oecd.org/healthstat/life-expectancy-at-birth.htm (accessed
5/24/2022).
Prader, A./Largo, R. H./Molinari, L./Issler, C.
(1989). Physical growth of Swiss children from birth to 20 years of age. First Zurich
longitudinal study of growth and development. Helvetica Paediatrica Acta. Supplementum
52, 1–125.
Prentice, A. M./Ward, K. A./Goldberg, G.
R./Jarjou, L. M./Moore, S. E./Fulford, A. J./Prentice, A. (2013). Critical windows for
nutritional interventions against stunting. The American Journal of Clinical Nutrition
97 (5), 911–918. https://doi.org/10.3945/ajcn.112.052332.
Proos, L. A./Hofvander, Y./Tuvemo, T. (1991).
Menarcheal age and growth pattern of Indian girls adopted in Sweden. II. Catch-up growth
and final height. Indian Journal of Pediatrics 58 (1), 105–114. https://doi.org/10.1007/BF02810420.
Proos, Lemm A. (2009). Growth & development of
Indian children adopted in Sweden. The Indian Journal of Medical Research 130 (5),
646–650.
Réale, D./Garant, D./Humphries, M. M./Bergeron,
P./Careau, V./Montiglio, P.-O. (2010). Personality and the emergence of the pace-of-life
syndrome concept at the population level. Philosophical Transactions of the Royal
Society of London. Series B, Biological Sciences 365 (1560), 4051–4063. https://doi.org/10.1098/rstb.2010.0208.
Rooij, S. R. de/Wouters, H./Yonker, J. E./Painter,
R. C./Roseboom, T. J. (2010). Prenatal undernutrition and cognitive function in late
adulthood. Proceedings of the National Academy of Sciences of the United States of
America 107 (39), 16881–16886. https://doi.org/10.1073/pnas.1009459107.
Scheffler, C./Bogin, B./Hermanussen, M. (2021).
Catch-up growth is a better indicator of undernutrition than thresholds for stunting.
Public Health Nutrition 24 (1), 52–61. https://doi.org/10.1017/S1368980020003067.
Scheffler, C./Hermanussen, M. (2022a). Stunting is
the natural condition of human height. American Journal of Human Biology 34 (5), e23693.
https://doi.org/10.1002/ajhb.23693.
Scheffler, C./Hermanussen, M. (2022b). What tells
us stunting. Human Biology and Public Health (2).
Scheffler, C./Hermanussen, M./Bogin, B./Liana, D.
S./Taolin, F./Cempaka, P. M. V. P./Irawan, M./Ibbibah, L. F./Mappapa, N. K./Payong, M.
K. E./Homalessy, A. V./Takalapeta, A./Apriyanti, S./Manoeroe, M. G./Dupe, F. R./Ratri,
R. R. K./Touw, S. Y./K, P. V./Murtani, B. J./Nunuhitu, R./Puspitasari, R./Riandra, I.
K./Liwan, A. S./Amandari, P./Permatasari, A. A. I./Julia, M./Batubara, J./Pulungan, A.
(2019). Stunting is not a synonym of malnutrition. European Journal of Clinical
Nutrition. https://doi.org/10.1038/s41430-019-0439-4.
Scheffler, C./Hermanussen, M./Rogol, A. (2020).
Stunting: historical lessons that catch-up growth tells us for mapping growth
restoration. Archives of Disease in Childhood. https://doi.org/10.1136/archdischild-2020-319240.
Schlesinger, E. (1919). Wachstum, Gewicht und
Konstitution der Kinder und der heranwachsenden Jugend während des Krieges. Zeitschrift
für Kinderheilkunde 22, 80–123.
Serinelli, S./Panetta, V./Pasqualetti,
P./Marchetti, D. (2011). Accuracy of three age determination X-ray methods on the left
hand-wrist: a systematic review and meta-analysis. Legal Medicine (Tokyo, Japan) 13 (3),
120–133. https://doi.org/10.1016/j.legalmed.2011.01.004.
Tanner, J. M./Whitehouse, R. H./Marshall, W.
A./Healy, M.J.R./Goldstein, H. (1991). Assessment of skeletal maturity and prediction of
adult height (TW2 method). 2nd ed. London, Academic Press.
Teilmann, G./Pedersen, C. B./Skakkebaek, N.
E./Jensen, T. K. (2006). Increased risk of precocious puberty in internationally adopted
children in Denmark. Pediatrics 118 (2), e391-9. https://doi.org/10.1542/peds.2005-2939.
Wit, C. C. de/Sas, Theo C. J./Wit, J. M./Cutfield,
W. S. (2013). Patterns of catch-up growth. The Journal of Pediatrics 162 (2), 415–420.
https://doi.org/10.1016/j.jpeds.2012.10.014.