No association between body height and metabolic risk factors in short Asian
Indian tribal people
Binu Dorjee ✉
✉
University of North Bengal, Department of Anthropology, Raja Rammohunpur,
Darjeeling, West Bengal 734013, India
Jaydip Sen
University of North Bengal, Department of Anthropology, Raja Rammohunpur,
Darjeeling, West Bengal 734013, India
Mithun Das
Department of Anthropology & Tribal Studies, Sidho-Kanho-Birsha
University, Purulia, West Bengal, India
Kaushik Bose
Department of Anthropology, Vidyasagar University, Midnapore, West Bengal,
India
Christiane Scheffler
University of Potsdam, Institute of Biochemistry and Biology/Human Biology,
Potsdam, Germany
Gautam Kumar Kshatriya
Department of Anthropology, University of Delhi, Delhi, India
DOI: https://doi.org/10.52905/hbph2022.1.32
Abstract
BackgroundAsian Indians often get predisposed to non-communicable diseases for which the
“thin-fat” or “hidden obese” Indian phenotype is usually regarded responsible. In
Europe, America and in some low-middle-income countries (LMICs) short height is often
associated with a high risk of metabolic syndrome (MetS). Indians and particularly
tribal Indian people are relatively short.
AimTo assess the associations of height with MetS risk factors among tribal people of
India.
Sample and methodsThis study was conducted among tribes of India under life-style transition. The height
range was 163.2 cm to 156.5 cm (males) and 151.6 cm to 146.9 cm (females). The
participants were 1066 men and 1090 women aged between 20 and 60 years. Anthropometric
and metabolic markers included in the study were height, body mass index (BMI), waist
circumference (WC), skinfolds (biceps, triceps, sub-scapular, and supra-iliacal),
fasting blood glucose (FBG), blood pressure (systolic and diastolic) and pulse rate
(PR).
ResultsThe highest correlation existed between height and WC (male: 0.21; female: 0.15).
Correlations of body composition variables (BMI, WC, skinfolds) with MetS risk factors
(FBG, SBP, DBP, PR) were not reliable (r < 0.30) among both sexes. St. Nicolas House
Analysis revealed WC among males and WC and sub-scapular skinfolds among females sharing
more connections with other nodes variables.
ConclusionsUnlike the people of the wealthy and often obese social strata of low-middle-income
countries, and in Europe and North America, height of tribal Indian populations is not
associated with metabolic risk factors, such as hypertension, elevated fasting blood
sugar, and central obesity. Rather than linked to the phenotype, obesity appears to be
associated with an obesogenic environment. Public health policy should focus on problems
associated with obesogenic environments.
Keywords: Height, India, Tribes, Diabetes, Hypertension, St. Nicolas House Analysis
Conflict of Interest: There are no
conflicts of interest.
Citation: Dorjee, B. et al. (2022). No association between body height and metabolic risk factors in short Asian
Indian tribal people. Human Biology and Public Health 1. https://doi.org/10.52905/hbph2022.1.32.
Copyright: This is an open access article distributed under the terms of the Creative Commons Attribution License which permits unrestricted use, distribution, and reproduction in any medium, provided the original author and source are credited.
Received: 20-02-2022 | Accepted: 08-05- 2022 | Published: 14-09-2022
Take home message for students
Short body height cannot predispose individuals to MetS risk factors in the absence of an
obesogenic environment.
Contents
Introduction
Non-communicable diseases (NCDs), such as hypertension, diabetes, cardiovascular diseases
and certain types of cancer are on the rise in India. One out of four Indians is at risk of
death due to an NCD before reaching the age of 70 every year, which is alarming (National Health Portal Of India 2022). Changing life
style and dietary habits have been made responsible for increasing NCDs among tribal people
in India (Bhar et al. 2019; Ghosh-Jerath et al. 2021; Sajeev and
Soman 2018; Sarkar et al. 2005; Shriraam et al. 2021; Soren et al. 2021). Common metabolic risk factors leading to NCDs are large waist
circumference, a high triglyceride level, low HDL cholesterol, high blood pressure, and high
fasting blood sugar (National Heart, Lung, and Blood
Institute 2022). The simultaneous occurrence of three of these factors in an
individual is called metabolic syndrome (MetS). The physical and emotional environment also
increases susceptibility to MetS (Cornier et al.
2008; Huang 2009).
Indians have been observed to be at a higher risk of NCDs already at lower thresholds of
body mass index and waist circumference than people of European ancestry (Hills et al. 2018; WHO/IASO/IOTF 2000). The reason often cited is the thin-fat Indian phenotype
(Yajnik et al. 2003). This phenomenon is also
observed in other populations, but was named differently, e.g. as “hidden obesity” or “TOFI”
(Thin in the Outside, Fat in the Inside) (Zdrojewicz
et al. 2017).
This is even more pronounced for marginalized tribes of India who are shorter and thinner
than Europeans and the affluent population of India (Kshatriya and Acharya 2019; Mungreiphy et al.
2012). In the last 100 years height has increased by 1 cm per decade in different
countries of Europe. This was different in Indians (NCD
Risk Factor Collaboration 2016). The height of tribal people in India has remained
fairly stable over the past 100 years. There is no change in the mean heights of Santal
(161.48) and Oraon (162.13) males of the present study compared to heights of the same
population reported by H. H. Risley more than 100 years ago (Risley 1891). For the present study sample, the population-specific
mean heights of Santal and Oraon differ by 1.6 cm to 2.2 cm (p < 0.001) from the national
mean height (NNMB III Repeat Rural Survey 2012).
Even lower mean height was observed among Santals (160.5 ± 6.4), Oraon (161.8 ± 6.3),
Bathudi (159.4 ± 6.4), Kora (158.9 ± 6.2), and Bhumij (159.8 ± 6.7) males of West Bengal and
Odisha (Bose et al. 2006a, 2006c; Bose and Chakraborty
2005; Chakraborty et al. 2011). Short
stature could result in a greater predisposition to NCDs already at lower waist
circumference and body mass index.
The association of short height and the risk factors of MetS has commonly been reported
from high-income countries and the wealthy social strata of Low and Middle-Income Countries
(LMICs) (Islam et al. 2020; Janghorbani et al. 2012; Puchner
et al. 2017; Stefan et al. 2016; Wittenbecher et al. 2019; Yuan et al. 2020). These studies suggest that tall people are less
likely to be at risk of MetS than short people. Thus, as the average Indians are short, they
may be more susceptibility to MetS than Europeans and North Americans. However, this has not
been shown yet.
We hypothesize that short Asian Indian tribal people who currently undergo life-style
transitions show an association between body height and metabolic risk factors. The present
paper will assess this association, and the association of subcutaneous fat (skinfolds),
height and metabolic disease risk factors.
Sample and Methods
This study is based on tribal people of India residing in the states of West Bengal,
Odisha, and Gujarat. The majority of them lead a traditional way of life and rely on
agriculture and forest products. Many of them work as manual laborer on farms, factories and
construction sites (Kshatriya and Acharya 2016).
They experience increasing economic dependency on influences from outside their community
and life-style changes.
Participants and Design
The sample of the present study included people from Santal (245), Kora (235), and Oraon
(238) of West Bengal; Santal (240), Bhumij (238), and Bathudi (240) of Odisha; and Dhodia
(240), Kukna (239) and Chaudhari (241) of Gujarat. They differ in body height (Table 1). This study observed higher alcohol
consumption among the tribes of West Bengal and Odisha, both in men and women than among
the tribes of Gujarat. Similarly, the practice of tobacco chewing (not smoking) was found
to be more prevalent among the tribes of Odisha than in West Bengal and Gujarat.
Information related to entertainment, alcohol, and tobacco was collected in the course of
the present study from each of the participating tribes.
Over the last years, community activities such as traditional folk singing and dancing
practices, among the Santal, Dhodia, and Chaudhari, are being replaced by television and
video shows. Similarly, modern entertainment media, such as television sets and radios are
present in most households. People have access to basic amenities such as water,
electricity, education, and health care; however, there are disparities in the
availability of these facilities because of persisting social and economic inequities
(Ghurye 1969; Saxena and Bhattacharya 2018). Traditionally, the tribes of West
Bengal and Odisha mainly earn their livelihood from forest products, cultivation, and
manual labor in farms. However, because of industrial growth and other developmental
activities, several tribal people of West Bengal and Odisha are migrating and accept
menial jobs. In contrast, the tribes of Gujarat are agriculturists and enjoy a relatively
sedentary life. They are also involved in government jobs, cattle rearing, and manual
labor. The tribes of Gujarat are the most affluent of all the tribes included in the
present study.
The present cross-sectional study was conducted between January 2011 and December 2013 in
five different phases to collect data on selected biomarkers. The study participants were
selected using a multi-stage sampling method. In this process three states were selected
from two different regions, two from the eastern region (West Bengal and Odisha) and one
from the western region (Gujarat) of India. Three tribes were selected from each state
based on their predominant distribution (Office of the
Registrar General & Census Commissioner, India 2001). Again, four districts
were chosen from three states which include two districts of Gujarat and one district each
from West Bengal and Odisha. A total of 66 tribal villages from the selected four
districts were chosen on the basis of comparative proximity to the ‘urban centres’ rather
than to the typical countryside habitation, as the people in such areas are prone to
lifestyle and dietary change. Village listings for each of the tribes were prepared on the
basis of their population concentration. We first estimated the number of men and women in
four 10-year age interval groups (20 – 60 years) across several villages with the
preponderance of specific tribal inhabitants in the population. A sample size of 30 men
and women from each of the four 10-year age interval groups was selected using systematic
random sampling. The final sample size was 2156 adult tribal participants, with 1066 men
and 1090 women (four less than the targeted sample size). Exclusion criteria used were as
follows: growth and developmental disorders, severe health issues in the past year,
existence of any secondary cause of hypertension, and pregnant women. The sample size for
the present study was tested at a 5% level of significance, with a statistical power of
80%.
Table 1 Sex specific means ± standard deviations (SDs) of height (in cm) of the Asian
Indian tribes using ANOVA are presented.
| Indian states |
Tribes |
Male |
Female |
F-value |
| N |
Mean± SD |
N |
Mean± SD |
| West Bengal |
Santal |
123 |
161.5±6.6 |
122 |
148.8±5.8 |
259.1* |
| Oraon |
114 |
162.1±6.6 |
124 |
148.3±5.1 |
328.7* |
| Kora |
114 |
159.0±6.9 |
121 |
147.0±5.2 |
225.6* |
| Odisha |
Bhumij |
116 |
160.9±6.1 |
122 |
149.9±5.4 |
215.6* |
| Santal |
121 |
161.6±6.8 |
119 |
149.8±5.9 |
205.3* |
| Bathudi |
119 |
156.5±6.2 |
121 |
146.9±6.2 |
143.2* |
| Gujarat |
Dhodia |
120 |
163.1±6.9 |
120 |
149.8±5.0 |
293.8* |
| Kukna |
119 |
162.3±6.0 |
120 |
150.1±4.7 |
310.2* |
| Chaudhari |
120 |
163.1±6.9 |
121 |
151.4±5.3 |
220.9* |
| Overall |
|
1066 |
161.1±6.8 |
1090 |
149.1±5.6 |
2005.5* |
Ethical statement
Prior ethical clearance to conduct the research was obtained from the Institutional
Review Committee of the Department of Anthropology, University of Delhi. Informed written
consent from the participants of the study was obtained prior to the actual commencement
of the study. Participants who avoided the sampling were excluded. The data were
anonymized.
Measurement of anthropometric and metabolic variables
The primary information of the participants such as tribe affiliation, age and sex were
recorded. Standard techniques were followed while taking all the anthropometric
measurements (Lohman et al. 1988). The standing
height and weight were measured to the nearest 0.1 cm and 0.1 kg respectively. Height
vertex was measured using a portable anthropometer while the weight was measured by using
body composition monitor (OmronKaradaScan HBF-375, Tokyo, Japan). The participants were
measured in bare feet and with minimum clothing. Biceps (BSF), triceps (TSF), sub-scapular
(SSSF), and supra-iliac (SISF) skinfolds were taken by Holtain skinfold calliper to the
nearest 0.2 mm and used as proxy for body fat. Waist circumference (WC) was measured by
standard technique and used as proxy for central obesity (Lohman et al. 1988). Central obesity or high waistline can be
understood as excess intra-abdominal adipose tissue accumulation including dysfunctional
subcutaneous adipose tissue expansion and ectopic triglyceride storage (Tchernof and Després 2013). Body mass index (BMI)
was calculated by dividing weight (kg) by height (m2), to assess weight status,
such as underweight or overweight. Although used as proxy for obesity it does not
discriminate between fat mass and fat free mass. Systolic and diastolic blood pressure
(SBP and DBP respectively) were recorded twice using a standard mercury sphygmomanometer
on the right arm of the participants. A minimum 15-minute rest before the measurement and
a 5-minute interval between two measurements were ensured. The average of the two
measurements was recorded. The pulse rate per minute (PR) was also recorded. Fasting bold
glucose (FBG) was identified through finger prick by strip method with help of glucometer
(Accu-Check Active, Mumbai, India). Participants were requested to participate in the
morning before taking tea and breakfast. An overnight fasting of ~ 12 hours was maintained
throughout the study. Other measurement related to body composition is not presented here
as the focus of the present analysis is different.
The participation in the study was voluntary as villagers were informed before the
commencement of the fieldwork. Data collection was supervised by one of the co-authors
(GKK).
Criteria used for metabolic risks
Different FBG levels, such as 100mg/dl, 100 mg/dl - 125mg/dl, 126 mg/dl are recommended as normal, pre-diabetes, and
diabetes, respectively (American Diabetes Association
2022; WHO 2022). In case an individual
tested fell in the category of diabetes, the test should be conducted again to confirm
it.
Blood pressure was classified into normal (SBP 120 mmHg and DBP 80 mmHg), pre-hypertension (SBP 120-139 mmHg and DBP 80-89
mmHg) and hypertension (SBP 140 mmHg and DBP 90 mmHg) (Weber et al.
2014). This classification is also recommended by the WHO (2022).
Central obesity for male and female, was defined using a waist circumference
90 cm and 80 cm, respectively (WHO
2008).
According to the Asia-Pacific WHO guidelines, individuals with BMI <18.5
kg/m2 were considered as underweight; >18.5 kg/m2 but <23
kg/m2 as normal; >23 kg/m2 but <27.5kg/m2 as
overweight (high risk) and >27.5 kg/m2 as obese (very high risk). The
overweight and obese were combined for the purpose of the present study (WHO/IASO/IOTF 2000).
Statistical analysis
Statistical analysis were undertaken in R Gui (https://cran.r-project.org).
Associations between variables were assessed using Pearson correlation, St. Nicolas’ House
Analysis (SNHA) with threshold value r > 0.01, and linear regression. The SNHA
technique is a novel non-parametric statistical method that helps translating correlation
matrices into network graphs by tracing “association chains”. Series of coefficients of
determinants that are characterized by the symmetry of ranks of R² both in forward and in
backward direction are named “association chains”. Thus, association
chains formed are ranked according to magnitude of correlation coefficients
(R2), e.g., c[A*B], c[B*C], c[C*D], with the property c[A*B]>c[A*C]> c
[A*D], and c[D*C] > c[D*B] > c[D*A]. Performance measures, the balanced
classification rate and the F1-score showed that SNHA was superior to methods using
sophisticated correlation value thresholds and methods based on partial correlations for
analyzing bands and hubs (Groth et al. 2019;
Hermanussen et al. 2021).
This technique is suitable for handling multiple correlations usually encountered in
anthropometric and various socio-economic and socio-demographic variables (Groth et al. 2019). This new technique translates
the correlation matrix into a network graph which is a useful visual aid and beneficial
for data exploration. The SNHA is now started to be used by researchers to document the
associations of various growth, socio-economic and socio-demographic variables in the form
of a chain (Dorjee 2015; Martin et al. 2020). Essentially, St. Nicolas’ house is a network,
consisting of “nodes” and “edges”. Edges direct from one node to the next one and have a
topological ordering from earlier to later.
Table 2 Sex specific and combined means and standard deviations (±SDs) of metabolic risk
factors with ANOVA result for sex differences of the present study
population.
|
Male (1066) |
Female (1090) |
Combined (2156) |
| Metabolic Risk factors |
Mean± SD |
Mean± SD |
Mean± SD |
F-value |
p-value |
| Age (Years) |
40.5±12.9 |
40.1±11.9 |
40.3±12.4 |
0.5 |
0.49 |
| Body Mass Index
(kg/m2) |
19.9±2.8 |
19.2±3.1 |
19.5±3.0 |
30.5 |
0.01 |
| Waist Circumference (cm) |
74.8±9.7 |
66.5±7.6 |
70.6±9.7 |
469.9 |
0.01 |
| Biceps Skinfolds (mm) |
4.9±4.3 |
5.9±3.3 |
5.4±3.8 |
33.4 |
0.01 |
| Triceps Skinfolds (mm) |
7.0±3.5 |
10.6±6.5 |
8.8±5.5 |
255.0 |
0.01 |
| Sub-scapular Skinfolds
(mm) |
12.4±6.9 |
13.4±5.7 |
12.9±6.4 |
11.9 |
0.01 |
| Supra-iliac Skinfolds (mm) |
7.2±4.5 |
9.0±5.4 |
8.1±5.0 |
45.3 |
0.01 |
| Fasting glucose (mg/dl) |
119.2±40.5 |
114.7±34.5 |
116.9±37.6 |
3.8 |
0.05 |
| Systolic BP (mmHg) |
126.4±19.0 |
127.6±21.3 |
127.0±20.2 |
2.1 |
0.15 |
| Diastolic BP (mmHg) |
77.5±11.8 |
81.9±13.1 |
79.7±12.7 |
64.7 |
0.01 |
| Pulse Rate (per/min) |
78.8±12.7 |
87.3±14.1 |
83.1±14.1 |
214.6 |
0.01 |
Results
The mean and standard deviation of BMI, WC, BSF, TSF, SISF, SSSF, FBG, SBP, DBP, and PR is
given in Table 2. The overall prevalence of BMI
based underweight (40.1%), and obesity (12.5%), central obesity using WC (15.8%),
hypertension using SBP/DBP (11.3%), and FBG based diabetes (25.9%) is presented in Table 3. Correlation plot of the variables used is
given in Figure 1. It is a visual presentation of
correlations obtained in the present study. In the plot, color changes with direction of
correlation, ellipses become tighter and color intensity increases with increasing
coefficient. In the correlation plots of both sexes color intensity is low. The observed
correlations of height with indices of metabolic risk factors such as BMI, WC, FBG, SBP,
DBP, and PR were not relevant (r<0.30). Although negligible, the highest correlation of
height was obtained with WC (male: 0.21; female: 0.15). Even correlations of body
composition variables (BMI, WC, BSF, TSF, SISF, SSSF) with variables of MetS risk (FBG, SBP,
DBP, PR) were negligible as the correlation coefficients were < 0.30 among both
sexes.
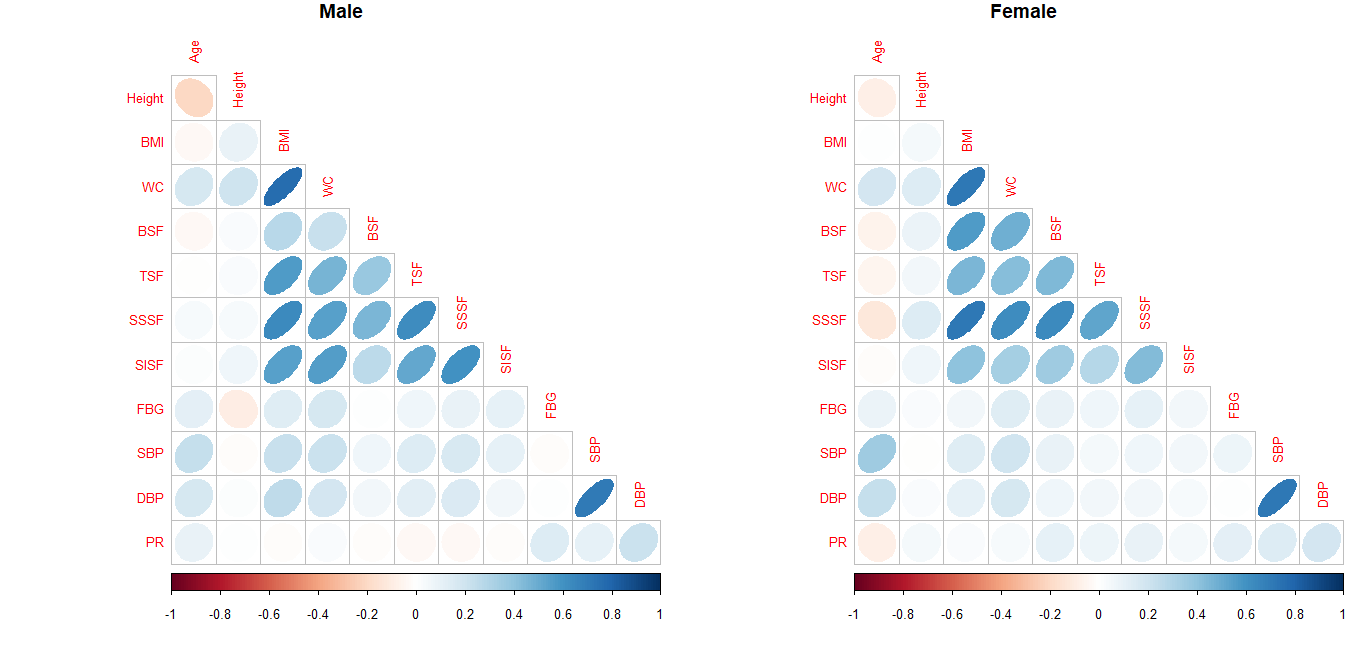
Figure 1 Pearson correlations presented as Corrplot for male and female individuals of
variables Age, Height, BMI (body mass index), WC (waist circumference), BSF (biceps
skinfolds), TSF (triceps skinfolds), SSSF (sub-scapular skinfolds), SISF (supra-iliac
skinfolds ), FBG (fasting blood glucose level), SBP (systolic blood pressure), DBP
(diastolic blood pressure ), and PR (pulse rate).
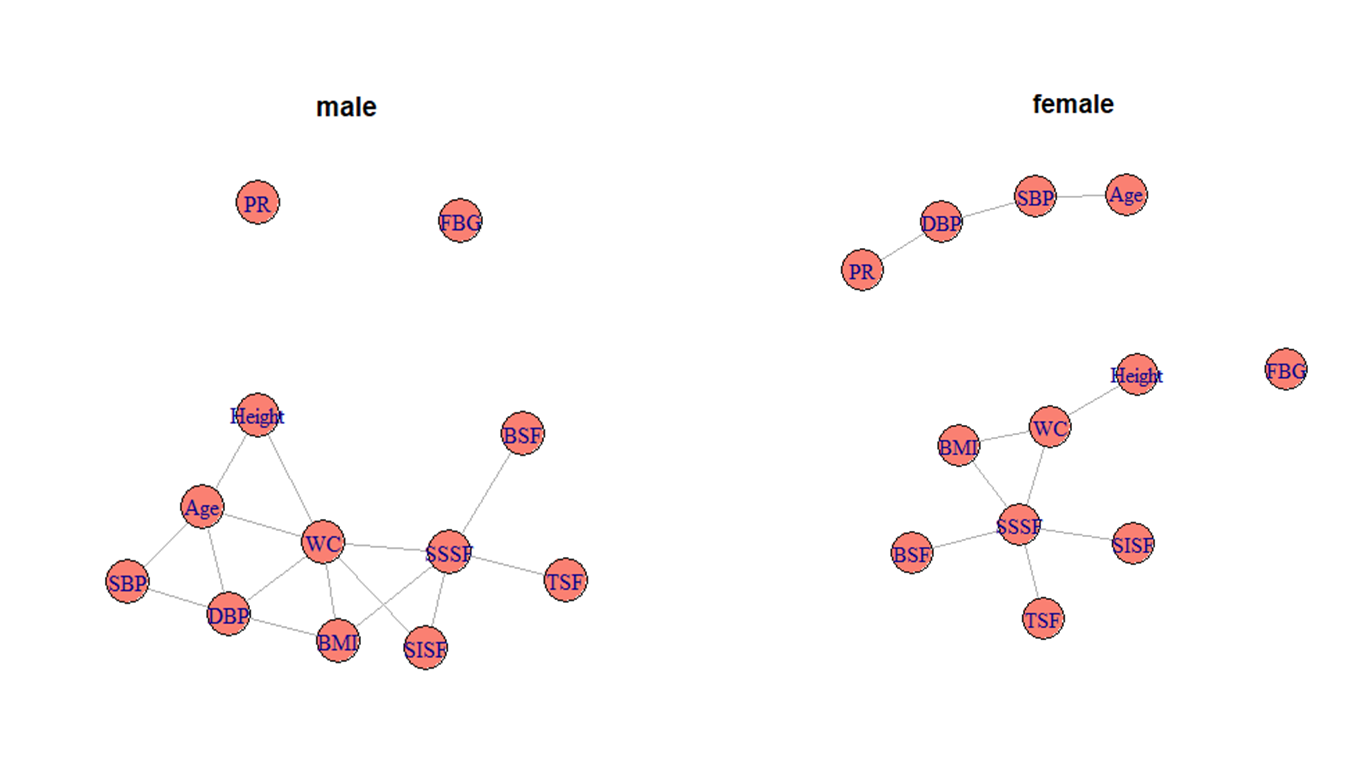
Figure 2 St. Nicolas House Analyses (SNHA), for male and female individuals, nodes
represents variables Age, Height, BMI (body mass index), WC (waist circumference), BSF
(biceps skinfolds), TSF (triceps skinfolds), SSSF (sub-scapular skinfolds), SISF
(supra-iliac skinfolds ), FBG (fasting blood glucose level), SBP (systolic blood
pressure), DBP (diastolic blood pressure ), and PR (pulse rate). An edge represents
association between nodes.
Further using SNHA, we observed height had no direct connecting edges with SBP, DBP, PR,
FBG and skinfolds among both men and women (Figure 2)
indicating that the variable height is not directly associated with SBP, DBP, PR, FBG and
skinfolds. Height is directly associated with WC in both sexes, and with age in adult males.
The nodes of FBG and PR among males and node of FBG among females remain isolated indicating
that FBG and PR are not associated with any other variable. Figure 1 shows that except for BMI, WC and skinfold, and SBP and DBP, all
associations are very low with correlation coefficients < 0.30. Since WC has a central
position in the SNHA plot and is considered a major MetS marker with an association with
height, regression analysis was conducted to further explore this association. Linear
regression confirmed that the effect size of height on WC was 4.0% and 2.0%, among male and
female, respectively. Such an effect size is very small and may not be considered relevant
in terms of risk assessment (Figure 3).
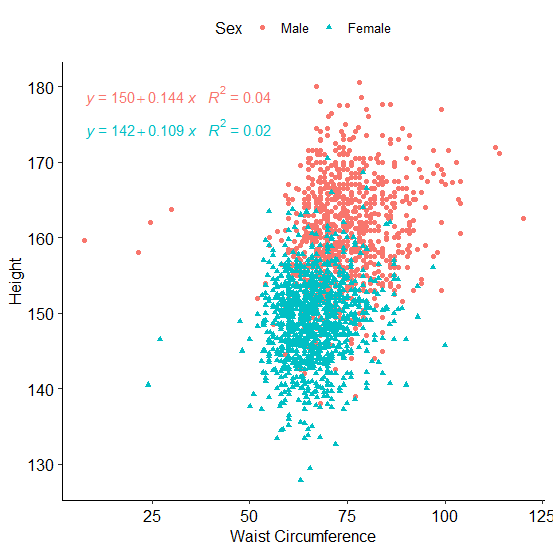
Figure 3 Regression plot of waist circumference (WC) on height of male and female
individuals.
Discussion
The present study was an attempt to assess adult height and its relationship with metabolic
risk factors among short height Asian Indian tribal people experiencing lifestyle
transitions in India. The analysis obtained in the study population did not support the
hypothesis that short Asian Indian tribal people who currently undergo lifestyle transitions
show an association between body height and metabolic risk factors similar to what is
observed in wealthy and often obese social strata of LMICs and the Western countries. Even
though our population showed high metabolic risk factors with central obesity (15.8%),
hypertension (11.3%), and diabetes (25.9%), the present study failed to indicate relevant
correlations between the variables related with obesity (WC, BMI, and skinfolds), and FBG,
SBP, DBP, and PR (all r < 0.30). The SNHA graph only shows one direct connecting edge
between the variables height and WC; however the observed effect size of this association
was not relevant (see Figure 3). Height was not
directly linked with any indirect estimator of the nutritional status such as skinfold
thickness (Figure 2). Our observations are in
contrast to studies reported from other populations, but in line with studies conducted
among children of Indonesia and India (Scheffler et al.
2020, 2018) that showed a similar lack of
association between skinfold thickness and height. In our study skinfold thickness was not
reliably associated with FBG. This is in line with previous observations showing that
abdominal skinfolds were only associated with FBG among British European adult males, but
that this association was absent among their Pakistani counterparts living in Britain (Bose and Mascie-Taylor 1995).
Table 3 Sex specific and overall prevalence of diabetes, hypertension, central obesity,
underweight, and overweight/obesity in the present study population.
| Metabolic risk factors |
Male |
Female |
Overall |
| Diabetes |
298 (28.0) |
260 (23.9) |
558 (25.9) |
| Hypertension |
88 (8.3) |
156 (14.3) |
244 (11.3) |
| Centrally Obese |
280 (26.3) |
60 (5.5) |
340 (15.8) |
| Underweight |
357 (33.5) |
508 (46.6) |
865 (40.1) |
| Normal weight |
561 (52.6) |
461(42.3) |
1022 (47.4) |
| Overweight/obese |
148 (13.9) |
121 (11.1) |
269 (12.5) |
An association of blood pressure with height has been observed in European populations. One
study observed the association of short height and leg length with increased SBP, but not
with DBP, in middle-aged men and women (Langenberg et al.
2003). In another study, short height and leg length were observed with high blood
pressure among men and women of England, Wales, and Scotland (Langenberg et al. 2005). Participants of these studies were
individuals with diabetes, hypertension, and arthrosclerosis (Langenberg et al. 2005, 2003). Similarly, height was directly related with DBP in a study among the US
American population with high serum cholesterol levels, chronic kidney disease, and diabetes
mellitus (Gupta et al. 2021). This was different
for females in Bangladesh. In this population, height was inversely associated with SBP and
there was no such association with DBP. The prevalence of hypertension was 19.2% in the
population of Bangladesh (Islam et al. 2020). Among
Indian tribes the prevalence was 16.1% (Rizwan et al.
2014). The prevalence of hypertension in the present study was relatively low
(11.3%) and an association of blood pressure with height in the present study was
absent.
Studies on the association of height with risk of diabetes have reported inverse
association of height with diabetes (Janghorbani et al.
2012). Usually greater height was related with lower diabetes risk (Wittenbecher et al. 2019). Short height was associated
with undesired changes in glucose metabolism and predicts an increase in the risk of type 2
diabetes and cardiovascular events (Vangipurapu et al.
2017). These studies were conducted among American and European people. Similar
associations with height were also observed among Mexican women (Puchner et al. 2017). Height was inversely associated with diabetes
risk in a nationwide study of Korean adults (Rhee et al.
2019). An association of height with MetS was reported from Peru as well (Toro-Huamanchumo et al. 2020). Similarly, an
association between height components, leg length, ratio of leg length-to-height and
adiposity, insulin resistance, and glucose intolerance was observed by several authors
(Asao et al. 2006; Lawlor et al. 2002). FBG as a marker of diabetes was used by Rhee
et al. and Vangipurapu et al (Rhee et al. 2019;
Vangipurapu et al. 2017). As mentioned earlier,
in the present study the association of height with FBG was not relevant due to its small
effect size in spite of 25.9% prevalence of diabetes based on FBG level.
The variation of SBP and DBP, explained by height was 16.0% and 4.0% respectively in the
Tromso Heart Study (Førde and Thelle 1980). The
publication based on the Tromso Heart Study cited here excluded individuals with diabetes,
hypertension, and arthrosclerosis. In spite of being short and thin, the present study
population has prevalence of central obesity, hypertension, and diabetes. Further, the
people of the South Asian Indian biocultural feature do have cardiovascular disease (CVD)
risks due to high fat mass and lower muscle mass which increases with affluence (Kshatriya et al. 2021). Also the populations of the
present study were at risk of MetS and CVDs. But we found that height is a poor predictor of
metabolic risk and not associated with WC, FBG, SBP, DBP, and PR.
An environment which promotes weight gain and less physical activity within the home or the
workplace has been defined as an obesogenic environment (Swinburn et al. 1999). An obesogenic environment has been described in short
adults (145 cm - 166 cm) working on educational institutes of Lima, Peru. This environment
can promote weight gain due to the lack of enough physical activity. Yet in contrast with
this study our study population consisted of people who performed manual labor and still
lead a relatively traditional way of life (Toro-Huamanchumo et al. 2020). Increasing modernization, asscess to globalized
foods and adaptation to urban lifestyle have been made responsible for the increasing
prevalence of obesity in rural areas (Kirchengast and
Hagmann 2021). This indicates that changes in lifestyle and obesogenic environments
are responsible for the increase of metabolic risks. This also applies for Asian Indian
tribal people, but merely being of short height does not predispose to metabolic
disorders.
Conclusions
Unlike the people of the wealthy and often obese social strata of low-middle-income
countries, and in Europe and North America, height of tribal Indian populations is not
associated with metabolic risk factors, such as hypertension, elevated fasting blood sugar,
and central obesity. Rather than being linked to the phenotype, obesity appears to be
associated with an obesogenic environment. Public health policy should focus on problems
associated with obesogenic environments.
Funding
This study was funded to GKK (Gautam Kumar Kshatriya) by the Indian Council of Medical
Research (ICMR), New Delhi, Government of India, bearing project reference number
5/4/8-2/2010 NCD-II.
Acknowledgements
The authors sincerely acknowledge the support and co-operation of the participants from
different communities and villages of three states of India. Sincere thanks to the district
administration and district health authorities for providing useful information and help
during field work. We also express our gratitude to all the research fellows of the project
for undertaking data collection from remote areas where participanting communities
resides.
References
American Diabetes Association (2022). Diagnosis.
Available online at https://www.diabetes.org/diabetes/a1c/diagnosis (accessed
4/20/2022).
Asao, K./Kao, W. H. L./Baptiste-Roberts,
K./Bandeen-Roche, K./Erlinger, T. P./Brancati, F. L. (2006). Short stature and the risk
of adiposity, insulin resistance, and type 2 diabetes in middle age: the Third National
Health and Nutrition Examination Survey (NHANES III), 1988-1994. Diabetes Care 29 (7),
1632–1637. https://doi.org/10.2337/dc05-1997.
Bhar, D./Bhattacherjee, S./Das, D. K. (2019).
Behavioral and biological risk factors of noncommunicable diseases among tribal adults
of rural siliguri in Darjeeling District, West Bengal: A cross-sectional study. Indian
Journal of Public Health 63 (2), 119–127. https://doi.org/10.4103/ijph.IJPH_326_18.
Bose, K./Mascie-Taylor, C. G. N. (1995).
Association of truncal subcutaneous adiposity with some risk factors of type II diabetes
in adult white and migrant Pakistani males. Journal of Human Ecology (Madrid) 4 (2/3),
301–310.
Bose, K./Chakraborty, F. (2005). Anthropometric
characteristics and nutritional status based on body mass index of adult Bathudis: a
tribal population of Keonjhar District, Orissa, India. Asia Pacific Journal of Clinical
Nutrition 14 (1), 80–82. Available online at https://apjcn.nhri.org.tw/server/APJCN/14/1/80.pdf (accessed
8/10/2022).
Bose, K./Bisai, S./Chakraborty, F. (2006a). Age
variations in anthropometric and body composition characteristics and underweight among
male Bathudis – a tribal population of Keonjhar District, Orissa, India. Collegium
Antropologicum 30 (4), 771–775. Available online at https://hrcak.srce.hr/27638
(accessed 8/10/2022).
Bose, K./Chakraborty, F./Mitra, K./Bisai, S.
(2006b). Nutritional status of adult Santal men in Keonjhar District, Orissa, India.
Food and Nutrition Bulletin 27 (4), 353–356. https://doi.org/10.1177/156482650602700410.
Bose, K./Ganguly, S./Mamtaz, H./Mukhopadhyay,
A./Bhadra, M. (2006c). High prevalence of undernutrition among adult Kora Mudi tribals
of Bankura District, West Bengal, India. Anthropological Science 114 (1), 65–68.
https://doi.org/10.1537/ase.050306.
Chakraborty, R./Bose, K./Koziel, S. (2011). Use of
mid-upper arm circumference in determining undernutrition and illness in rural adult
Oraon men of Gumla District, Jharkhand, India. Rural and Remote Health 11 (3), 1754.
https://doi.org/10.22605/RRH1754.
Cornier, M.-A./Dabelea, D./Hernandez, T.
L./Lindstrom, R. C./Steig, A. J./Stob, N. R./van Pelt, R. E./Wang, H./Eckel, R. H.
(2008). The metabolic syndrome. Endocrine Reviews 29 (7), 777–822. https://doi.org/10.1210/er.2008-0024.
Dorjee, B. (2015). Thinness and overweight among
children belonging to Bengalee population aged 3-10 years. South Asian Anthropologist 15
(2), 135–144. Available online at https://serialsjournals.com/abstract/39706_6.pdf (accessed
8/10/2022).
Førde, O. H./Thelle, D. S. (1980). The Tromsø
heart study. A multiple regression analysis of the relationship between coronary risk
factors and some physical and social variables. Scandinavian Journal of Public Health 8
(2), 49–54. https://doi.org/10.1177/140349488000800201.
Ghosh-Jerath, S./Kapoor, R./Barman, S./Singh,
G./Singh, A./Downs, S./Fanzo, J. (2021). Traditional food environment and factors
affecting indigenous food consumption in Munda tribal community of Jharkhand, India.
Frontiers in Nutrition 7, 600470. https://doi.org/10.3389/fnut.2020.600470.
Ghurye, G. S. (1969). Caste and race in India.
Bombay, Popular Prakashan.
Groth, D./Scheffler, C./Hermanussen, M. (2019).
Body height in stunted Indonesian children depends directly on parental education and
not via a nutrition mediated pathway - Evidence from tracing association chains by St.
Nicolas House Analysis. Anthropologischer Anzeiger 76 (5), 445–451. https://doi.org/10.1127/anthranz/2019/1027.
Gupta, R. D./Akonde, M./Sajal, I. H./Al Kibria, G.
M. (2021). Association between height and hypertension among US adults: analyses of
National Health and Nutrition Examination Survey 2007-18. Clinical Hypertension 27 (1),
6. https://doi.org/10.1186/s40885-021-00164-4.
Hermanussen, M./Aßmann, C./Groth, D. (2021). Chain
reversion for detecting associations in interacting variables: St. Nicolas house
analysis. International Journal of Environmental Research and Public Health 18 (4),
1741. https://doi.org/10.3390/ijerph18041741.
Hills, A. P./Arena, R./Khunti, K./Yajnik, C.
S./Jayawardena, R./Henry, C. J./Street, S. J./Soares, M. J./Misra, A. (2018).
Epidemiology and determinants of type 2 diabetes in south Asia. The Lancet. Diabetes
& Endocrinology 6 (12), 966–978. https://doi.org/10.1016/S2213-8587(18)30204-3.
Huang, P. L. (2009). A comprehensive definition
for metabolic syndrome. Disease Models & Mechanisms 2 (5-6), 231–237. https://doi.org/10.1242/dmm.001180.
Islam, T./Siraj, S./Hassan, Z./Nayem, M./Chandra
Nag, D./Islam, A./Islam, R./Mazumder, T./Choudhury, S. R./Siddiquee, A. T. (2020).
Influence of height on blood pressure and hypertension among Bangladeshi adults.
International Journal of Cardiology. Hypertension 5, 100028. https://doi.org/10.1016/j.ijchy.2020.100028.
Janghorbani, M./Momeni, F./Dehghani, M. (2012).
Hip circumference, height and risk of type 2 diabetes: systematic review and
meta-analysis. Obesity Reviews 13 (12), 1172–1181. https://doi.org/10.1111/j.1467-789X.2012.01030.x.
Kirchengast, S./Hagmann, D. (2021). Obesity in the
City" – urbanization, health risks and rising obesity rates from the viewpoint of human
biology and public health. Human Biology and Public Health 2. https://doi.org/10.52905/hbph.v2.11.
Kshatriya, G. K./Acharya, S. (2016). Triple burden
of obesity, undernutrition, and cardiovascular disease risk among Indian tribes. PloS
One 11 (1), 147934. https://doi.org/10.1371/journal.pone.0147934.
Kshatriya, G. K./Acharya, S. K. (2019). Prevalence
and risks of hypertension among Indian tribes and its status among the lean and
underweight individuals. Diabetes & Metabolic Syndrome: Clinical Research &
Reviews 13 (2), 1105–1115. https://doi.org/10.1016/j.dsx.2019.01.028.
Kshatriya, G. K./Das, M./Bose, K. (2021). Ethnic
heterogeneity in body composition patterning and CVD risk factors: a multi-ethnic study
of Asian Indian Tribes. Ethnicity & Health, 1–24. https://doi.org/10.1080/13557858.2021.1910626.
Langenberg, C./Hardy, R./Kuh, D./Wadsworth, M. E.
(2003). Influence of height, leg and trunk length on pulse pressure, systolic and
diastolic blood pressure. Journal of Hypertension 21 (3), 537–543. https://doi.org/10.1097/00004872-200303000-00019.
Langenberg, C./Hardy, R./Breeze, E./Kuh,
D./Wadsworth, M. E. J. (2005). Influence of short stature on the change in pulse
pressure, systolic and diastolic blood pressure from age 36 to 53 years: an analysis
using multilevel models. International Journal of Epidemiology 34 (4), 905–913.
https://doi.org/10.1093/ije/dyi071.
Lawlor, D. A./Ebrahim, S./Davey Smith, G. (2002).
The association between components of adult height and Type II diabetes and insulin
resistance: British Women’s Heart and Health Study. Diabetologia 45 (8), 1097–1106.
https://doi.org/10.1007/s00125-002-0887-5.
Lohman, T. G./Roche, A. F./Martorell, R. (1988).
Anthropometric standardization reference manual. Champaign, Illinois, Human Kinetics
Books.
Martin, L./Dorjee, B./Groth, D./Scheffler, C.
(2020). Positive influence of parental education on growth of children - statistical
analysis of correlation between social and nutritional factors on children’s height
using the St. Nicolas House Analysis. Anthropologischer Anzeiger 77 (5), 375–387.
https://doi.org/10.1127/anthranz/2020/1177.
Mungreiphy, N. K./Dhall, M./Tyagi, R./Saluja,
K./Kumar, A./Tungdim, M. G./Sinha, R./Rongmei, K. S./Tandon, K./Bhardwaj, S./Kapoor, A.
K./Kapoor, S. (2012). Ethnicity, obesity and health pattern among Indian population.
Journal of Natural Science, Biology and Medicine 3 (1), 52–59. https://doi.org/10.4103/0976-9668.95955.
National Health Portal Of India (2022).
Non-communicable diseases. Available online at https://www.nhp.gov.in/healthlyliving/ncd2019 (accessed
5/1/2022).
National Heart, Lung, and Blood Institute (2022).
Metabolic Syndrome - What Is Metabolic Syndrome? Available online at https://www.nhlbi.nih.gov/health/metabolic-syndrome (accessed
5/1/2022).
NCD Risk Factor Collaboration (2016). A century of
trends in adult human height. Elife 5, e13410. https://doi.org/10.7554/eLife.13410.
NNMB III Repeat Rural Survey (2012). Diet and
nutritional status of rural population, prevalence of hypertension and diabetes among
adults, and infant and young child feeding practices. National Institute of Nutrition,
ICMR, Hyderabad. Available online at https://www.nin.res.in/downloads/NNMB_Third_Repeat_Rural_Survey%20%20%20Technicl_Report_26%20(1).pdf.
Office of the Registrar General & Census
Commissioner, India (2001). Census of India 2001. Available online at https://censusindia.gov.in/nada/index.php/catalog/history/?sort_by=year_start&sort_order=asc&per_page=11200
(accessed 5/1/2022).
Puchner, K. P./Lopez-Ridaura, R./Ortiz-Panozo,
E./Vieitez, I./Lajous, M. (2017). Stature is inversely associated with self-reported
diabetes in middle-aged Mexican women. Revista Panamericana de Salud Pública = Pan
American Journal of Public Health 41, 32. https://doi.org/10.26633/RPSP.2017.32.
Rhee, E. J./Cho, J. H./Kwon, H./Park, S. E./Jung,
J. H./Han, K. D./Park, Y. G./Kim, Y. H./Lee, W. Y. (2019). Relation between baseline
height and new diabetes development: a nationwide population-based study. Diabetes &
Metabolism Journal 43 (6), 794–803. https://doi.org/10.4093/dmj.2018.0184.
Risley, H. H. (1891). The tribes and castes of
Bengal. Calcutta, Bengal Secretariat Press.
Rizwan, S. A./Kumar, R./Singh, A. K./Kusuma, Y.
S./Yadav, K./Pandav, C. S. (2014). Prevalence of hypertension in Indian tribes: a
systematic review and meta-analysis of observational studies. PloS One 9 (5), e95896.
https://doi.org/10.1371/journal.pone.0095896.
Sajeev, P./Soman, B. (2018). Prevalence of
noncommunicable disease risk factors among the Kani tribe in Thiruvananthapuram
district, Kerala. Indian Heart Journal 70 (5), 598–603. https://doi.org/10.1016/j.ihj.2018.01.022.
Sarkar, S./Das, M./Mukhopadhyay, B./Sekhar
Chakraborty, C./Majumder, P. P. (2005). Prevalence of metabolic syndrome in two tribal
populations of the sub-Himalayan region of India: ethnic and rural-urban differences.
American Journal of Human Biology 17 (6), 814–817. https://doi.org/10.1002/ajhb.20448.
Saxena, V./Bhattacharya, P. C. (2018).
Inequalities in LPG and electricity consumption in India: The role of caste, tribe, and
religion. Energy for Sustainable Development 42, 44–53. https://doi.org/10.1016/j.esd.2017.09.009.
Scheffler, C./Krützfeldt, L.-M./Dasgupta,
P./Hermanussen, M. (2018). No association between fat tissue and height in 5019 children
and adolescents, measured between 1982 and in 2011 in Kolkata/India. Anthropologischer
Anzeiger 74 (5), 403–411. https://doi.org/10.1127/anthranz/2018/0827.
Scheffler, C./Hermanussen, M./Bogin, B./Liana, D.
S./Taolin, F./Cempaka, P. M. V. P./Irawan, M./Ibbibah, L. F./Mappapa, N. K./Payong, M.
K. E./Homalessy, A. V./Takalapeta, A./Apriyanti, S./Manoeroe, M. G./Dupe, F. R./Ratri,
R. R. K./Touw, S. Y./K, P. V./Murtani, B. J./Nunuhitu, R./Puspitasari, R./Riandra, I.
K./Liwan, A. S./Amandari, P./Permatasari, A. A. I./Julia, M./Batubara, J./Pulungan, A.
(2020). Stunting is not a synonym of malnutrition. European Journal of Clinical
Nutrition 74 (3), 377–386. https://doi.org/10.1038/s41430-019-0439-4.
Shriraam, V./Mahadevan, S./Arumugam, P. (2021).
Prevalence and risk factors of diabetes, hypertension and other non-communicable
diseases in a tribal population in South India. Indian Journal of Endocrinology and
Metabolism 25 (4), 313. https://doi.org/10.4103/ijem.ijem_298_21.
Soren, S. K./Sahu, S./Kujur, A./Dandpat,
A./Kashyap, V./Kumari, P./Ragini, K. J./Kumari, A./Kumar, D. (2021). Predictors of
breastfeeding initiation among postnatal mothers at tertiary care center of a tribal
dominant state in India: A regression analysis. Cureus 13 (8), e16936. https://doi.org/10.7759/cureus.16936.
Stefan, N./Häring, H.-U./Hu, F. B./Schulze, M. B.
(2016). Divergent associations of height with cardiometabolic disease and cancer:
epidemiology, pathophysiology, and global implications. The Lancet. Diabetes &
Endocrinology 4 (5), 457–467. https://doi.org/10.1016/S2213-8587(15)00474-X.
Swinburn, B./Egger, G./Raza, F. (1999). Dissecting
obesogenic environments: the development and application of a framework for identifying
and prioritizing environmental interventions for obesity. Preventive Medicine 29 (6),
563–570. https://doi.org/10.1006/pmed.1999.0585.
Tchernof, A./Després, J.-P. (2013).
Pathophysiology of human visceral obesity: an update. Physiological Reviews 93 (1),
359–404. https://doi.org/10.1152/physrev.00033.2011.
Toro-Huamanchumo, C. J./Pérez-Zavala,
M./Urrunaga-Pastor, D./La Fuente-Carmelino, L. de/Benites-Zapata, V. A. (2020).
Relationship between the short stature and the prevalence of metabolic syndrome and
insulin resistance markers in workers of a private educational institution in Peru.
Diabetes & Metabolic Syndrome 14 (5), 1339–1345. https://doi.org/10.1016/j.dsx.2020.07.018.
Vangipurapu, J./Stancáková, A./Jauhiainen,
R./Kuusisto, J./Laakso, M. (2017). Short adult stature predicts impaired β-cell
function, insulin resistance, glycemia, and type 2 diabetes in Finnish men. The Journal
of Clinical Endocrinology and Metabolism 102 (2), 443–450. https://doi.org/10.1210/jc.2016-2933.
Weber, M. A./Schiffrin, E. L./White, W. B./Mann,
S./Lindholm, L. H./Kenerson, J. G./Flack, J. M./Carter, B. L./Materson, B. J./Ram, C. V.
S./Cohen, D. L./Cadet, J.-C./Jean-Charles, R. R./Taler, S./Kountz, D./Townsend, R.
R./Chalmers, J./Ramirez, A. J./Bakris, G. L./Wang, J./Schutte, A. E./Bisognano, J.
D./Touyz, R. M./Sica, D./Harrap, S. B. (2014). Clinical practice guidelines for the
management of hypertension in the community: a statement by the American Society of
Hypertension and the International Society of Hypertension. The Journal of Clinical
Hypertension 16 (1), 14–26. https://doi.org/10.1111/jch.12237.
WHO (2008). Waist circumference and waist–hip
ratio: report of a WHO expert consultation. Available online at https://www.who.int/publications/i/item/9789241501491 (accessed
8/17/2022).
WHO (2022). Associated indicators, mean fasting
blood glucose. Available online at https://www.who.int/data/gho/indicator-metadata-registry/imr-details/2380
(accessed 4/20/2022).
WHO/IASO/IOTF (2000). The Asia-Pacific
perspective: redefining obesity and its treatment. Melbourne, Health Communications
Australia.
Wittenbecher, C./Kuxhaus, O./Boeing, H./Stefan,
N./Schulze, M. B. (2019). Associations of short stature and components of height with
incidence of type 2 diabetes: mediating effects of cardiometabolic risk factors.
Diabetologia 62 (12), 2211–2221. https://doi.org/10.1007/s00125-019-04978-8.
Yajnik, C. S./Fall, C. H. D./Coyaji, K. J./Hirve,
S. S./Rao, S./Barker, D. J. P./Joglekar, C./Kellingray, S. (2003). Neonatal
anthropometry: the thin-fat Indian baby. The Pune Maternal Nutrition Study.
International Journal of Obesity 27 (2), 173–180. https://doi.org/10.1038/sj.ijo.802219.
Yuan, Y./Zhou, B./Wang, S./Ma, J./Dong, F./Yang,
M./Zhang, Z./Niu, W. (2020). Adult body height and cardiometabolic disease risk: The
China National Health Survey in Shaanxi. Frontiers in Endocrinology 11, 587616.
https://doi.org/10.3389/fendo.2020.587616.
Zdrojewicz, Z./Popowicz, E./Szyca, M./Michalik,
T./Śmieszniak, B. (2017). TOFI phenotype - its effect on the occurrence of diabetes.
Pediatric Endocrinology, Diabetes, and Metabolism 23 (2), 96–100. https://doi.org/10.18544/PEDM-23.02.0079.