Spatial differences in childhood and adolescent obesity according to sex and
migrant status in Vienna, Austria
Sylvia Kirchengast ✉
✉
University of Vienna, Department of Evolutionary Anthropology
Dominik Hagmann
University of Vienna, Department of Evolutionary Anthropology
DOI: https://doi.org/10.52905/hbph2022.1.31
Abstract
BackgroundThe marked spatial differences in the prevalence of childhood overweight/obesity rates
within cities are mainly due to environmental characteristics of individual intracity
areas. This is the first analysis of spatial differences in the prevalence of
overweight/obesity among children in the Austrian capital Vienna.
Subjects and methodsIn the medical-record-based study, the weight status of 1611 Viennese school children
of lower socioeconomic backgrounds at the ages of six, ten, and 15 years from 46
randomly selected public secondary schools were included. Medical data have been
obtained at schools by trained members of the Medical school authority. Besides effects
of sex and background of migration, associations between weight status and the natural
as well as social environments of the residential and school districts were analyzed.
Since the 23 political districts of Vienna differ markedly in socioeconomic and
environmental characteristics, a comparison between the districts was carried out.
ResultsEspecially high overweight and obesity rates were found for the socially disadvantaged
areas of the 10th, 12th, and 15th political district of
Vienna. Children living and attending schools in better-off districts had lower rates of
overweight and obesity, despite their low social status. The most important factors
influencing overweight and obesity were parameters of the social environment and
characteristics of the residential area of the children. Significant associations
between the body mass index and unemployment rates, average monthly income, the
educational level of the district population, the proportion of migrants in the
district, and sociodemographic cluster areas could be observed. This was equally true
for girls and boys, as well as children with or without a migrant background.
Conclusion In general, socially disadvantaged, inner-city areas showed extremely high prevalence
rates of obesity.
Keywords: Childhood obesity, spatial differences, Vienna, social environment, the background of migration, sex differences
Conflict of Interest: There are no
conflicts of interest.
Citation: Kirchengast, . / Hagmann, . (2022). Spatial differences in childhood and adolescent obesity according to sex and
migrant status in Vienna, Austria . Human Biology and Public Health 1. https://doi.org/10.52905/hbph2022.1.31.
Copyright: This is an open access article distributed under the terms of the Creative Commons Attribution License which permits unrestricted use, distribution, and reproduction in any medium, provided the original author and source are credited.
Received: 10-02-2022 | Accepted: 25-05-2022 | Published: 14-09-2021
Take home message for students
Cities are not homogeneous environments. There are marked spatial differences in the
social and natural environment. This is also true of the Austrian capital Vienna.
Overweight/obesity rates vary significantly between the different areas of the city. The
social characteristics of an area are significantly related to the risk of developing
overweight or obesity during childhood and adolescence.
Contents
Introduction
The worldwide prevalence of obesity nearly tripled during the last 50 years (Blüher, 2019). Currently, more than 1.9 billion adults
(≥ 18 years) are overweight (BMI > 25.00 kg/m2) and among these, 650 million are
classified as obese (BMI > 30.00 kg/m2) (WHO,
2021). Obesity is not only a problem for the adult population. According to the
World Health Organization (WHO, 2021), more than
340 million children and adolescents aged 5-19 years are overweight or obese worldwide
(Lasserre et al. 2007). Unfortunately, obesity
and overweight not only cause aesthetic problems, but several non-communicable diseases,
such as type 2 diabetes, cardiovascular diseases, cancer, respiratory diseases, asthma
impaired reproductive function, and psychological distress are also more frequently found
among obese people (Clark and Brancati, 2000; Felisbino-Mendes et al., 2020; Shen et al., 2019). Furthermore, obesity weakens the immune system and
enhances inflammation and as a consequence, obese individuals are more susceptible to
infectious diseases (Pugliese et al., 2022). In the
case of SARS COVID 19, obesity increases the risk of both COVID-19-related hospitalization
and death (Sawadogo et al., 2022). Being
overweight, and obese are also significantly associated with long-term psychosocial and
economic problems on an individual level (Ford and Mokdad,
2008; Wang et al., 2011). This is not only
true of adults but also of children and adolescents (Ebbeling et al., 2002; Han et al., 2010;
Kimm and Obarzanek, 2002; Spinelli et al., 2019). Therefore, the high prevalence of excessive
body weight worldwide is a matter of concern because it represents an enormous economic
burden on public health and social systems (Withrow and
Alter, 2011). In this way, obesity is one of the major worldwide public health
challenges of the 21st century (Chooi et al., 2019;
Spinelli et al. 2019).
To prevent obesity and to develop strategies to cope with high obesity rates, it is
necessary to analyze all factors promoting overweight and obesity. Besides a genetic
component which may contribute to 40-70% of obesity (Chiurazzi et al. 2020; Thaker 2017) and
intrauterine programming (Fernandez-Twinn et al.
2019) the basic drivers of obesity, are behavioral ones, such as diet, energy
supply, adverse eating habits, and a lack of physical activity. These behavioral factors may
have a genetic basis, but first of all, they are influenced by environmental parameters. The
main environmental reason for rising obesity rates worldwide is the dramatic increase of the
so-called obesogenic environment (Hobbs and Radley,
2020), which is mainly characterized as “an environment that promotes gaining
weight and one that is not conducive to weight loss” within the home or workplace (Swinburn et al., 1999). The main characteristics of an
obesogenic environment are, therefore, conditions that reduce physical activity and enhance
adverse dietary patterns such as the consumption of cheap food rich in fat and sugar as well
as social neighborhoods that are unsafe and stressful (Lieberman, 2006). Although this kind of environment is often associated with
socially disadvantaged areas, obesogenic conditions can equally be found in middleclass
suburban areas with low connectivity and a high dependence of car use (Congdon, 2019). Obesogenic environments are consequently determined by
social as well as geographical factors.
The impact of environmental factors on the risk of becoming overweight or obese has
increasingly gotten into focus during the last 20 years, with special attention paid to
urban-rural differences in the prevalence of overweight and obesity (Dong et al., 2019; Hu et al.,
2020). In low- and middle-income countries, first of all, an increase in obesity
rates in rural areas can be observed (Dong et al.,
2019). This trend is mainly due to nutritional and developmental assistance
programs in rural areas of poor countries, but also due to the expansion of obesogenic
environments from urban to rural areas (Khan and Krämer,
2014; Mou et al., 2013; Paciorek et al., 2013).
Furthermore, urbanization is an ongoing phenomenon worldwide and is associated with rising
obesity rates. Cities, however, are not per se obesogenic environments. It is important to
state, that urban areas are not homogenous, but have marked social and environmental
differences between intra-urban regions, individual districts, and also within districts.
Only a few studies have considered intra-city, spatial differences in obesogenic
environments (Dahly et al., 2013; Lakes and Burkart, 2016; Ouédraogo et al., 2008; Penney
et al., 2014; Sun et al., 2020). In
general, an association between social and environmental factors and the risk of obesity has
been documented (Sun et al., 2020). Areas with a
low socioeconomic status, characterized by a high amount of poverty and unemployment are
considered to promote high overweight and obesity rates.
In the case of childhood overweight and obesity, Lakes
and Burkart (2016) showed a distinct spatial distribution of overweight among 5 to
6 year old children in Berlin. Particularly high rates of overweight among these children
were found for the inner city, while the suburban areas were characterized by significantly
lower prevalence of childhood obesity (Lakes and Burkart,
2016). This spatial pattern in childhood obesity prevalence is interpreted as a
result of socioeconomic inequalities between the different areas, because a strong
connection between socioeconomic status as well as the social environment and obesity have
been reported by several authors (Lobstein et al.,
2004; McLaren, 2007; Peeters and Backholer, 2014; Sun
et al., 2020). The analysis of spatial or regional differences in the risk of
becoming overweight or obese within cities is of special importance for health-oriented
spatial planning and developing strategies to avoid increasing obesity rates in urban areas.
Unfortunately, up to now, no comparable analysis exists for the Austrian capital Vienna.
Therefore, the aim of this study is to analyze the intraurban spatial patterns of overweight
and obesity during childhood and adolescence in Vienna and to identify possible influencing
factors. In particular, the following two hypotheses were tested.
| 1. | The prevalence of overweight and obesity among children and adolescents differs between
individual Viennese districts. |
| 2. | The prevalence of overweight and obesity is associated with sex and migrant status, but
also with socioeconomic and environmental factors typical for the individual districts,
such as unemployment rate, educational level, proportion of immigrants, population
density or green areas. |
Material and methods
Study design
The present study is a small part of a collaborative project between the University
Clinic for Pediatrics, Medical University of Vienna, the Department for Evolutionary
Anthropology, University of Vienna and the Viennese Medical School Authority starting in
1999. The data were collected between 1999 and 2008. The aim of the project was the
analysis of changing weight status of Viennese children and adolescents between 6 and 15
years, i.e. during compulsory schooling. The longitudinal study based on medical records
started at school entry, usually at the age of 6 years and ended 9 years later, when
compulsory schooling ended. In Vienna, public school students are obliged to attend a
school that is geographically close to their place of residence. School and place of
residence are therefore usually in the same district or at a short distance. This fact is
important for spatial analysis. For data protection reasons, body height, body weight, and
few sociodemographic data (sex, background of migration, district of residence) were
provided in an anonymous data file by the Viennese Medical School Authority.
Study area
Exclusively Viennese children were included in the project and consequently in the
present study. Vienna, the Austrian capital had about 1.8 million inhabitants at the time
of data collection and, currently, has 1.9 million inhabitants. It is characterized by a
highly heterogeneous structure in terms of residential living environments and
socio-economics. The urban structure varies widely across the 23 political districts, and
includes densely populated areas in the city center, as well as single family homes in the
suburban areas. The outskirts are characterized by agriculturally used areas and small
villages. About 47% of inhabitants have a migrantion background. Currently, 55% of
children aged between 6 and 16 years do not speak German at home. Although the huge
migration wave started in 2015, Vienna has been a melting pot of nations since the 1990s
and has a multi-ethnic character.
Data set
In our study we analyzed a record-based medical dataset provided by the Viennese School
authority. Forty-four public secondary schools (two from each of the 23 districts of
Vienna, with the exception of the sixth district) were randomly selected from this
Authority. All data originated from public (state) secondary schools, so-called
Hauptschulen. Attendance at a public secondary school is an indicator of a quite low
social status in Vienna. In Austria, it is obligatory that – beside medical data – the
body height and body weight of all school children are collected by specially trained
personnel from the medical school authority. Our data set included exclusively body weight
and body height data collected by members of the Medical school authority in the schools.
The data file, including all information on body height and body weight, are stored by the
Viennese school medical office. As pointed out above, the Medical School Authority
provided us with anonymized data sets. In the present study we included data from 1611
children, 772 girls and 839 boys.
The following strict inclusion criteria were defined:
| a) | complete data set (data collection at the ages of 6,10 and 15 years). |
| b) | living in the same district during these 9 years. |
Individual data
We obtained limited individual data for each participant. Beside age and sex, there was
information regarding the school district, residence area and history of migration for
each child defined as being born in a country other than Austria and migrated to Austria
for permanent residence, or where at least one parent was born in a country other than
Austria. Unfortunately, no information regarding menarche, or parental parameters was
available.
Weight status
Data concerning body height (in cm) and body weight (in kg) was provided by the Viennese
Medical School Authority from which the body mass index (BMI) (kg/m2) was
calculated. The weight status at the age of 6, 10 and 15 years old was classified as
percentiles published by Kromeyer-Hauschild et al.
(2001) and Rosario et al. (2010). We are
aware, that these German charts may be suboptimal for a multi-ethnic Austrian sample
(Kirchengast and Schober, 2009), however,
currently no validated Austrian charts exist. The charts published by Kromeyer-Hauschild et al. (2001) are still used for
the Austrian Nutritional Survey. Therefore, we decided to use the Kromeyer-Hauschild
charts in this study. A BMI above the sex- and age-specific 90th percentile was
defined as overweight, and above the age and sex specific 97th percentile was
defined as obese. In the present study, we included all BMIs above the 90th
percentile in one group, comprising obesity and overweight.
Sociodemographic and environmental factors
In order to examine the influence of the social and natural environments on weight
status, we included the following parameters using the official sources of the Statistical
Department of the Viennese Government (Stadt Wien,
Wirtschaft, Arbeit und Statistik, 2020):
| • | green areas for each political district (in hectares) |
| • | population density for each political district (people per km2) |
| • | average monthly income (in €) for fulltime job for each political district |
| • | life expectancy for each political district |
| • | mean age of population for each political district |
| • | rate of population with University degree for each political district |
| • | rate of population with mandatory education only for each political district |
| • | unemployment rate for each political district |
| • | migrant rate for each political district |
In addition, we used the seven cluster areas of Vienna provided by the Viennese
Government (Gemeinde Wien, 2013). These seven
cluster areas have been defined by a governmental working group based on the results of a
principal component analysis including 29 sociodemographic indicators. The cluster areas
describe sociodemographic characteristics of the residential areas of the city of Vienna
and correspond to the characteristics of the political districts. Since the
sociodemographic structure of some political districts is quite similar, each of the 23
political districts can be assigned to one of 7 cluster areas. A summary of the
sociodemographic indicators of the 7 cluster areas is presented in Table 1.
| |
fluctuation |
unemployment rate |
poverty |
migration rate |
educational level |
% of children |
| Cluster 1 |
low |
very low |
very low |
very low |
high |
Low |
| Cluster 2 |
low |
very low |
very low |
very low |
high |
High |
| Cluster 3 |
high |
very low |
very low |
low |
high |
Low |
| Cluster 4 |
high |
very high |
high |
very high |
low |
High |
| Cluster 5 |
low |
high |
medium |
medium |
low |
Medium |
| Cluster 6 |
low |
low |
low |
low |
medium |
Low |
| Cluster 7 |
low |
high |
high |
high |
low |
High |
Spatial analyses
In order to compare overweight and obesity rates between individual Viennese districts,
we performed a spatial data analysis. We exported a data query of classified percent
shares for every Viennese district (except for the 6th district, where no data
was available for this study) from IBM SPSS to XLSX file format. For the spatial data
analysis, we loaded a structured table containing the anthropological data and ESRI
Shapefiles providing spatial information on Vienna (Stadt Wien, 2021, 2020), into the free and open-source geographic information
system software QGIS. As a coordinate reference system, we used EPSG:31256 MGI / Austria
GK East. For geostatistic analysis and mapping, we applied ‘natural breaks’ after Jenks
(de Smith et al., 2021; Jenks and Caspall, 1971) in order to cluster the percent share of
children per district. We then manually defined breaks to classify the anthropological
dataset.
Statistical analyses
Statistical analyses were carried out using SPSS for Windows (version 27.00). Descriptive
statistics and chi-square were used to evaluate group differences in weight status. Odds
ratios were used to analyze the risk of becoming overweight/obese. Principal component
analyses (PCA) using varimax rotation were carried out in order to obtain more information
about the structure of social and environmental data and to reduce the number of
variables. Spearman correlations were computed to analyze the association patterns between
individual, social and environmental parameters and the body mass index for each age group
separately. Additionally, binary logistic regression analyses were performed to evaluate
the association of sex, migrant status and social as well as environmental factors
(population density, unemployment rate, average monthly income, educational level, mean
age of population, life expectancy, green areas) and the overweight/obesity rate. P
<0.05 was considered as statistically significant.
Results
Sample description
The sample comprised 839 boys (52.1%) and 772 girls (47.9%). 874 children (54.3%) had a
background of migration. More than 95% of these children originated from Turkey or former
Yugoslavia. Figure 1 presents the percentage of
children with a background of migration according to the 23 political districts of Vienna.
The highest rates of children with a migrant background were observed in the
5th, 10th, 12th, 15th and 20th
district. These districts belong to cluster areas 4 or 7.
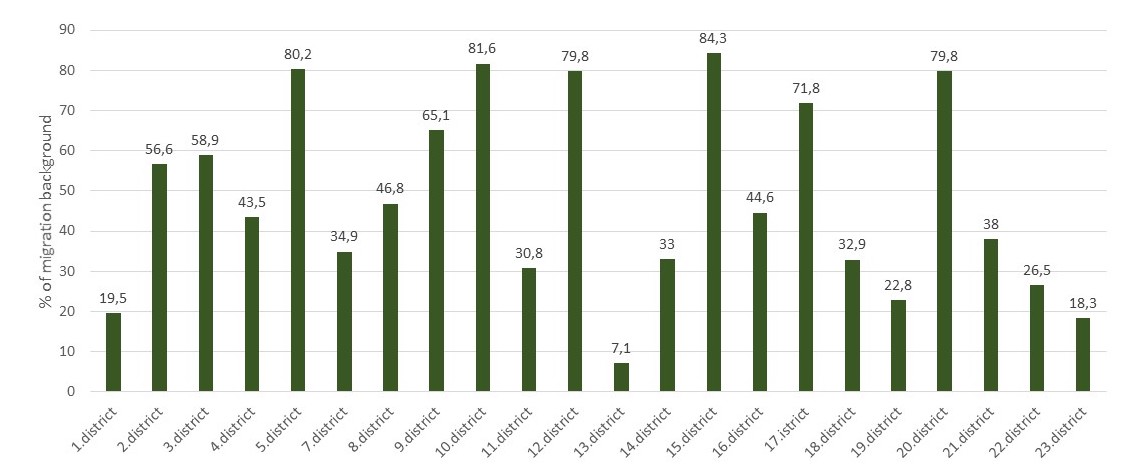
Figure 1 Percentage of children with a migration background according to political
districts of Vienna.
Weight status
As presented in Table 2, nearly 20% of the
children were overweight or obese by the age of 6 years. At the age of 10, nearly 30 % of
the children were classified as overweight or obese. This applied to about 25% of the
adolescents at the age of 15. Girls and boys did not differ significantly from each other
in weight status at the ages of 6, 10 and 15 years. We found a higher percentage of
overweight among children with a migrant background at all age groups. Furthermore, we
found a higher prevalence of obesity among children with a history of migration, at the
ages of 6 and 10 years. The risk of being overweight or obese (OR = 1.167 95%CI 1.022 –
1.332) for children with this background was significantly higher (p=0.029) only at the age of 6 years.
Spatial analyses
Rates of overweight/obesity were compared between the 7 cluster areas. Overweight/obesity
rates differed significantly between areas (p= 0.001). This
applied to all three age groups. The lowest rates of overweight and obesity were found in
Cluster 1 and the highest rates in cluster 7.
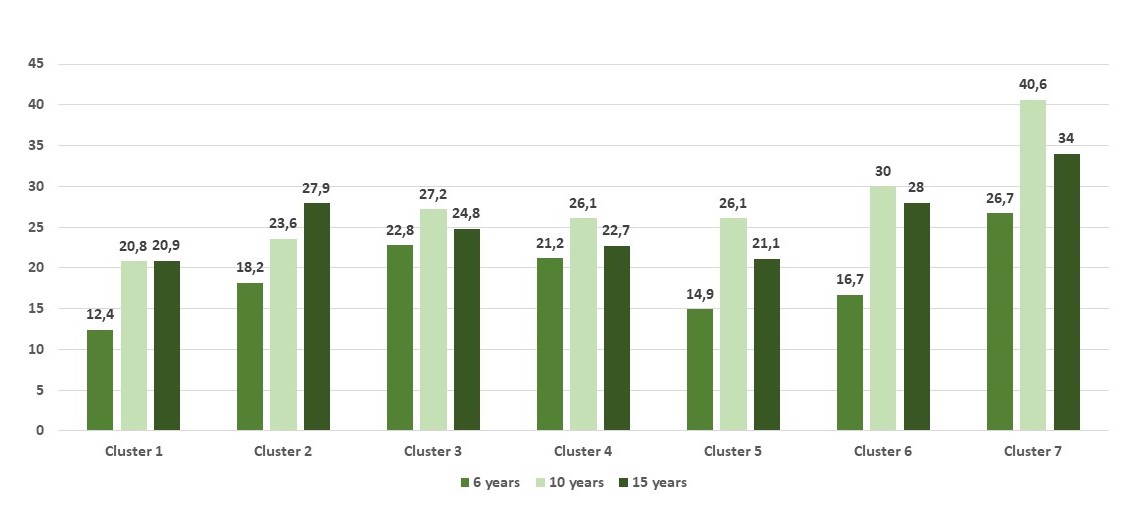
Figure 2 Overweight and obesity rates according to the 7 cluster areas of Vienna.
In a second step the political districts of Vienna were compared. As demonstrated in
Figure 3 the prevalence rates of overweight and
obesity differed markedly between the individual districts. At the age of six years, girls
showed the highest overweight and obesity rates in the 9th, 10th and
15thdistrict, while the lowest rates were found for the 3rd,
4th, 5th and 19th district. Among 6-year-old boys, the
highest prevalence rates occurred in the 10th district, the lowest in the
1st, 13th and 19th district. At the age of 10 years,
girls showed the highest obesity prevalence in the 15th district, and the
lowest in the 13th district. Among their male counterparts, the highest obesity
prevalence rates were found for the 10th, 1st and 15th
district, the lowest ones for the 1st district. At the age of 15 years, the
highest obesity prevalence rates were found for the 15th district, the lowest
for the 3rd and the 19th district. This applied to both girls and
boys.
Figure 3 Overweight and obesity rates according to age and sex for each Viennese
district.
As demonstrated in Figure 4 children and
adolescents with a migration background, the highest obesity prevalence rates at the age
of 6 years were found for the 11th district, the lowest rates were found for
the 4th, 5th, 13th and 22nd district. At the
age of 10 years, children with a migrant background had the highest prevalence rates of
overweight and obesity in the 11th and 15th district, while the
lowest rates were found for the 4th district. At the age of 15 years, the
highest prevalence rates of obesity occurred at the 15th district the lowest at
the 13th, 18th and 22th district. Children without a
migrant background of migration in general had lower rates of obesity at the age of 6
years. The highest rates were found for the 10th district. At the age of 10
years, children with no migrant background had the highest obesity prevalence rates in the
10th and 15th district, and the lowest for the 17th
district. At the age of fifteen years, adolescents without a migrant background had the
highest obesity prevalence rates in the 9th, 10th and the
15th district.
Table 2 Weight status according to sex, background of migration and age group.
|
total |
male |
female |
|
migration history |
no migration history |
|
n |
% |
n |
% |
n |
% |
n |
% |
n |
% |
| Weight status at the age of 6a |
|
|
|
|
|
|
|
|
|
|
|
underweight <10th
perc |
125 |
7.7% |
71 |
8.4% |
53 |
6.9% |
56 |
6.4% |
66 |
8.9% |
|
normal-weight 10-90th
perc |
1166 |
72.4% |
607 |
72.4% |
559 |
72.4% |
622 |
71.1% |
543 |
73.7% |
|
overweight 90-97th
perc |
160 |
9.9% |
78 |
9.3% |
83 |
10.7% |
97 |
11.1% |
65 |
8.8%* |
|
obese >97th
perc |
160 |
9.9% |
83 |
9.9% |
77 |
10.0% |
99 |
11.3% |
63 |
8.6%`* |
| Weight status at the age of 10a |
|
|
|
|
|
|
|
|
|
|
|
underweight <10th
perc |
110 |
6,8% |
62 |
7.4% |
48 |
6.2% |
58 |
6,6% |
52 |
7.1% |
|
normal-weight 10-90th
perc |
1033 |
64.1% |
537 |
64.0% |
496 |
64.3% |
543 |
62.2% |
487 |
66.1% |
|
overweight 90-97th
perc |
279 |
17.3% |
154 |
18.4% |
124 |
16.0% |
160 |
18.3% |
120 |
16.3% |
|
obese >97th
perc |
190 |
11.8% |
86 |
10.2% |
104 |
13.5% |
113 |
12.9% |
78 |
10.6% |
| Weight status at the age of 15a |
|
|
|
|
|
|
|
|
|
|
|
underweight <10th
perc |
66 |
4.1% |
37 |
4.4% |
29 |
3.8% |
35 |
4.0% |
32 |
4.3% |
|
normal-weight 10-90th
perc |
1128 |
70.0% |
599 |
71.2% |
530 |
68.6% |
599 |
68.5% |
528 |
71.7% |
|
overweight 90-97th
perc |
238 |
14.8% |
110 |
14.2% |
119 |
15.4% |
151 |
17.3% |
88 |
11.9% |
|
obese >97th
perc |
179 |
11.1% |
85 |
10.1% |
94 |
12.2% |
89 |
10.2% |
89 |
12.1% |
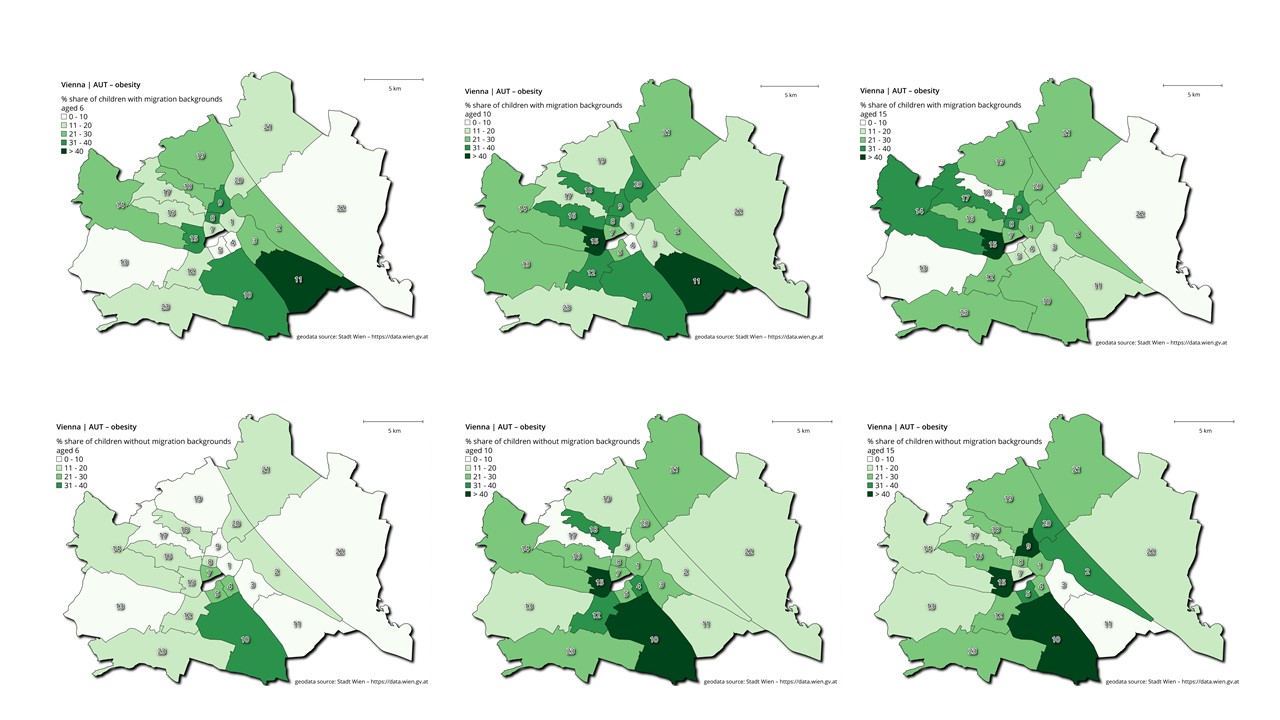
Figure 4 Overweight and obesity rates to migration background for each Viennese district.
Factors associated with weight status during childhood and adolescence
Spearman rank correlations were computed between the BMI of our participants and the
sociodemographic and environmental parameters describing their residence area. The cluster
area correlated significantly with the BMI among all age groups, males and females, as
well as among children with and without a background of migration. Considering individual
social and environmental parameters, BMI was significantly higher with a higher
unemployment rate among 10- and 15-year-olds in the total sample. The rate of mandatory
education only was consistently positively associated with BMI among 15-year-olds in the
total sample, and among males, females, and those with a history of migration. Finally,
population density was positively associated with BMI among 6-year-olds and 15-year-olds,
but not 10-year-olds Mean monthly income, amount of green areas and life expectancy were
significantly negatively correlated with BMI (Table 3).
Table 3 Body mass index and environmental factors according to sex, the background of
migration and age group. Spearman correlations.
|
total |
male |
female |
history of migration |
no history of migration |
| Body mass index |
6a |
10a |
15a |
6a |
10a |
15a |
6a |
10a |
15a |
6a |
10a |
15a |
6a |
10a |
15a |
| Cluster area |
0.12
0.001 |
0.13 0.001 |
0.11
0.001 |
0.14 <0.001 |
0.11
0.014 |
0.14
<0.001 |
0.09
0.017 |
0.12
0.004 |
0.08
0.022 |
0.12
0.002 |
0.14
<0.001 |
0.14
<0.001 |
0.09
0.036 |
0.04
n.s. |
0.05
n.s. |
| rate of University
degree |
0.01
n.s. |
0.04
n.s. |
0.02
n.s. |
0.01 n.s. |
0.01 n.s. |
0.01 n.s. |
0.01 n.s. |
0.03 n.s. |
0.01 n.s. |
-0.05
n.s. |
0.09
0.010 |
-0.09
0.005 |
0.05
n.s. |
0.05
n.s. |
0.05
n.s |
| mandatory education
only |
0.09
0.049 |
0.12
0.001 |
0.10
0.004 |
0.06 n.s. |
0.04
n.s. |
0.11 0.002 |
0.03 n.s. |
0.11
0.020 |
0.09 0.002 |
0.06
n.s. |
0.12
0.003 |
0.12
0.001 |
0.01
n.s. |
0.02
n.s. |
0.01
n.s. |
| unemployment rate |
0.05 n.s. |
0.11
0.003 |
0.09
0.046 |
0.08 0.032 |
0.06 n.s. |
0.10
0.016 |
0.01 n.s. |
0.07
0.044 |
0.04 n.s. |
0.04
n.s. |
0.11
0.007 |
0.09
0.004 |
0.02
n.s. |
-0.01
n.s. |
0.01
n.s. |
| mean age in the
district |
-0.09
0.049 |
-0.05 n.s. |
-0.05 n.s. |
-0.07
0.043 |
-0.04 n.s. |
.0.12 <0.001 |
-0.05
n.s. |
-0.04
n.s. |
-0.03 n.s. |
-0.08
0.022 |
-0.11
0.005 |
-0.08
0.033 |
-0.02
n.s. |
0.05
n.s. |
0.03 n.s. |
| migrant rate |
0.16 <0.001 |
0.16 <0.001 |
0.14
<0.001 |
0.13 <0.001 |
0.10
0.019 |
0.14
<0.001 |
0.09
0.012 |
0.14 <0.001 |
0.10
0.005 |
0.09
0.011 |
0.12
0.002 |
0.12
<0.001 |
0.12
0.017 |
0.05
n.s. |
0.12
0.002 |
| Population density |
0.12
0.002 |
0.03
n.s. |
0.09
0.013 |
0.09
0.017 |
0.03
n.s. |
0.07
0.031 |
0.08
0.028 |
0.04
n.s. |
0.03
n.s. |
0.04
n.s. |
-0.01
n.s. |
0.02
n.s. |
0.09
0.011 |
0.05
n.s. |
0.09 0.025 |
| Mean life
expectancy |
-0.03 n.s. |
0.02
n.s. |
-0.01 n.s. |
-0.01
n.s. |
0.06
n.s. |
-0.01
n.s. |
-0.05
n.s. |
-0.03
n.s. |
-0.01
n.s. |
-0.05
n.s. |
-0.07
n.s. |
-0.05
n.s. |
0.02
n.s. |
0.09
0.018 |
0.04
n.s. |
| Mean income per months
in Euro |
-0.12 0.002 |
-0.10
0.007 |
-0.12
0.002 |
-0.11
0.005 |
-0.05
n.s. |
-0.10
0.003 |
-0.06
n.s. |
-0.09
0.018 |
-0.05
n.s. |
-0.09
0.020 |
-0.13
0.001 |
-0.14
<0.001 |
-0.04
n.s. |
0.01
n.s. |
-0.03
n.s. |
| Green areas |
-0.09
0.002 |
-0.08
0.008 |
-0.08
0.002 |
-0.11
0.004 |
-0.07
0.049 |
-0.08
0.026 |
-0.70
0.049 |
0.09
0.015 |
-0.08
0.024 |
-0.04
n.s. |
-0.04
n.s. |
-0.08
0.037 |
-0.12
0.007 |
-0.09
0.015 |
-0.08
0.032 |
| Social environment |
-0.04
n.,s. |
-0.05
0.045 |
-0.08
0.002 |
-0.04
n.s. |
-0.02
n.s. |
-0.07
0.022 |
-0.04
n.s. |
-0.07
0.045 |
-0.05
n.s. |
-0.06
n.s. |
-0.12
0.003 |
0.11
0.003 |
0.01
n.s. |
0.04
n.s. |
0.03
n.s. |
| Natural environment |
-0.12
<0.001 |
-0.04
n.s. |
-0.07
0.015 |
-0.12
0.002 |
-0.03
n.s. |
-0.08
0.009 |
-0.09
0.023 |
0.04
n.s. |
-0.02
n.s. |
0.04
n.s. |
0.04
n.s. |
0.02
n.s. |
-0.13
<0.001 |
-0.09
0.017 |
-0.12
0.001 |
Principal component analyses
To obtain more information about the structure of exogeneous factors and to reduce the
number of variables, PCA of all 10 social and environmental variables (green areas,
population density, average monthly income, life expectancy, mean age of population, rate
of population with University degree, rate of population with mandatory education only,
unemployment rate, migrant rate, cluster area) describing the residential area of the
participants was computed. After varimax rotation, PCA yielded two components with an
Eigenvalue above 1.0. Component 1 with an Eigenvalue 5.48 represents the “social
environment factor” (SEF) with highest loadings for mean monthly income, the rate of
people with a University degree, the rate of people with compulsory education only, the
unemployment rate, mean life expectancy, mean age in the district, cluster area and the
rate of people with a history of migration. Component 2 with an Eigenvalue 2.52 was
classified as the “natural environment factor (NEF) with highest loadings district,
population density and green areas. Both factors correlated significantly with BMI
(Table 3).
The impact of individual, social and environmental factors on overweight/obesity rate
We computed a binary logistic regression to test association patterns between sex,
background of migration, the social environment factor as well as the natural environment
factor and overweight/obesity for each age group separately. History of migration had a
significant positive impact on overweight/obesity at the ages of 6 and 10 years. The
social environment factor was significantly associated with overweight/obesity at the age
of 10 as well as 15 years. No significant associations with overweight/obesity were found
for sex and the natural environment factor (Table 4).
Table 4 Associations between overweight/obesity and sex, the background of migration,
the social environment factor and the natural environment factor. Binary logistic
regression analyses (normal-weight =1; overweight/obese = 2).
| |
B |
Sig |
95% CI |
B |
Sig |
95% CI |
B |
Sig |
95% CI |
|
6 years |
10 years |
15 years |
| sex |
1.09 |
0.582 |
0.811 – 1.45 |
1.04 |
0.78 |
0.80 – 1.35 |
1.19 |
0.121 |
0.95 – 1.51 |
| history of
migration |
1.17 |
0.049 |
0.99 – 1.39 |
1.14 |
0.048 |
0.98 – 1.33 |
1.06 |
0.440 |
0.92 – 1.21 |
| Social environment
factor |
0.95 |
0.497 |
0.82 -1.10 |
0.86 |
0.033 |
0.75 – 0.99 |
0.88 |
0.029 |
0.78 – 0.99 |
| Natural environment
factor |
0.89 |
0.111 |
0.76 – 1.03 |
0.93 |
0.260 |
0.82 – 1.06 |
0.92 |
0.164 |
0.82 – 1.04 |
Discussion
The present study is the first one on spatial differences of overweight and obesity during
childhood and adolescence in the city of Vienna. Overweight and obesity rates are high in
Austria (Statistik Austria, 2021). According to the
Austrian Nutrition Report 2017 about 40% of the adult Austrian population correspond to the
definition of overweight or obesity (Rust et al.,
2017). This is also true of nearly 26% of children ageing between 7 and 10 years
(Weghuber et al., 2017). Within Austria, regional
differences in the prevalence of childhood overweight/obesity rates have been described. The
western and southern region of Austria showed lower rates of overweight/obesity (25.8%),
while the highest rates are described for the eastern region (29%). This trend was already
described for eighteen years old Austrian conscripts (Rami
et al., 2004). Therefore, it might be assumed, that Vienna, which is located in the
eastern part of Austria, represents a typical obesogenic environment in comparison to the
more rural and alpine central and western parts. This is only partly true, because Vienna is
clearly not a homogenous area. As in any big city, individual districts differ markedly in
terms of geographic aspects, building density and infrastructure, green areas, economic use
and the composition of the population. In addition, districts differ in numerous
socio-economic aspects, which primarily affect rental prices and housing quality and thus
also the population of the districts. Therefore, so-called obesogenic environments are not
found to the same extent in all regions of the city.
In our study, we were able to show very clearly that certain regions in Vienna have
particularly high rates of overweight and obesity among children and young people. Districts
10, 11, 12, 15 and 20, which corresponded to cluster 7 should be mentioned here in
particular, while districts such as 1st, 8th, 13th,
18th and 19th , which corresponded to cluster 1 and 2 have markedly
lower rates of overweight and obesity
.
The observation of especially high rates of overweight and obesity in the 15th
and 12th district correspond to observations reported by Lakes and Burkart (Lakes and Burkart, 2016) for Berlin. We found
particularly high overweight and obesity rates in the inner-city areas (e.g.,
12th and 15th), but not for the outskirts. Lakes and Burkart, who
also reported high rates of childhood overweight and obesity for inner city districts,
explained these spatial distribution patterns against socio-economic factors. They found a
significant association between overweight and obesity and those in areas with low
socioeconomic status and a high proportion of children whose first language was not German
(Lakes and Burkart, 2016).
These results are consistent with observations from numerous other studies (De Spiegelaere et al., 1998; Gose et al., 2013; Knai et al.,
2012; Kurth and Rosario, 2007; Lioret et al., 2009; Sen, 2013; Stamatakis et al., 2010; Sun et al., 2020). Low socioeconomic status and living
in a socially disadvantaged area are major risk factors for obesity among children but also
adults (Gnavi et al., 2000; Haas et al., 2003; Lissner et al.,
2016; Poulsen et al., 2018). On the one
hand, low socioeconomic status influences behavioral aspects in a family such as eating
habits and physical activity patterns. It is well documented, that children growing up in
low income families tend to consume more fast food, more sugar, fats and soft drinks, and
less vegetables, fruits and whole grain products (Mathieson and Koller, 2006); on the other hand, these children are less physically
active (Booth et al., 2001). These characteristics
may be due to the poor accessibility of supermarkets with better and cheaper food choices as
well as a lack of green space in which to play and undertake physical activities.
The association of social parameters and the prevalence of overweight and obesity were also
confirmed in the present study. We found a significant positive correlation between the BMI
and social environment factors such as the unemployment rate, proportion of the adult
population with only a compulsory education, population density and the proportion of people
with a migrant background. In contrast, mean monthly income and the size of green areas in
the district were significantly negatively associated with BMI. This applies to all age
groups, females as well as males, and also children with and without a migrant background.
Considering sex and migrant background, only the latter had a significant impact on the risk
of being overweight or obese. This is in contrast to the results of the Austrian Child and
Adolescent Health Report, which described a higher risk of being overweight or obese for
boys (Weghuber et al., 2017).
According to our results, Viennese regions (such as the 10th, 12th ,
15th and 20th districts) with low socioeconomic status showed higher
rates of overweight and obesity (Boztepe et al.,
2019). This connection is not unexpected. Regions with poor infrastructure, little
green space, poor housing conditions usually have lower rents than districts with a higher
quality of life. People with lower income, low socio-economic status and often a background
of migration settle here. These regions correspond to the definition of an obesogenic
environment. These characteristics are typical risk factors for overweight and obesity among
urban children and adults (Ogden et al., 2018;
Timmermans et al., 2018). Migrant status also
increases the risk of overweight or obesity (Brussaard
et al., 2001; Faskunger et al., 2009;
Kaplan et al., 2004; Kilaf and Kirchengast, 2011; Kirchengast and Schober, 2006; Misra and Ganda,
2007; Singh and Kirchengast, 2011; Wolin et al., 2009). In contrast, neighborhoods
providing a good quality infrastructure, such playgrounds, parks and green areas, regarded
as safe and pleasant, seem to support physical activity and reduce the risk of becoming
overweight or obese (Ding et al., 2011). Living In
these areas is much more expensive. However, in the present study no significant association
between parameters of the natural environment, i.e. green areas, population density and the
risk of being overweight or obese was observed. The social environment, on the other hand,
had an independently significant impact on the risk of being overweight or obese in
10-year-olds and 15-year-olds. At the age of 6, on the other hand, only migrant background
had a significantly positive influence on whether one was overweight or obese.
High rates of overweight and obesity in socially disadvantaged areas are to be expected;
consequently, lower rates of obesity should occur in more well-off urban districts. This was
also true of the present study. Quite low rates of overweight/obesity could be documented
for the 1st, 13th, 18th or 19th district. In
these upper-class districts not only is the quality of life higher, but also mean life
expectancy is more than 7 years longer than in the 15th, 12th,
17th or 20th districts (Bachinger,
2003; Statistik Austria, 2021).
Furthermore, the mean monthly income is more than 1200€ higher in the 1st
district than in the 15th. Therefore, differences in the prevalence of
overweight/obesity between socially disadvantaged and the well-off districts may be
explained by the fact that the children belonged to different social strata of Vienna. In
our study however, this is only partly true. As pointed out earlier, only children and
adolescents attending public secondary schools were included in the sample. Such attendance
is a strong indicator of lower family socioeconomic status. Better-off parents tend to send
their children to a so-called Gymnasium or to private secondary schools. Do children then
with a lower socioeconomic status live in upper-class districts? The explanation for this
phenomenon may be a special kind of social politics in Vienna, which started in the 1920s.
During the post World War 1 economic depression, the Viennese government of the so-called
“Red Vienna” built up so called “Gemeindebauten” which was a special kind of municipal
building all over Vienna. Numerous famous architects such as Adolf Loss, Josef Hofmann or
Margarete Schütte-Lihotzky were involved in their construction. These public sector houses
were erected all over the city in order to enhanced social admixture of the population
(Autengruber and Schwarz, 2013). Currently, there
are more than 220 000 public sector apartments in about 2300 buildings in all Viennese
districts. More than 500 000 people live currently in these buildings. This represents more
than 25% of the Viennese population.
We can assume that this may be the reason why children of low socioeconomic status are
found all over the city of Vienna, and not only in some socially disadvantaged areas. Our
results show that, children of low social status show lower rates of overweight/obesity if
they live and attend school in a better-off area. More green areas, more playgrounds, and
lower environmental stress seem to have a positive effect on body weight. Nevertheless, even
in well-off districts the prevalence rates of overweight/obesity are high in our study. In
more socially disadvantaged environments, increased stress may increase the activity of the
hypothalamic-pituitary-adrenal axis resulting in increased stress hormone levels typical of
obesogenic environments (Congdon, 2019). These
areas are maybe less safe, although really unsafe areas are rare in Vienna.
Our study shows that the main risk factor for developing overweight and obesity during
childhood and adolescence is the social environment of the residential area (Bogin, 2021). Children, who grow up in a socially
disadvantaged area or an obesogenic environment are at higher risk of developing overweight
or obesity. On the other hand, even children with a low socioeconomic status, who grow up in
a better-off area also show lower rates of overweight and obesity. Therefore, an improvement
of the living situation, such as creating even small green areas, playgrounds in socially
disadvantaged densely populated districts in the city center but also special sport programs
in public schools and involving the families in workshops focusing on healthy diet and
leisure time programs may help to reduce the risk of overweight and obesity for children and
adolescents.
Limitations
We are aware that our study has some limitations. On the one hand, this is a
retrospective medical record-based study. The data set was provided by the Viennese
Medical School Authority. Due to data protection regulations, we had access to limited
personal data. We had no information regarding puberty, because no data concerning
menarche or voice breaking was provided. Nor do we have information regarding individual
social status of the participants and could only be reconstructed via school attendance.
Furthermore, the sample size is quite small, only the data of 1611 children could be
included in the analysis. Nevertheless, this is the first study focusing on spatial
differences in overweight/obesity in Vienna.
Acknowledgements
We are gratefully indebted to Stadtphysika i.R. Dr. Lucius and to Prof.Dr.Edith Schober,
University Clinic of Pediatrics, Vienna.
References
Autengruber, P./Schwarz, U. (2013). Lexikon der
Wiener Gemeindebauten – Namen, Denkmäler, Sehenswürdigkeiten. Pichler-Verlag,
Wien.
Bachinger, E. (2003). Lebenserwartung und Mortalität in Wien und
Österreich – Internationaler Vergleich. Gemeinde Wien. Wien, Reumüller &
Reumüller.
Blüher, M. (2019). Obesity: global epidemiology and pathogenesis. Nature
Reviews. Endocrinology 15, 288–298. https://doi.org/10.1038/s41574-019-0176-8
Bogin, B. (2021). Social-Economic-Political-Emotional (SEPE) factors
regulate human growth. Human Biology and Public Health 1. https://doi.org/10.52905/hbph.v1.10
Booth, S.L./Sallis, J.F./Ritenbaugh, C./Hill, J.O./Birch, L.L./Frank,
L.D./Glanz, K./Himmelgreen, D.A./Mudd, M./Popkin, B.M./Rickard, K.A./ St Jeor, S./Hays,
N.P. (2001). Environmental and societal factors affect food choice and physical
activity: rationale, influences, and leverage points. Nutrition Reviews 59, 21-39;
discussion 57-65. https://doi.org/10.1111/j.1753-4887.2001.tb06983.x
Boztepe, K./Hammer, P./König, K. (2019). Migrantinnen und Migranten in
Wien 2019. Stadt Wien – Integration und Diversität.
Brussaard, J.H./van Erp-Baart, M./Brants, H. a. M./Hulshof, K./Löwik,
M.R.H. (2001). Nutrition and health among migrants in the Netherlands. Public Health
Nutrition 4, 659–664. https://doi.org/10.1079/PHN2001149
Chiurazzi, M./Cozzolino, M./Orsini, R.C./Di Maro, M./Di Minno,
M.N.D./Colantuoni, A. (2020). Impact of genetic variations and epigenetic mechanisms on
the risk of obesity. International Journal of Molecular Sciences 21, E9035. https://doi.org/10.3390/ijms21239035
Chooi, Y.C./Ding, C./Magkos, F.(2019). The epidemiology of
obesity. Metabolism 92, 6–10. https://doi.org/10.1016/j.metabol.2018.09.005
Clark, J.M./Brancati, F.L. (2000). The challenge of obesity-related
chronic diseases. Journal of General Internal Medicine 15, 828–829. https://doi.org/10.1046/j.1525-1497.2000.00923.x
Congdon, P. (2019). Obesity and urban environments. International Journal
of Environmental Research and Public Health 16, E464. https://doi.org/10.3390/ijerph16030464
Dahly, D.L./Gordon-Larsen, P./Emch, M./Borja, J./Adair, L.S. (2013). The
spatial distribution of overweight and obesity among a birth cohort of young adult
Filipinos (Cebu Philippines, 2005): an application of the Kulldorff spatial scan
statistic. Nutrition & Diabetes 3, e80. https://doi.org/10.1038/nutd.2013.21
de Smith, M.J./Goodchild, M.F./Longley, P.A. (2021).
Geospatial Analysis 6th Edition, 2021 update. Available online at https://www.spatialanalysisonline.com/HTML/index.html (accessed
11/02/2022).
De Spiegelaere, M./Dramaix, M./Hennart, P. (1998). Social class and
obesity in 12-year-old children in Brussels: influence of gender and ethnic origin.
European Journal of Pediatrics 157, 432–435. https://doi.org/10.1007/s004310050845
Ding, D./Sallis, J.F./Kerr, J./Lee, S./Rosenberg, D.E. (2011).
Neighborhood environment and physical activity among youth a review. American Journal of
Preventive Medicine 41, 442–455. https://doi.org/10.1016/j.amepre.2011.06.036
Dong, Y./Ma, Y./Dong, B./Zou, Z./Hu, P./Wang, Z./Yang, Y./Song, Y./Ma, J.
(2019). Geographical variation and urban-rural disparity of overweight and obesity in
Chinese school-aged children between 2010 and 2014: two successive national
cross-sectional surveys. BMJ Open 9, e025559. https://doi.org/10.1136/bmjopen-2018-025559
Ebbeling, C.B./Pawlak, D.B./Ludwig, D.S. (2002). Childhood obesity:
public-health crisis, common sense cure. Lancet 360, 473–482. https://doi.org/10.1016/S0140-6736(02)09678-2
Faskunger, J./Eriksson, U./Johansson, S.-E./Sundquist, K./Sundquist, J.
(2009). Risk of obesity in immigrants compared with Swedes in two deprived
neighbourhoods. BMC Public Health 9, 304. https://doi.org/10.1186/1471-2458-9-304
Felisbino-Mendes, M.S./Cousin, E./Malta, D.C./Machado, Í.E./Ribeiro,
A.L.P./Duncan, B.B./Schmidt, M.I./Silva, D.A.S./Glenn, S./Afshin, A./Velasquez-Melendez,
G. (2020). The burden of non-communicable diseases attributable to high BMI in Brazil,
1990-2017: findings from the global burden of disease study. Population Health Metrics
18, 18. https://doi.org/10.1186/s12963-020-00219-y
Fernandez-Twinn, D.S./Hjort, L./Novakovic, B./Ozanne, S.E./Saffery, R.
(2019). Intrauterine programming of obesity and type 2 diabetes. Diabetologia 62(10),
1789-1801. https://doi.org/10.1007/s00125-019-4951-9.
Ford, E.S./Mokdad, A.H. (2008). Epidemiology of obesity in the Western
Hemisphere. The Journal of Clinical Endocrinology and Metabolism 93, 1-8. https://doi.org/10.1210/jc.2008-1356
Gemeinde Wien (2013). Sozialraumatlas Wien. Available online at https://www.wien.gv.at/stadtentwicklung.
Gnavi, R./Spagnoli, T.D./Galotto, C./Pugliese/E., Carta, A./Cesari, L.
(2000). Socioeconomic status, overweight and obesity in prepuberal children: a study in
an area of Northern Italy. European Journal of Epidemiology 16, 797–803. https://doi.org/10.1023/a:1007645703292
Gose, M./Plachta-Danielzik, S./Willié, B./Johannsen, M./Landsberg,
B./Müller, M.J. (2013). Longitudinal influences of neighbourhood built and social
environment on children’s weight status. International Journal of Environmental Research
and Public Health 10, 5083–5096. https://doi.org/10.3390/ijerph10105083
Haas, J.S./Lee, L.B./Kaplan, C.P./Sonneborn, D./Phillips, K.A./Liang,
S.-Y. (2003). The association of race, socioeconomic status, and health insurance status
with the prevalence of overweight among children and adolescents. American Journal of
Public Health 93, 2105–2110. https://doi.org/10.2105/ajph.93.12.2105
Han, J.C./Lawlor, D.A./Kimm, S.Y.S. (2010). Childhood obesity. Lancet 375,
1737–1748. https://doi.org/10.1016/S0140-6736(10)60171-7
Hobbs, M./Radley, D. (2020). Obesogenic environments and obesity: a
comment on “Are environmental area characteristics at birth associated with overweight
and obesity in school-aged children? Findings from the SLOPE (Studying Lifecourse
Obesity PrEdictors) population-based cohort in the south of England.” BMC Medicine 18,
59. https://doi.org/10.1186/s12916-020-01538-5
Hu, Y./Lin, W./Tan, X./Liu, Y./Wen, Y./Xing, Y./Ma, Y./Liu, H./Song,
Y./Liang, J./Lam, K.B.H./Lin, S. (2020). Trends in urban/rural inequalities in physical
growth among Chinese children over three decades of urbanization in Guangzhou:
1985-2015. BMC Public Health 20, 1190. https://doi.org/10.1186/s12889-020-09239-7
Jenks, G.F./Caspall, F.C. (1971). Error on choroplethic maps: definition,
measurement, reduction. Annals of the Association of American Geographers 61, 217–244.
https://doi.org/10.1111/j.1467-8306.1971.tb00779.x
Kaplan, M.S./Huguet, N./Newsom, J.T./McFarland, B.H. (2004). The
association between length of residence and obesity among Hispanic immigrants. American
Journal of Preventive Medicine 27, 323–326. https://doi.org/10.1016/j.amepre.2004.07.005
Khan, M.H./Krämer, A. (2014). Are rural-urban migrants living in urban
slums more vulnerable in terms of housing, health knowledge, smoking, mental and general
health? International Journal of Social Welfare 23 (4), 373-383. https://doi.org/10.1111/ijsw.12053
Kilaf, E./Kirchengast, S. (2011). Socio-economic Position and Obesity
among Turkish Migrant Women in Vienna, Austria. Journal of Life Sciences 3, 107–116.
https://doi.org/10.1080/09751270.2011.11885177
Kimm, S.Y.S./Obarzanek, E. (2002). Childhood obesity: a new pandemic of
the new millennium. Pediatrics 110, 1003–1007. https://doi.org/10.1542/peds.110.5.1003
Kirchengast, S./Schober, E. (2009). Growth charts in the globalizing
world: a new challenge for anthropologists and paediatricians? Acta medica Lituanica 16.
https://doi.org/10.2478/v10140-009-0011-y
Kirchengast, S./Schober, E. (2006). To be an immigrant: a risk factor for
developing overweight and obesity during childhood and adolescence? Journal of Biosocial
Science 38, 695–705. https://doi.org/10.1017/S0021932005027094
Knai, C./Lobstein, T./Darmon, N./Rutter, H./McKee, M. (2012).
Socioeconomic patterning of childhood overweight status in Europe. International Journal
of Environmental Research and Public Health 9, 1472–1489. https://doi.org/10.3390/ijerph9041472
Kromeyer-Hauschild, K./Wabitsch, M./Kunze, D./Geller, F./Geiß, H.C./Hesse,
V./von Hippel, A./Jaeger, U./Johnsen, D./Korte, W./Menner, K./Müller, G./Müller,
J.M./Niemann-Pilatus, A./Remer, T./Schaefer, F./Wittchen, H.-U./Zabransky, S./Zellner,
K./Ziegler, A./Hebebrand, J. (2001). Perzentile für den Body-mass-Index für das Kindes-
und Jugendalter unter Heranziehung verschiedener deutscher Stichproben. Monatsschrift
Kinderheilkunde 149, 807–818. https://doi.org/10.1007/s001120170107
Kurth, B.-M./Rosario, A.S. (2007). Die Verbreitung von Übergewicht und
Adipositas bei Kindern und Jugendlichen in Deutschland. Ergebnisse des bundesweiten
Kinder- und Jugendgesundheitssurveys (KiGGS). https://doi.org/10.25646/482
Lakes, T./Burkart, K. (2016). Childhood overweight in Berlin: intra-urban
differences and underlying influencing factors. International Journal of Health
Geographics 15, 12. https://doi.org/10.1186/s12942-016-0041-0
Lasserre, A.M./Chiolero, A./Paccaud, F./Bovet, P. (2007). Worldwide trends
in childhood obesity. Swiss Medical Weekly 137, 157–158. https://doi.org/2007/09/smw-11707
Lieberman, L.S. (2006). Evolutionary and anthropological
perspectives on optimal foraging in obesogenic environments. Appetite 47, 3–9.
https://doi.org/10.1016/j.appet.2006.02.011
Lioret, S./Touvier, M./Dubuisson, C./Dufour,
A./Calamassi-Tran, G./Lafay, L./Volatier, J.-L./Maire, B. (2009). Trends in child
overweight rates and energy intake in France from 1999 to 2007: relationships with
socioeconomic status. Obesity (Silver Spring) 17, 1092–1100. https://doi.org/10.1038/oby.2008.619
Lissner, L./Wijnhoven, T.M.A./Mehlig, K./Sjöberg, A./Kunesova, M./Yngve,
A./Petrauskiene, A./Duleva, V./Rito, A.I./Breda, J. (2016). Socioeconomic inequalities
in childhood overweight: heterogeneity across five countries in the WHO European
Childhood Obesity Surveillance Initiative (COSI-2008). International Journal of Obesity
40, 796–802. https://doi.org/10.1038/ijo.2016.12
Lobstein, T./Baur, L./Uauy, R./IASO International Obesity TaskForce
(2004). Obesity in children and young people: a crisis in public health. Obesity
Reviews: An Official Journal of the International Association for the Study of Obesity 5
Suppl 1, 4–104. https://doi.org/10.1111/j.1467-789X.2004.00133.x
Mathieson, A./Koller, T. (2006). Addressing the socioeconomic determinants
of healthy eating habits and physical activity levels among adolescents. World Health
Organization. Regional Office for Europe.
McLaren, L. (2007). Socioeconomic status and obesity. Epidemiologic
Reviews 29, 29–48. https://doi.org/10.1093/epirev/mxm001
Misra, A./Ganda, O.P. (2007). Migration and its impact on adiposity and
type 2 diabetes. Nutrition 23, 696–708. https://doi.org/10.1016/j.nut.2007.06.008
Mou, J./Griffiths, S.M./Fong, H./Dawes, M.G. (2013). Health of China’s
rural-urban migrants and their families: a review of literature from 2000 to 2012.
British Medical Bulletin 106, 19–43. https://doi.org/10.1093/bmb/ldt016
Ogden, C.L./Fryar, C.D./Hales, C.M./Carroll, M.D./Aoki, Y./Freedman, D.S.
(2018). Differences in Obesity Prevalence by Demographics and Urbanization in US
Children and Adolescents, 2013-2016. JAMA 319, 2410–2418. https://doi.org/10.1001/jama.2018.5158
Ouédraogo, H.Z./Fournet, F./Martin-Prével, Y./Gary, J./Henry, M.C./Salem,
G. (2008). Socio-spatial disparities of obesity among adults in the urban setting of
Ouagadougou, Burkina Faso. Public Health Nutrition 11, 1280–1287. https://doi.org/10.1017/S1368980008002504
Paciorek, C.J./Stevens, G.A./Finucane, M.M./Ezzati, M./Nutrition Impact
Model Study Group (Child Growth) (2013). Children’s height and weight in rural and urban
populations in low-income and middle-income countries: a systematic analysis of
population-representative data. Lancet Glob Health 1, e300-309. https://doi.org/10.1016/S2214-109X(13)70109-8
Peeters, A./Backholer, K. (2014). Prioritising and tackling socio-economic
inequalities in obesity. BMC Obesity 1, 16. https://doi.org/10.1186/s40608-014-0016-2
Penney, T.L./Rainham, D.G.C./Dummer, T.J.B./Kirk, S.F.L. (2014). A spatial
analysis of community level overweight and obesity. Journal of Human Nutrition and
Dietetics 27 Suppl 2, 65–74. https://doi.org/10.1111/jhn.12055
Poulsen, P.H./Biering, K./Winding, T.N./Nohr, E.A., Andersen, J.H. (2018).
How does childhood socioeconomic position affect overweight and obesity in adolescence
and early adulthood: a longitudinal study. BMC obesity 5, 34. https://doi.org/10.1186/s40608-018-0210-8
Pugliese, G./Liccardi, A./Graziadio, C./Barrea, L./Muscogiuri, G./Colao,
A. (2022). Obesity and infectious diseases: pathophysiology and epidemiology of a double
pandemic condition. International Journal of Obesity. https://doi.org/10.1038/s41366-021-01035-6
Rami, B./Schober, E./Kirchengast, S./Waldhör, T./Sefranek, R. (2004).
Prevalence of overweight and obesity in male adolescents in Austria between 1985 and
2000. A population based study. Journal of pediatric endocrinology & metabolism 17,
67–72. https://doi.org/10.1515/jpem.2004.17.1.67
Rosario, A.S./Kurth, B.-M./Stolzenberg, H./Ellert, U./Neuhauser, H.
(2010). Body mass index percentiles for children and adolescents in Germany based on a
nationally representative sample (KiGGS 2003-2006). European Journal of Clinical
Nutrition 64, 341–349. https://doi.org/10.1038/ejcn.2010.8
Rust, P./Hasenegger, V./König, J. (2017). Österreichischer
Ernährungsbericht. Ministerium für Frauen und Gesundheit, Wien. Available online at
https://broschuerenservice.sozialministerium.at.
Sawadogo, W./Tsegaye, M./Gizaw, A./Adera, T. (2022). Overweight and
obesity as risk factors for COVID-19-associated hospitalisations and death: systematic
review and meta-analysi. BMJ Nutrition, Prevention & Health 5. https://doi.org/10.1136/bmjnph-2021-000375.
Sen, G.S. (2013). Grundauswertung der Einschulungsdaten in Berlin 2012.
Available online at http://www.gsi-berlin.info.
Shen, C./Zhou, Z./Lai, S./Tao, X./Zhao, D./Dong, W./Li, D./Lan, X./Gao, J.
(2019). Urban-rural-specific trend in prevalence of general and central obesity, and
association with hypertension in Chinese adults, aged 18-65 years. BMC Public Health 19,
661. https://doi.org/10.1186/s12889-019-7018-4.
Singh, M./Kirchengast, S. (2011). Obesity prevalence and nutritional
habits among Indian women: A comparison between Punjabi women living in India and
Punjabi migrants in Vienna, Austria. Anthropologischer Anzeiger 68, 239–51. https://doi.org/10.1127/0003-5548/2011/0132.
Spinelli, A./Buoncristiano, M./Kovacs, V.A./Yngve, A./Spiroski, I./Obreja,
G./Starc, G./Pérez, N./Rito, A.I./Kunešová, M./Sant’Angelo, V.F./Meisfjord, J./Bergh,
I.H./Kelleher, C./Yardim, N./Pudule, I./Petrauskiene, A./Duleva, V./Sjöberg,
A./Gualtieri, A./Hassapidou, M./Hyska, J./Burazeri, G./Petrescu, C.H./Heinen, M./Takacs,
H./Zamrazilová, H./Bosi, T.B./Sacchini, E./Pagkalos, I./Cucu, A./Nardone, P./Gately,
P./Williams, J./Breda, J. (2019). Prevalence of Severe Obesity among primary school
children in 21 european countries. Obesity Facts 12, 244–258. https://doi.org/10.1159/000500436.
Stadt Wien (2021). Landesgrenze Wien: Politische Landesgrenze von Wien.
Available online at https://www.spatialanalysisonline.com/HTML/index.html?classification_and_clustering.htm.
Stadt Wien (2020). Politische Landesgrenze und Bezirksgrenzen von Wien.
Available online at https://www.data.gv.at/katalog/dataset/2ee6b8bf-6292-413c-bb8b-bd22dbb2ad4b.
Stadt Wien, Wirtschaft, Arbeit und Statistik 2020. Statistik Wien (2020).
Available online at https://www.wien.gv.at/statistik/.
Stamatakis, E./Wardle, J./Cole, T.J. (2010). Childhood obesity and
overweight prevalence trends in England: evidence for growing socioeconomic disparities.
International Journal of Obesity 34, 41–47. https://doi.org/10.1038/ijo.2009.217.
Statistik Austria (2021). Demographic Yearbook. Bundesanstalt Statistik,
Vienna. Verlag Österreich GmbH.
Sun, Y./Hu, X./Huang, Y./On Chan, T. (2020). Spatial patterns of childhood
obesity prevalence in relation to socioeconomic factors across England. ISPRS
International Journal of Geo-Information 9, 599. https://doi.org/10.3390/ijgi9100599
Swinburn, B./Egger, G./Raza, F. (1999). Dissecting obesogenic
environments: the development and application of a framework for identifying and
prioritizing environmental interventions for obesity. Preventive Medicine 29, 563–570.
https://doi.org/10.1006/pmed.1999.0585
Thaker, V.V. (2017). Genetic and epigenetic causes of obesity. Adolescent
Medicine: State of the Art Reviews 28, 379–405.
Timmermans, J./Dijkstra, C./Kamphuis, C./Huitink, M./van der Zee,
E./Poelman, M. (2018). “Obesogenic” school food environments? An urban case study in The
Netherlands. International Journal of Environmental Research and Public Health 15, E619.
https://doi.org/10.3390/ijerph15040619
Wang, Y.C./McPherson, K./Marsh, T./Gortmaker, S.L./Brown, M. (2011).
Health and economic burden of the projected obesity trends in the USA and the UK. Lancet
378, 815–825. https://doi.org/10.1016/S0140-6736(11)60814-3
Weghuber, D./Maruszczak, K./Schindler, K./Sulz, I./Purtscher, A.E./Pail,
E. (2017). Childhood Obesity Surveillance Initiative (COSI) Bericht
Österreich.
WHO (2021). Obesity and overweight. Available online at https://www.who.int/news-room/fact-sheets/detail/obesity-and-overweight
(accessed 11/02/2022).
Withrow, D./Alter, D.A. (2011). The economic burden of obesity worldwide:
a systematic review of the direct costs of obesity. Obesity Reviews 12, 131–141.
https://doi.org/10.1111/j.1467-789X.2009.00712.x
Wolin, K.Y./Colangelo, L.A./Chiu, B.C.-H./Gapstur, S.M. (2009). Obesity
and immigration among Latina women. Journal of Immigrant and Minority Health 11,
428–431. https://doi.org/10.1007/s10903-007-9115-1