Growth and Public Health Concerns
Proceedings of the 29th Aschauer Soiree, held at Krobielowice, Poland,
November 20th 2021
Michael Hermanussen ✉
✉
Aschauhof 3, 24340 Eckernförde – Altenhof, Germany.
Christiane Scheffler
University of Potsdam, Human Biology, 14469 Potsdam, Germany.
University of Potsdam, Human Biology, 14469 Potsdam, Germany.
Sonja Böker
University of Potsdam, Human Biology, 14469 Potsdam, Germany.
University of Potsdam, Bioinformatics, 14476 Potsdam-Golm, Germany.
Sylvia Kirchengast
University of Vienna/Department of Evolutionary Anthropology, 1090 Vienna,
Austria.
Dominik Hagmann
University of Vienna/Department of Evolutionary Anthropology, 1090 Vienna,
Austria.
Lidia Lebedeva
Public Opinion Foundation, Moscow, Russia
Elena Godina
Institute & Museum of Anthropology, Lomonosov Moscow State University,
Moscow 125009, Russia.
Aleksandra Gomula
Department of Anthropology, Hirszfeld Institute of Immunology and
Experimental Therapy, Polish Academy of Sciences, 50–449 Wroclaw, Poland.
Jan M. Konarski
Poznań University of Physical Education, Department of Theory of Sport,
Poznań,Poland.
Ankara University, Faculty of Languages, History and Geography, Department
of Anthropology, Sub-Department of Physical Anthropology, 06100 Ankara, Turkey
Başak Koca Özer
Ankara University, Faculty of Languages, History and Geography, Department
of Anthropology, Sub-Department of Physical Anthropology, 06100 Ankara, Turkey
Janina Tutkuviene
Department of Anatomy, Histology and Anthropology, Institute of Biomedical
Science, Faculty of Medicine, Vilnius University, Vilnius, Lithuania.
Department of Anatomy, Histology and Anthropology, Institute of Biomedical
Science, Faculty of Medicine, Vilnius University, Vilnius, Lithuania.
Dziugile Kersnauskaite
Department of Anatomy, Histology and Anthropology, Institute of Biomedical
Science, Faculty of Medicine, Vilnius University, Vilnius, Lithuania.
Arup Ratan Bandyopadhyay
Department of Anthropology, 35, Ballygunge Circular Road, Kolkata, 700019,
India.
Slawomir Koziel
Department of Anthropology, Hirszfeld Institute of Immunology and
Experimental Therapy, Polish Academy of Sciences, 50–449 Wroclaw, Poland.
DOI: https://doi.org/10.52905/hbph2022.1.30
Abstract
Seventeen scientists met for this year’s conference on Auxology held at Krobielowice
castle, Poland, to discuss growth and public health concerns. The regulation of growth is
complex. Besides metabolic and endocrine components including hypothalamic releasing
hormones, growth hormone, and multiple downstream effectors, the regulation comprises the
full spectrum of upstream influencers coming from the psychosocial, economic, and
emotional environment including signaling dominance, competence, prestige, or
subordination and indulgence, all of this being sensitive to urban or rural lifestyle, the
political climate, and with marked plasticity throughout history. New statistical
techniques (St. Nicolas House Analysis) are presented for analyzing anthropometric
variables for public health concerns. The impact of spatial differences on developmental
tempo, growth in height, and the prevalence of childhood obesity are discussed as well as
the impact of social mobility on obesity, and the benefits of the biopsychosocial status
when getting along with socio-economic disasters and the COVID-19 pandemic.
Keywords: dominance, prestige, nutrition, spatial difference, developmental tempo
Conflict of Interest: There are no
conflicts of interest.
Citation: Hermanussen, M. et al. (2022). Growth and Public Health Concerns. Human Biology and Public Health 1. https://doi.org/10.52905/hbph2022.1.30.
Copyright: This is an open access article distributed under the terms of the Creative Commons Attribution License which permits unrestricted use, distribution, and reproduction in any medium, provided the original author and source are credited.
Received: 06-02-2022 | Accepted: 24-02-2022 | Published: 14-09-2022
Take home message for students
The regulation of growth does not only include metabolic and endocrine components, but
comprises the psychosocial, economic and emotional environment, and is sensitive to
lifestyle and the political climate.
Contents
Proceedings
Seventeen scientist met for this year’s conference on Auxology (Hermanussen et al. 2021b; Scheffler
et al. 2021b) held at Krobielowice castle, Poland, to discuss growth and public
health concerns. The regulation of growth is complex. Besides metabolic and endocrine
components including hypothalamic releasing hormones, growth hormone, and multiple
downstream effectors, the regulation comprises the full spectrum of upstream influencers
coming from the psychosocial, economic, and emotional environment including signaling
dominance, competence, prestige, or subordination and indulgence.
Michael Hermanussen discussed arithmetic dilemmas when calculating the prevalence of
thinness, overweight, and obesity in populations that are shorter or taller than the growth
references used for that particular population. Based on virtual child populations with
normally distributed height and weight he showed that body mass index (BMI)-for-age z-scores
(BAZ) depend on height and age (Hermanussen et al.
2022). In short children (mean height for age z-scores (HAZ) = -2 to -3, the
prevalence of thinness when defined by BAZ, falls to less than 1% in the youngest children,
and rises up to 11% (mean HAZ=-2) and up to 14% (mean HAZ=-3) at age 10 years. At the same
time, the prevalence of obesity rises to up to 7% in the shortest and youngest, and falls
close to zero at age 10 years indicating that the nutritional status of children from very
short or very tall populations is prone to be seriously misclassified. This dilemma
represents a significant public health concern, and appears to particularly affect the very
young children within very short populations.
Christiane Scheffler presented considerations regarding a universal “motivation to grow”
based on a recent study among 30 male and 54 female young adult Vietnamese migrants in
Germany (Scheffler et al. 2021a). Migrants have
been shown to adjust in height to their host communities (Bogin et al. 2018) due to multiple social-economic-political and emotional (SEPE)
factors (Bogin 2021). This was also true for young
adult Vietnamese migrants who were significantly taller than their parents (women 3.85 cm,
men 7.44 cm), and almost fully attain the height of their German peers. Particularly height
of their best friends and the anticipated desired adult height at age 13 years appeared
important. The author then outlined the complex feedback mechanism that regulates child and
adolescent growth and includes the endocrine arm of the feedback circle and the social arm
(Figure 1). The common concept of understanding the regulation of growth starts with the
release of so-called hypothalamic releasing hormones: the stimulating growth hormone
releasing hormone (GHRH) and the inhibiting somatostatin. These neuropeptides then regulate
growth hormone secretion and downstream, insulin-like growth factors and metabolism. This
understanding, however, appears to be only part of the full regulatory circle as it lacks
the impact of psychological and social effects. Acquiring social status and individual
positioning within a social network is essential, and it requires signaling. Signaling
dominance, competence, and prestige, or subordination and indulgence depends on the
appropriate signals among which physical body size and behavioral features are of greatest
importance. Recent work on intermale aggression to establish social rank suggests that
dopamine transporter-expressing neurons in the hypothalamic ventral premammillary nucleus
(PMvDAT neurons) organize goal-oriented aggression in male mice. Activation of these neurons
triggers attack behavior (Stagkourakis et al.
2018); but the same neurons are also key integrative nodes for metabolic cues and
project to and directly stimulate kisspeptin and gonadotropin releasing hormone (GnRH)
neurons (Lee et al. 2021). Although PMvDAT neurons
stay in close local vicinity to those arcuate nucleus neurons that release GHRH, the details
of these neuronal circuits still remain to be elucidated. Currently available data thus
strongly suggest that the socio-endocrine regulation of growth is driven by social cues, and
the balance or imbalance of self-esteem within the social network.
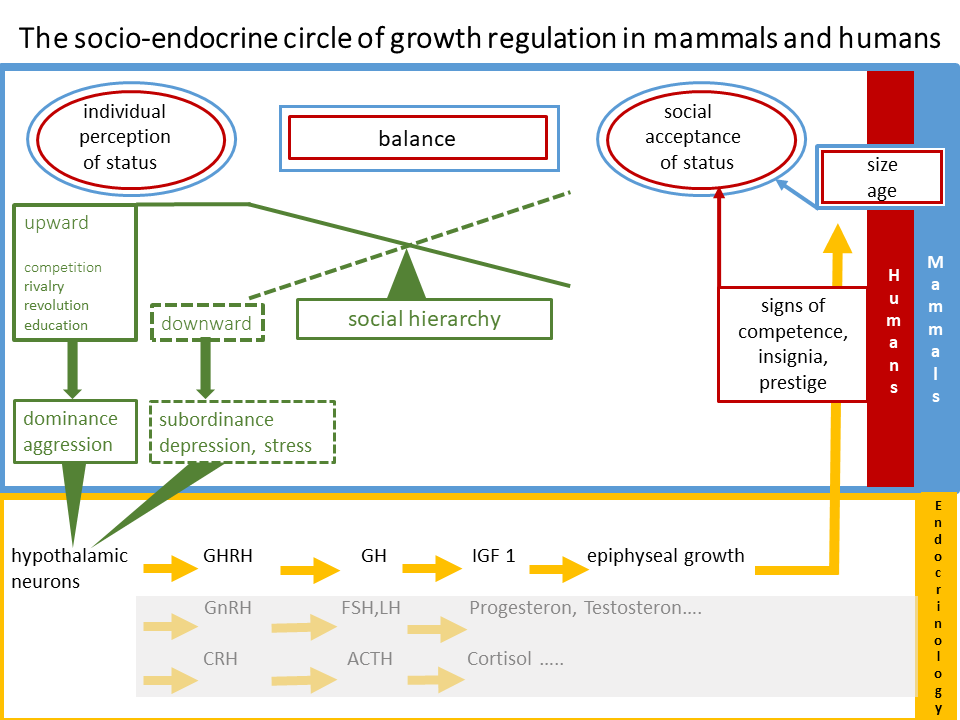
Figure 1 The socio-endocrine circle of growth regulation. Signals of dominant or
subordinate behavior passing through hypothalamic neurons transmit the appropriate
growth impulse via growth hormone releasing hormone (GHRH), growth hormone (GH) and
insulin-like growth factor (IGF) 1 to the epiphyseal growth plate. Growth in height
results to that physical size which dispatches the corresponding social signal of
competence and prestige, or inaptitude. The physical signal either reflects, or rather
does not reflect the balance between self-perception and social acceptance. Interacting
with social and environmental, as well as political and emotional cues, this balance
will then result in behavioral responses within the social hierarchy that close the
socio-endocrine circle of growth regulation.
Liza Wilke compared historic height and weight of 6 and 7 year old Munich school girls of
different socio-economic background from 1914 (Dikanski
1914), with German reference data from the 1980s (Greil 1988), and modern WHO references (Wilke et
al. 2022). Girls of the affluent class were on average 5.23cm and 1.7kg
(6-year-old) and 7.7cm and 3kg (7-year-old) shorter and lighter than German children in the
1980s, and 3 cm and 0.7kg (6-year-old) and 5cm and 1,8kg (7-year-old) shorter and lighter
than WHO references. Even under optimum environmental conditions, urban children from 1914
did not reach the average of modern children. İn addition, the author showed that the
historic body weight distributions did not follow modern references either. In contrast to
current wisdom – body weight is supposed to be skewed to the right – historic weights
followed a symmetric Gaussian distribution in affluent as well as middle and working class
children.
Sonja Böker (Böcker et al. 2022) discussed whether
skeletal age is the only appropriate measure to validate biological age based on dental,
skeletal and height data. The data were derived from N=6529 middle socio-economic status
(SES), N=736 low-middle SES, N=3653 low SES Ladino, and N=4587 low SES Maya boys from
Guatemala, aged between 7 and 12, collected between the 1970s and 1990s. Low SES Mayas are
short. Their shortness is associated with very poor social conditions (Bogin and MacVean 1984) and closely corresponds with the delay in
skeletal age. Yet, the correlations between height and dental maturation and dental
maturation and skeletal age were low and explained less than 10 % of the variance in height.
The author concluded that dental development is regulated by different mechanisms than
skeletal development and growth and matures at a different pace. Tooth eruption is sensitive
to nutritional status, whereas skeletal age appears more sensitive to the socioeconomic
background.
Detlef Groth presented a graphical user interface to the St. Nicolas House Algorithm (Hermanussen et al. 2021) as only few people appear
to be acquainted with the statistical software R that at this moment is exclusively used for
this type of analysis. Using the graphical interface only requires a standard R
installation; the R-script is embedded for MacOSX and Linux as an easy to use single file
executable, while Windows provides an installer using NSIS. The user interface is built
using R's tcltk package. Data may then be loaded from Excel and Tab files. Currently, main
features are available, with a flexible selection of correlation methods, p-values and
bootstrapping. Results can be reported as Excel-files, graphics can be saved as PDF
files.
Sylvia Kirchengast and Dominik Hagmann presented a study on spatial differences on the
prevalence of childhood obesity in Vienna, Austria. In recent years, the impact of
environmental factors has increasingly come into focus (Townshend and Lake 2017). Safe neighborhoods provide a range of local facilities
within walking and cycling distance, with good quality infrastructure, such as
well-maintained pavements. They reduce the risk of overweight and obesity, in contrast to
so-called obesogenic environments (Hobbs and Radley
2020) that are mainly found within urban centers. Advancing urbanization has
dramatically altered the living situation as well as human behavior along with the health
situation and disease burden, but little is known about the intra-urban differences in
childhood obesity rates (Lakes and Burkart 2016).
As part of a cooperation project starting in 1994 at the University Clinic for Pediatrics,
Medical University of Vienna, the authors analyzed intra-urban patterns of childhood
overweight and obesity in Vienna in view of the socio-demographic environment. Based on
medical record-based data sets, 46 public secondary schools were randomly selected, with
1611 children aged 6, 10, and 15 years. The urban structure varied widely across the 23
districts and included densely populated areas in the city center, as well as single family
homes in the suburban areas. The population was extremely heterogeneous with about 47%
having a migratory background. 55% of children between 6 and 16 years did not speak German
at home. The study demonstrated distinct spatial differences in the distribution of
overweight/obesity during childhood and adolescence within the city. A large share of the
intra-urban distribution was explained by spatial differences in socio-economic parameters,
first of all by the percentage of migrants in the area. The highest rates of childhood and
adolescent overweight/obesity were found in the 10th and 15th
districts, both characterized by very low SES, poorer living conditions, and a high rate of
inhabitants with a migratory background. The prevalence of overweight and obesity among
children and adolescents who lived in ”wealthier” districts and cluster areas, was lower
even when these children belonged to the lower social strata.
Lidia Lebedeva and Elena Godina studied regional differences in the tempo of secular growth
changes during the 19th and 20th centuries in different areas of
Russia and neighboring countries. They hypothesized that there were some areas with stable
short and tall statures. They used datasets with as a large number of territorial units of
the country as possible (Anuchin 1889; Bunak 1932;
Purundzhan 1978). The authors added new sources of
information obtained from the RLMS HSE (The Russia Longitudinal Monitoring Survey - Higher
School of Economics https://rlms-hse.cpc.unc.edu/)
dataset. In contrast to the former, the latter data consisted of recall information on
height. Regions with predominantly tall stature were identified: near the Baltic Sea and
Saint Petersburg and between the contemporary cities of Kiev and Krasnodar. Regions with
predominantly short stature were found in the central part of the Volga River region. This
was confirmed in both the historic and the contemporary datasets. Secular changes in height
for different regions and time periods were uneven, which may be connected with the
different ethnic composition of the studied populations and different socioeconomic and
demographic variables (Table 1). For most of the examined regions the biggest increase in
height occurred either after World War II, or at the end of the 20th century.
Table 1 Changes in male height (aged 22-35 years) according to selected regions and time
periods (only Russian participants except for Kiev/Ukraine).
| Changes in height (cm) |
All data
(average values) |
Kiev region* |
Moscow region |
Saint-Petersburg region |
Tula region |
Krasnodar region |
Stavropol region |
Saratov region |
Tambov region |
Penza region |
Orenburg region |
Perm region |
Vladivostok region |
Birth cohorts from 1853-1863 to
1906-1909
(years 1880’s-1930’s) |
3.1 |
3.1 |
3 |
2.1 |
2.6 |
2.1 |
3 |
3.3 |
3.5 |
3.1 |
3.8 |
1 |
3.9 |
Birth cohorts from 1906-1909 to
1952-1956
(years 1930’s-1970’s) |
3.1 |
5.3 |
5.5 |
5.7 |
6.7 |
5.6 |
4.6 |
4.7 |
2.5 |
6.7 |
3.7 |
2.9 |
1.7 |
Birth cohorts from 1952-1956 to
1961-1996
(years 1970’s-2000’s) |
6.5 |
3.7 |
6.1 |
5.3 |
6.2 |
2.6 |
3.2 |
5 |
8.1 |
1 |
6.4 |
8.2 |
7.2 |
| Total increase |
12.7 |
12.1 |
14.6 |
13.1 |
15.5** |
10.3 |
10.8 |
13 |
14.1 |
10.8 |
13.9 |
12.8 |
12.8** |
Aleksandra Gomula presented data on maturation and physical performance in children exposed
to lead. Lead exposure is known for its growth inhibiting and neurotoxic effects, including
reduced head growth and impaired intellectual, neuropsychological, and behavioral
functioning. Blood lead levels should range <5μg/dL (https://www.cdc.gov/nceh/lead/prevention/blood-lead-levels.htm). Yet, higher
levels of blood lead concentrations are often found in areas with metallurgical and mining
industries, such as in the Copper Basin in Poland (Nowak-Szczepanska et al. 2021). The present study included over 1140
school-children aged 7-16 years (mean age=10.8, SD=2.54) from Polkowice town. However, the
exact number and age range varied depending on the trait studied and the year of study.
Polkowice community is known to be one of the richest communities in Poland and homogeneous
in terms of SES. The children were divided into two groups: ≤3.7μg/dL, and >3.7μg/dL,
based on median value of blood lead level in 2008. Studies conducted in 1996 and 2008
revealed that children with higher blood lead levels were significantly slimmer than those
less exposed. Children, with lower body weight, lower skinfold thickness, lower mid-upper
arm circumference, lower BMI (Nowak-Szczepanska et al.
2021), and lower hand grip strength (p<0.001), the latter irrespective of sex,
age and BMI; differences in height were insignificant. Also, age at menarche, obtained by
the status quo method, was significantly delayed in the lead exposed group, with 12.6±1.3
years for girls <3.7µg/dl and 12.9±1.1 years for girls ≥3.7µg/dl (p<0.01) (Gomula et al. 2022) Gomula concluded that even
currently accepted blood lead levels of 5μg/dL should still be considered conspicuous as
they may imply harmful effects on growth and development of children and young
adolescents.
Jan M. Konarski presented a study on secular changes in height and weight in school
children and adolescents, aged 7-15 years of 10 rural communities of West-central Poland
between 1986 and 2016 (Bartkowiak et al. 2021), with
particular emphasis on changes within each of the communities. In the four surveys the
samples consisted of 1417 boys and 1326 girls in1986, of 979 boys and 947 girls in 1996, of
871 boys and 843 girls in 2006, and of 1189 boys and 1105 girls in 2016. Konarski considered
the increments in height, weight and BMI in each village over 30 years relative to the
height, weight and BMI in 1986 in each of the villages. He used sex- and village-specific
ANCOVAs across surveys, with age and age squared as covariates. Age-adjusted means were
plotted subsequently and sex-specific correlations between gains in each community across
1986-2016 and size at baseline (1986). He included partial correlations controlling for
geographic distance from Poznań and population growth. Table 2 illustrates the correlations
between mean increments in height, weight and BMI from 1986 to 2016 in each of the 10 rural
communities with the baseline values in 1986.
Table 2 Correlations and partial correlations controlling for the geographic distance from
Poznań, population growth (1986-2016), and both distance and population growth for each
community (*p<0.05, **p<0.01).
|
Gains 1986-2016 |
| Ht/Wt/BMI in 1986 |
Height |
Weight |
BMI |
| BOYS |
-0.62 |
-0.94** |
-0.51 |
| Control distance |
-0.45 |
-0.92** |
-0.52 |
| Control pop growth |
-0.37 |
-0.93** |
-0.54 |
| Control pop & dist |
-0.34 |
-0.92** |
-0.50 |
|
|
|
|
| GIRLS |
0.29 |
-0.42 |
-0.75* |
| Control distance |
0.34 |
-0.41 |
-0.76* |
| Control pop growth |
0.29 |
-0.41 |
-0,76* |
| Control pop & dist |
0.52 |
-0.36 |
-0.74* |
Konarski concluded that the relation between increments in weight and BMI over 30 years and
size at baseline (1986) were negative and moderate-to-high in boys and girls; those for
height were moderate and negative in boys and low and positive in girls. The correlations
between increments over 30 years with the geographic distance from Poznań and population
growth did not consistently influence the observed relationships.
During the growth period from early childhood to the end of adolescence, changes occur in
the size and proportions of the lower and upper segments, and thus boys and girls grow at
different paces. Ayşegül Özdemir Başaran and Başak Koca Özer presented a study that aimed at
evaluating the height, and the upper and lower segment measurements of children and
adolescents from Turkey. The cross-sectional survey was conducted on 1,484 (761 boys and 723
girls) schoolchildren aged 6-17 years living in Ankara, the capital city. Within the scope
of the study, height, forearm, and lower leg length measurements were taken, following the
standard protocols, and the tibio-radial index was calculated. According to the results,
until the ages of 9-11 years, similar values were observed in both sexes, while the mean
values are higher in boys afterwards and both the forearm and lower leg values differed
significantly between sexes after the age of 13 (Table 3). Due to the significant increase
in the lower leg length, the height values present the same tendency between sexes
(p<0.001). The tibio-radial index showed higher values in both sexes at ages 6 and 7
years. The forearm growth is more pronounced than lower leg growth at these ages. It is
worth mentioning that the higher tibio-radial index values in both sexes at the end of the
growth process are due to the acceleration of growth in the lower leg length. The
tibio-radial indexes differed significantly between the sexes only at the ages of 8 and 12
years (p<0.05). At 8 years, boys' forearms were relatively longer, whereas at 12 years,
boys' lower legs were relatively long. Since the 1970s, the height values for Turkish
children have increased prominently (Günöz et al.
2014), and present findings show a similar tendency: recent forearm, and lower leg
lengths are longer than in former studies. Positive secular increases are related to the
improvement in socio-economic and environmental conditions. In conclusion, the comparison of
the present results with former studies showed a prominent increase for the studied
variables, due to the positive improvements in Turkey for five decades.
Table 3 Anthropometric measurements by age and sex.
| Boys |
Age
(years) |
Height (cm) |
Forearm Length (cm) |
Tibial Length (cm) |
Tibio-radial Index |
| N |
Mean |
SD |
N |
Mean |
SD |
N |
Mean |
SD |
N |
Mean |
SD |
| 6 |
76 |
119.01 |
5.57 |
76 |
17.27 |
1.34 |
76 |
25.41 |
1.81 |
76 |
67.83 |
4.57 |
| 7 |
71 |
124.75 |
5.75 |
71 |
18.04 |
1.40 |
71 |
26.60 |
2.17 |
71 |
68.01 |
7.82 |
| 8 |
72 |
131.53 |
6.26 |
72 |
19.45* |
1.49 |
71 |
28.70 |
2.58 |
71 |
67.47* |
5.31 |
| 9 |
82 |
136.38 |
6.82 |
82 |
20.23 |
1.44 |
82 |
30.53 |
2.54 |
82 |
66.51 |
5.03 |
| 10 |
78 |
141.54 |
7.37 |
78 |
21.18 |
1.65 |
78 |
32.42 |
2.31 |
79 |
65.48 |
4.59 |
| 11 |
67 |
147.51 |
7.85 |
67 |
22.32 |
1.99 |
67 |
33.55 |
2.58 |
67 |
66.41 |
5.03 |
| 12 |
71 |
155.66 |
8.57 |
71 |
23.66 |
1.98 |
71 |
35.64* |
2.54 |
71 |
66.42* |
3.67 |
| 13 |
41 |
159.00 |
9.27 |
41 |
24.29 |
1.92 |
41 |
36.20 |
3.16 |
41 |
67.48 |
5.70 |
| 14 |
36 |
167.94** |
9.36 |
36 |
26.11** |
1.81 |
36 |
39.22** |
3.39 |
36 |
66.82 |
4.92 |
| 15 |
58 |
172.66** |
5.10 |
58 |
26.49** |
1.56 |
58 |
38.94** |
2.14 |
57 |
68.18 |
4.34 |
| 16 |
77 |
175.79** |
5.95 |
77 |
27.22** |
2.09 |
77 |
39.50** |
2.66 |
77 |
68.82 |
5.27 |
| 17 |
41 |
176.32** |
4.83 |
41 |
26.70** |
1.59 |
41 |
39.70** |
24.64 |
32 |
66.87 |
5.83 |
| Girls |
Age
(years) |
N |
Mean |
SD |
N |
Mean |
SD |
N |
Mean |
SD |
N |
Mean |
SD |
| 6 |
70 |
117.25 |
5.5 |
70 |
17.1 |
1.86 |
70 |
25.01 |
1.87 |
70 |
68.42 |
5.82 |
| 7 |
58 |
124.13 |
5.72 |
58 |
17.97 |
1.34 |
58 |
26.73 |
1.92 |
58 |
67.34 |
4.05 |
| 8 |
50 |
130.20 |
6.92 |
50 |
18.84 |
1.45 |
50 |
28.81 |
2.96 |
50 |
65.68 |
4.94 |
| 9 |
50 |
137.02 |
5.56 |
50 |
20.00 |
1.54 |
49 |
30.20 |
1.85 |
50 |
66.67 |
5.08 |
| 10 |
49 |
141.20 |
6.89 |
49 |
21.00 |
1.76 |
49 |
31.96 |
2.53 |
49 |
65.86 |
4.62 |
| 11 |
69 |
148.98 |
7.59 |
69 |
22.36 |
1.71 |
69 |
33.52 |
2.30 |
69 |
66.83 |
4.70 |
| 12 |
53 |
153.84 |
6.22 |
53 |
23.48 |
1.46 |
53 |
34.59 |
1.86 |
53 |
67.93 |
3.62 |
| 13 |
40 |
157.91 |
6.54 |
40 |
24.50 |
1.73 |
40 |
35.33 |
2.11 |
40 |
69.47 |
4.87 |
| 14 |
60 |
161.04 |
5.65 |
60 |
24.36 |
1.55 |
60 |
35.85 |
2.00 |
60 |
68.00 |
3.26 |
| 15 |
107 |
161.63 |
5.67 |
107 |
24.27 |
1.63 |
107 |
36.19 |
2.51 |
107 |
67.04 |
4.69 |
| 16 |
86 |
161.98 |
5.73 |
86 |
24.37 |
1.89 |
86 |
35.95 |
2.32 |
86 |
67.89 |
4.92 |
| 17 |
32 |
162.28 |
6.14 |
32 |
24.14 |
1.84 |
32 |
37.02 |
2.58 |
31 |
65.35 |
5.00 |
Janina Tutkuviene, Simona Gervickaite and Dziugile Kersnauskaite discussed the
biopsychosocial status of adolescents in the light of socio-economic disasters and the
COVID-19 pandemic. The perception of body image is related to biological, psychological,
socioeconomic, and cultural factors. Adolescents are particularly sensitive to the effects
of these factors. The aim of this study was to analyze global studies related to body image
during periods of socioeconomic disasters and pandemics, and to compare the peculiarities of
body image of Lithuanian adolescents in pre-pandemic and pandemic periods. Adolescents aged
16–18 years were investigated using the same methodology in two periods: 2015–2019
(pre-pandemic period; n = 278; paper questionnaire) and 2021 (pandemic period; n = 526;
online questionnaire). The literature analysis showed a lack of research on body image
during socio-economic disasters and pandemics (only a few studies have focused on
adolescent’s body image), although more and more research is being conducted during the
COVID-19 pandemic (Aparicio-Martinez et al. 2019;
Grogan 2021; Hartman-Munick et al. 2020). However, studies differ in methodology; body image
definitions vary from study to study. With a few exceptions, components of body image
(perception of body size and shape, body dissatisfaction) and self-esteem deteriorated
particularly during COVID-19, especially among women and younger people. The changes in the
body image of Lithuanian adolescents during the COVID-19 pandemic were as follows: 1) During
the COVID-19 pandemic, despite an increase in BMI (especially in adolescent girls), a larger
body began to be considered optimal: in girls/boys aged 16-18 years – from 3.3/4,1 to
3.8/4,5 respectively (p < 0.001) and girls/boys aged in 19—20 years – from 3.6/4.4 to
3.9/4.7 respectively (p < 0.01); however, an increase in the number of girls and boys who
were afraid of gaining weight was detected. 2) Self-assessment of various parts of the body
and face was the worst in 2021. 3) In both periods (especially in 2021), of the three
characteristics (body, character, different abilities), adolescents most wanted to change
their body (to achieve a slimmer and more muscular figure). 4) The self-esteem of
adolescents (especially older ones) increased during COVID-19, despite a poorer assessment
of their overall appearance in 2021. Self-esteem did not depend on BMI. However, adolescents
with a higher BMI rated their body worse than other respondents. Thus, it can be concluded
that body perception, body dissatisfaction, and self-esteem are not always directly
interrelated components.
Arup Ratan Bandyopadhyay presented a short overview on Anthropology in Kolkata, India,
since 1921, with research in both natural and social sciences. He gave a brief description
regarding the attempts of his team on the issues of biological anthropology and
social-cultural anthropology.
Sławomir Kozieł presented a study on the social mobility of fathers and the BMI of their
children. Social mobility occurs in socially stratified societies and involves a vertical
(up or down) shift of a person’s position on a scale of attained education or wealth or
power or prestige. Vertical mobility may also occur between generations, where the shift is
measured relative to the position of the subject’s parents or within a single generation,
when the subject moves up or down the scale during his/her adult lifetime. Social status and
mobility have significant indirect impact on a society’s biological well-being and health
status. Previous research (Koziel et al. 2019)
indicated that upward social mobility depending on education, results in taller stature, and
tends to persist into the third generation. The present study extends this research and adds
the effects of social mobility and education on BMI. In order to study social mobility, four
mobility patterns were defined, based on social position of the grandfathers (worker versus
professional), and education of the fathers (basic or vocational versus secondary or
university):
| • | GP- to P- ”Low” SES no changes |
| • | GP- to P+ upward |
| • | GP+ to P- downward |
| • | GP+ to P+ ”High” SES no changes |
where:
| • | GP- grandfather occupation – worker; |
| • | GP+ grandfather occupation – professional; |
| • | P- father education basic or vocational; |
| • | P+ father education – secondary or university. |
Social mobility prompts effects on height and similar effects on BMI. Figure 2 illustrates
mean height and BMI z-scores of boys and girls of the different transition groups. Children
whose grandfathers were workers and whose fathers had basic or vocational education (“Low”
SES no change) were short, with z-scores close to -0.2 and slim. Children whose grandfathers
were workers, but fathers had secondary or university education (upward transition) were
significantly taller and heavier. Children whose grandfathers had a professional occupation,
and whose fathers had secondary education (”High” SES no changes), were tallest and fattest.
Children whose grandfathers had a professional occupation, but whose fathers had only basic
or vocational education (downward transition) were short and slim. The social gradients
appeared more pronounced in boys.
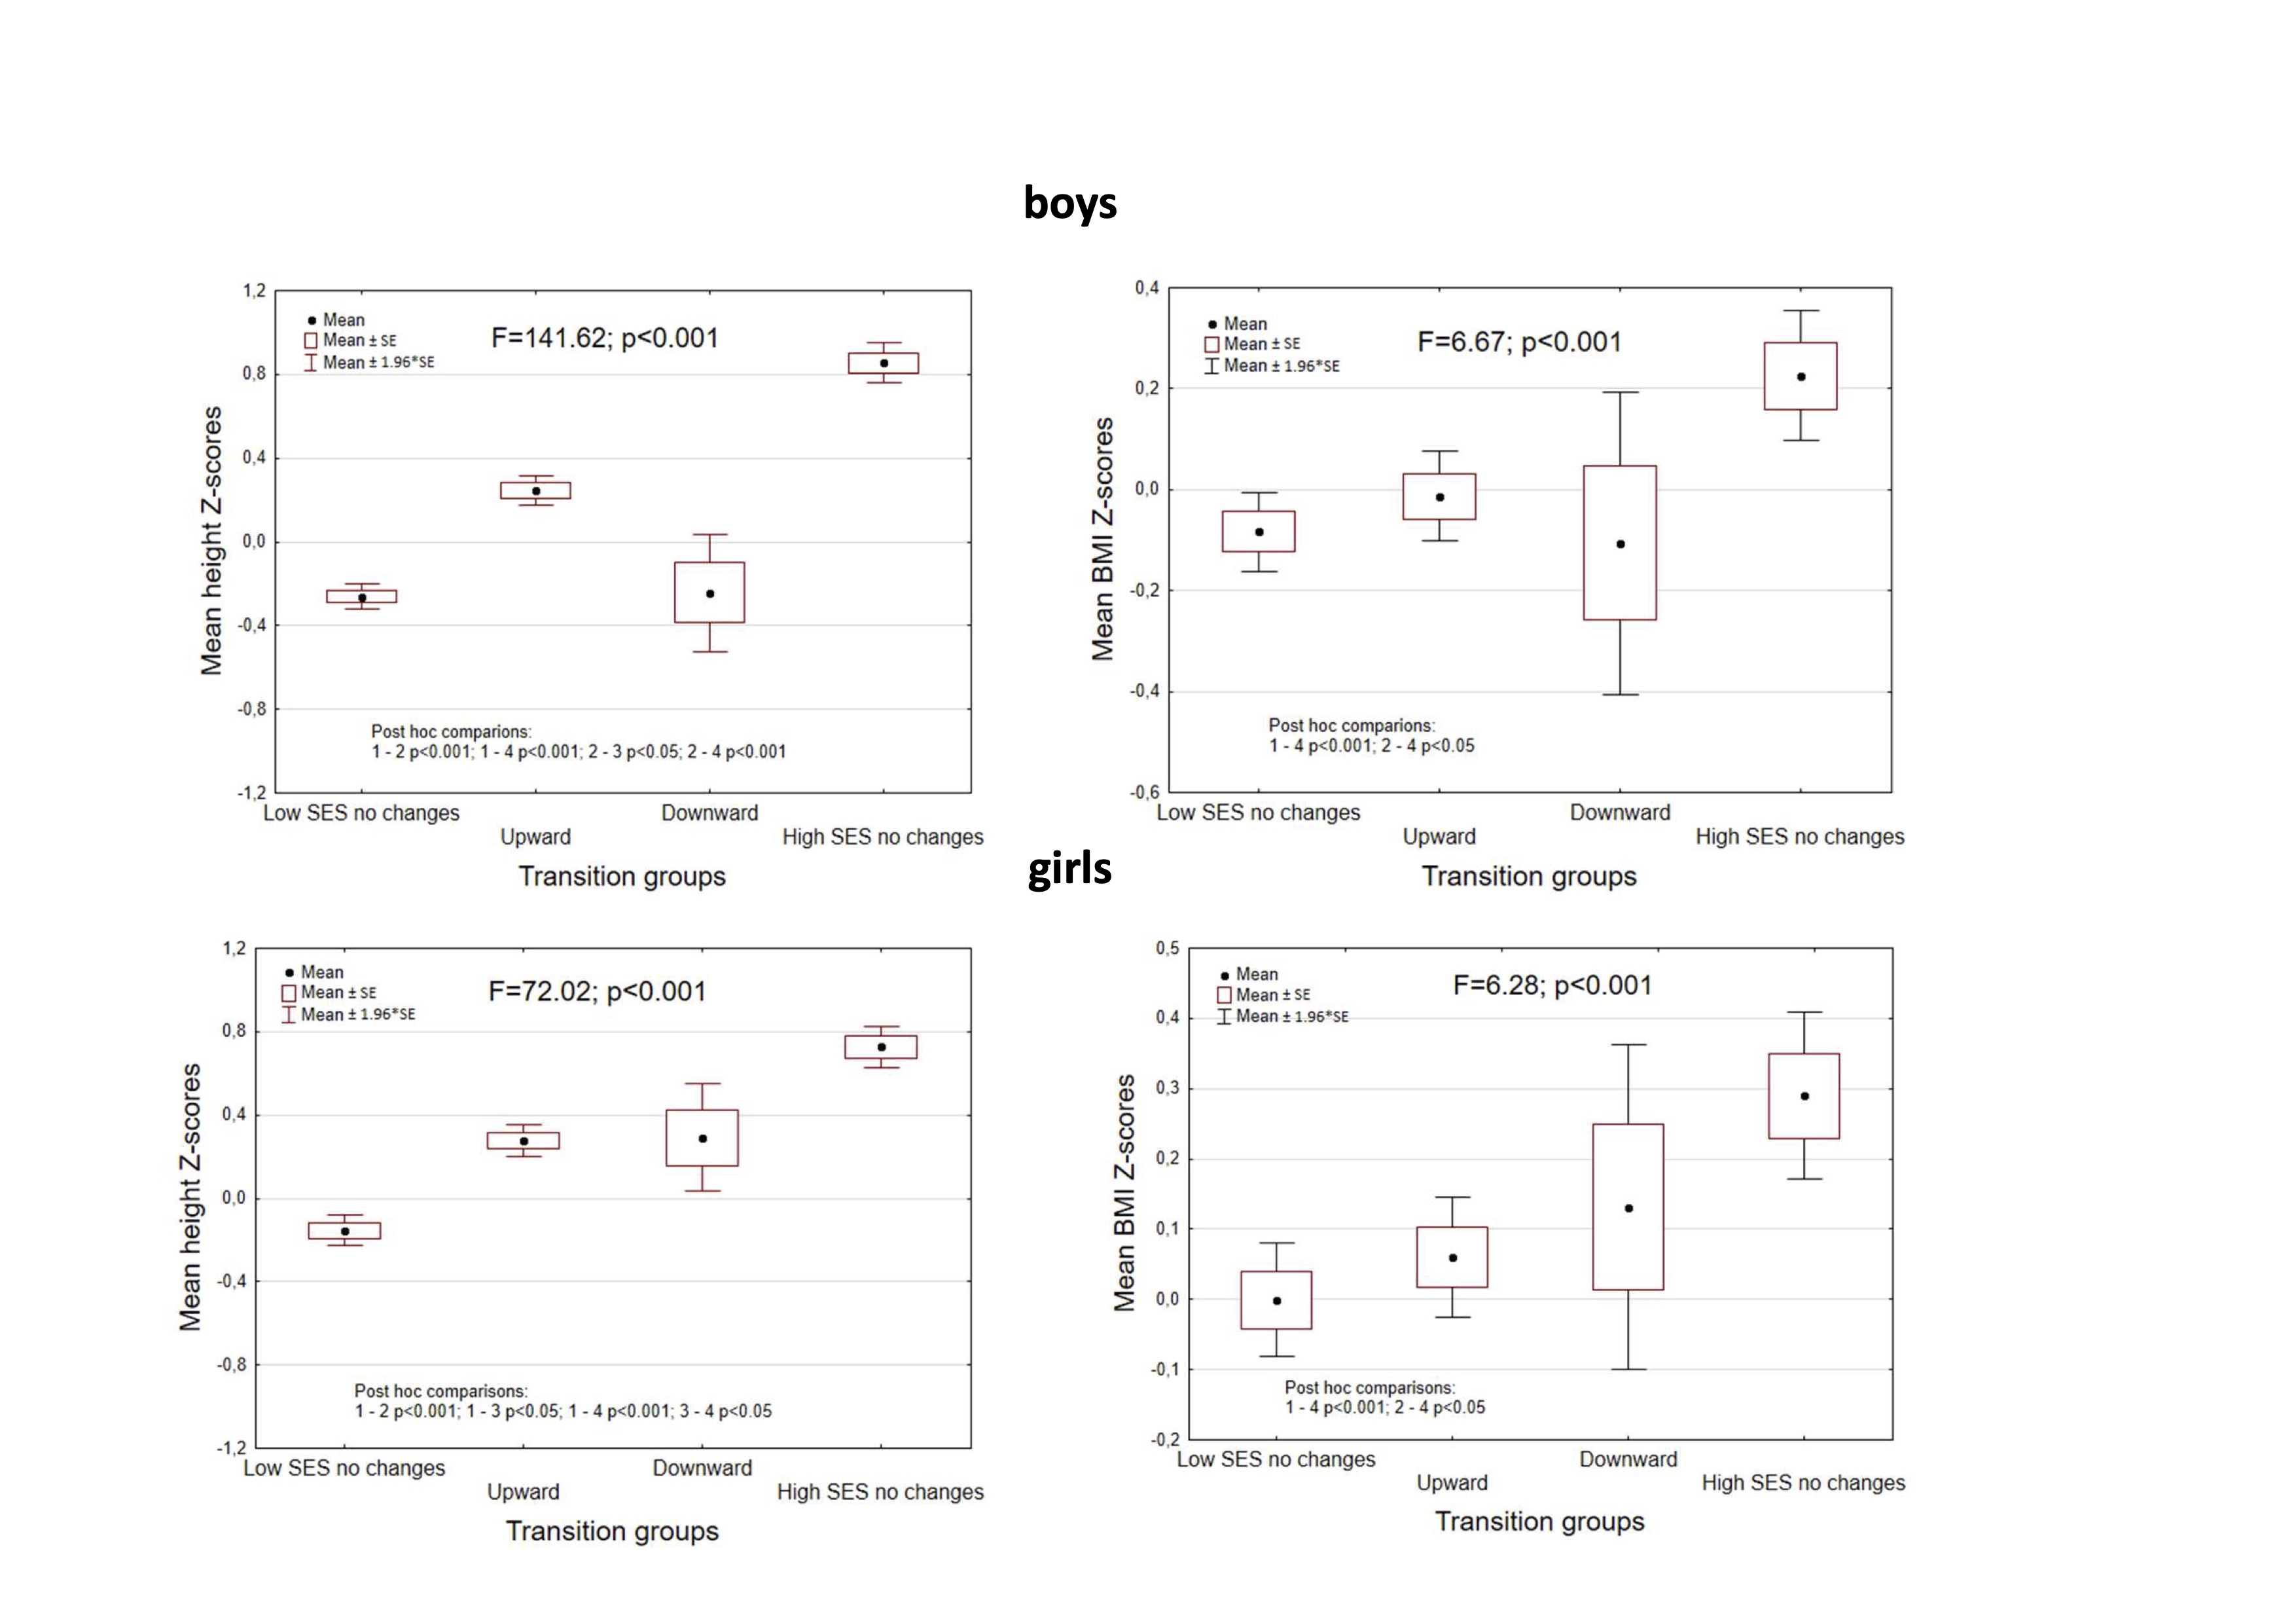
Figure 2 The effects of social mobility on z-scores for height and BMI, in the four
transition groups of boys and girls. Children whose grandfathers were workers and
fathers had basic or vocational education (“Low“ SES no change) were short and slim.
Children whose grandfathers were workers, but fathers had secondary or university
education (upward transition) were taller and heavier. Children whose grandfathers had a
professional occupation, and fathers had secondary education (“High“ SES no changes),
were tallest and fattest. Children whose grandfathers had a professional occupation, but
fathers had only basic or vocational education (downward transition), were short and
slim.
References
Anuchin, D.N. (1889). On the geographical distribution of height of the
male population of Russia (according to the data on the universal military service in
the Russian Empire for 1874-1883) in comparison with the distribution of height in other
countries (With ten colored maps of Professor D.N. Anuchin), in: Notes of the Imperial
Russian Geographical Society, the Department of Statistics. SPb., V. Bezobrazov &
Co. Publ., p. 185.
Aparicio-Martinez, P./Perea-Moreno, A.-J./Martinez-Jimenez,
M.P./Redel-Macías, M.D./Pagliari, C./Vaquero-Abellan, M. (2019). Social Media,
Thin-Ideal, Body Dissatisfaction and Disordered Eating Attitudes: An Exploratory
Analysis. International Journal of Environmental Research and Public Health 16, E4177.
https://doi.org/10.3390/ijerph16214177
Bartkowiak, S./Konarski, J.M./Strzelczyk, R./Janowski, J./Malina, R.M.
(2021). Secular change in height and weight of rural school children and youth in
west-central Poland: 1986 to 2016. American Journal of Human Biology: The Official
Journal of the Human Biology Council 33, e23461. https://doi.org/10.1002/ajhb.23461
Böker, S./Hermanussen, M./Scheffler, C. (2021). Dental age is an
independent marker of biological age, Human Biology and Public Health 3. https://doi.org/10.52905/hbph2021.3.24.
Bogin, B. (2021). Social-Economic-Political-Emotional (SEPE) factors
regulate human growth. Human Biology and Public Health 1. https://doi.org/10.52905/hbph.v1.10
Bogin, B./Hermanussen, M./Scheffler, C. (2018). As tall as my peers -
similarity in body height between migrants and hosts. Anthropologischer Anzeiger 74,
365–376. https://doi.org/10.1127/anthranz/2018/0828
Bogin, B./MacVean, R.B. (1984). Growth status of non-agrarian, semi-urban
living Indians in Guatemala. Human Biology 56, 527–538.
Bunak, V.V. (1932). About the changes in height of the male population in
50 years. Anthropological Journal 1, 24–53.
Dikanski, M. (1914). Über den Einfluss der sozialen Lage auf die
Körpermaße von Schulkindern (Dissertation). Universitäts-Kinderklinik,
München.
Greil, H. (1988). Der Körperbau im Erwachsenenalter (PhD Thesis). Medical
Faculty, Humboldt-University, Berlin.
Grogan, S. (2021). Body Image: Understanding Body Dissatisfaction in Men,
Women and Children. Routledge & CRC Press.
Günöz, H./Bundak, R./Furman, A./Darendeliler, F./Saka, N./Baş, F./Neyzi,
O. (2014). Z-score reference values for height in Turkish children aged 6 to 18 years.
Journal of Clinical Research in Pediatric Endocrinology 6, 28–33. https://doi.org/10.4274/Jcrpe.1260
Gomula, A./Nowak-Szczepanska, N./Sebastjan, A./Kozieł, S. M./Malina, R.
M./Ignasiak, Z. (2022). Age at Menarche in Urban Girls Exposed to Lead in the Copper
Basin, Poland. Biology, 11(4), 584. https://doi.org/10.3390/biology11040584.
Hartman-Munick, S.M./Gordon, A.R./Guss, C. (2020). Adolescent body image:
influencing factors and the clinician’s role. Current Opinion in Pediatrics 32, 455–460.
https://doi.org/10.1097/MOP.0000000000000910
Hermanussen, M./Aßmann, C./Groth, D. (2021a). Chain Reversion for
Detecting Associations in Interacting Variables-St. Nicolas House Analysis.
International Journal of Environmental Research and Public Health 18. https://doi.org/10.3390/ijerph18041741
Hermanussen, M./Scheffler, C./Martin, L./Groth, D./Waxmonsky,
J.G./Swanson, J./Nowak-Szczepanska, N./Gomula, A./Apanasewicz, A./Konarski, J.M./Malina,
R.M./Bartkowiak, S./Lebedeva, L./Suchomlinov, A./Konstantinov, V./Blum, W./Limony,
Y./Chakraborty, R./Kirchengast, S./Tutkuviene, J./Jakimaviciene, E.M./Cepuliene,
R./Franken, D./Navazo, B./Moelyo, A.G./Satake, T./Koziel, S. (2021b). Growth, Nutrition
and Economy: Proceedings of the 27th Aschauer Soiree, held at Krobielowice, Poland,
November 16th 2019. Human Biology and Public Health 1. https://doi.org/10.52905/hbph.v1.1
Hermanussen, M./Novine, M./Scheffler, C./Groth, D. (2022). The arithmetic
dilemma when defining thinness, overweight and obesity in stunted populations. Human
Biology and Public Health, 1. https://doi.org/10.52905/hbph2022.1.21.
Hobbs, M./Radley, D.(2020). Obesogenic environments and obesity: a comment
on “Are environmental area characteristics at birth associated with overweight and
obesity in school-aged children? Findings from the SLOPE (Studying Lifecourse Obesity
PrEdictors) population-based cohort in the south of England.” BMC medicine 18, 59.
https://doi.org/10.1186/s12916-020-01538-5
Koziel, S./Zaręba, M./Bielicki, T./Scheffler, C./Hermanussen, M. (2019).
Social mobility of the father influences child growth: A three-generation study.
American Journal of Human Biology 31. https://doi.org/10.1002/ajhb.23270
Lakes, T./Burkart, K. (2016). Childhood overweight in Berlin: intra-urban
differences and underlying influencing factors. International Journal of Health
Geographics 15, 12. https://doi.org/10.1186/s12942-016-0041-0
Lee, P./Miera, C.S. de/Bellefontaine, N./Silveira, M.A./Zampieri,
T.T./Donato, J./Williams, K.W./Frazao, R./Elias, C.F. (2021). Reproductive neuronal
circuitry in adaptive changes of energy balance. https://doi.org/10.1101/2021.09.09.459635
Nowak-Szczepanska, N./Gomula, A./Sebastjan, A./Ignasiak, Z./Koziel, S.
(2021). Blood lead level and nutritional status indicators in preadolescent Polish
schoolchildren. Journal of trace elements in medicine and biology: organ of the Society
for Minerals and Trace Elements (GMS) 68, 126847. https://doi.org/10.1016/j.jtemb.2021.126847
Purundzhan, A.L. (1978). Geographic variability of anthropometric traits
in the Soviet Union, in: Kurshakova YS, Dunayevskaya TN, Zenkevich PI et.al. (eds)
Problems of Anthropological Standardization for Garment Design. Moscow, Russia,
100–155.
Scheffler, C./Nguyen, T.H./Hermanussen, M. (2021a). Vietnamese migrants
are as tall as they want to be. Human Biology and Public Health 2. https://doi.org/10.52905/hbph.v2.12
Scheffler, C./Rogol, A.D./Iancu, M./Hanc, T./Moelyo, A.G./Suchomlinov,
A./Lebedeva, L./Limony, Y./Musalek, M./Veldre, G./Godina, E.Z/Kirchengast, S./Mumm,
R./Groth, D./Tutkuviene, J./Böker, S./Ozer, B.K./Navazo, B./Spake, L./Koziel,
S./Hermanussen, M. (2021b). Growth during times of fear and emotional stress: Human
Biology and Public Health 2. https://doi.org/10.52905/hbph.v2.15
Stagkourakis, S./Spigolon, G./Williams, P./Protzmann, J./Fisone,
G./Broberger, C. (2018). A neural network for intermale aggression to establish social
hierarchy. Nature Neuroscience 21, 834–842. https://doi.org/10.1038/s41593-018-0153-x
Townshend, T./Lake, A. (2017). Obesogenic environments: current evidence
of the built and food environments. Perspectives in Public Health 137, 38–44. https://doi.org/10.1177/1757913916679860
Wilke, L./Boeker, S./Mumm, R./Groth, D. (2022). The Social status
influences human growth: A summary and analysis of historical data from German school
girls in 1914 with comparison to modern references. Human Biology and Public Health, 3.
https://doi.org/10.52905/hbph2021.3.22.