Estimation of Percentage of Body Fat in Field Studies
A Method Based on Relative Elbow Breadth (Frame Index) and BMI
Rebekka Mumm ✉
✉
University of Potsdam, Institute of Biochemistry and Biology, Human
Biology, Potsdam, Germany.
University of Potsdam, Institute of Biochemistry and Biology, Human
Biology, Potsdam, Germany.
Christiane Scheffler
University of Potsdam, Institute of Biochemistry and Biology, Human
Biology, Potsdam, Germany.
DOI: https://doi.org/10.52905/hbph.v1.3
Abstract
Background
Over the last 20 years, a decreasing trend in external skeletal robusticity and an
increasing trend in overweight and obesity was observed worldwide in adults and children
as modern lifestyles in nutritional and activity behavior have changed. However, body
mass index (BMI) as a measure for overweight is not an ideal predictor of % body fat
(%BF) either in children and adolescents or in adults. On the contrary, it disguises a
phenomenon called “hidden obesity”.
Objectives
We aim to approximate %BF by combining skeletal robusticity and BMI and develop an
estimation-based tool to identify normal weight obese children and adolescents.
Sample and Methods
We analyzed cross-sectional data on height, weight, elbow breadth, and skinfold
thickness (triceps and subscapular) of German children aged 6 to 18 years (N=15,034). We
used modified Hattori charts and multiple linear regression to develop a tool, the “%BF
estimator”, to estimate %BF by using BMI and skeletal robusticity measured as Frame
Index.
Results
Independent of sex and age an increase in BMI is associated with an increase in %BF, an
increase in Frame Index is associated with a decrease in %BF. The developed tool “%BF
estimator” allows the estimation of %BF per sex and age group after calculation of BMI
and Frame Index.
Conclusion
The “%BF estimator” is an easily applicable tool for the estimation of %BF in respect
of body composition for clinical practice, screening, and public health research. It is
non-invasive and has high accuracy. Further, it allows the identification of normal
weight obese children and adolescents.
Keywords: body fat estimator, body composition, skeletal robusticity, hidden obesity, normal weight obese
Conflict of Interest: There are no
conflicts of interest.
Citation: Mumm, R,Reimann, A,Scheffler, C, (2021), Estimation of Percentage of Body Fat in Field Studies, Human Biology and Public Health 1. https://doi.org/10.52905/hbph.v1.3.
Copyright: This is an open access article distributed under the terms of the Creative Commons Attribution License which permits unrestricted use, distribution, and reproduction in any medium, provided the original author and source are credited.
Received: 24-08-2020 | Accepted: 29-10-2020 | Published: 22-06-2021
Take home message for students
For the estimation of % body fat of children and adolescents with “%BF estimator” in clinical practice, screening, and public health research height, weight and elbow breadth need to be collected.
Contents
Introduction
Over the last 20 years, a decreasing trend in external skeletal robusticity was observed
worldwide e.g., Germany, Russia, and Argentina (Hermanussen
et al. 2015; Navazo et al. 2020; Rietsch et al. 2013b; Scheffler and Hermanussen 2014). The phenomenon is independent of sex and age and
occurs not only in persons with average values but also in all centiles (Mumm et al. 2018; Navazo et al. 2020; Rietsch et al. 2013b).
For example, the 10th centile of German boys of skeletal robusticity, measured by
Frame Index (Frisancho 1990) in 2010, is below the
3rd centile of a similar cohort measured in 2000 (Rietsch et al. 2013a; Scheffler
2010). Similar results were found in Argentina (Navazo et al. 2020). In the short period of ten years a tremendous decline in
skeletal robustness, independently of ethnicity, age and sex occurred worldwide mainly due
to a lack of physical activity (Rietsch et al.
2013a).
Contemporaneously, the world is experiencing a global epidemic of overweight and obesity in
adults and children as modern lifestyles in nutritional and activity behavior have changed.
In 1975, 5 million girls and 6 million boys globally were classified as obese (individual
body mass index (BMI) ≥ 2 BMI SDS of reference). Nowadays, 30 years later, globally 50
million girls and 74 million boys are obese (NCD Risk
Factor Collaboration 2017). The problem is still ongoing as changes in lifestyle,
policies and environmental conditions are very slow (Swinburn et al. 2019). Recently, adults with a BMI within the normal range but a
high amount body fat (BF) were described and defined as “normal weight obese” (NWO) (Lorenzo et al. 2006; Marques-Vidal et al. 2010; Mokhtar et al.
2001; Romero-Corral et al. 2010). The
phenomenon is also known as “hidden obesity” (Mokhtar
et al. 2001). The definition also applies to children that have a high-fat mass and
low-fat free mass but their BMI is within a normal range (Czernitzki et al. 2017; Wohlfahrt-Veje et al.
2014), however, commonly agreed cut-offs for the percentage of BF (%BF) to define
overweight and obesity in children are still missing (Czernitzki et al. 2017; Wohlfahrt-Veje et al.
2014).
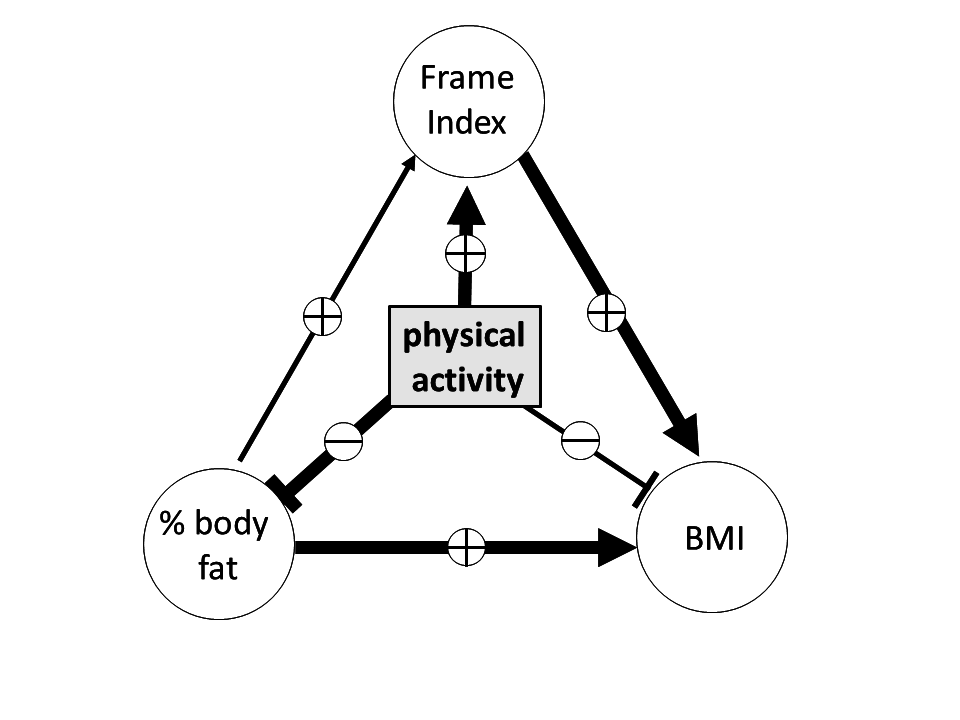
Skeletal robusticity, body mass, and body composition interact e.g., an increase in
skeletal dimensions is associated with an increase in BF (La Guzmán-de Garza et al. 2017). The interaction was described in detail by Rietsch et al. (2013a). They propose a triangular interaction that is mediated by physical
activity. BMI, %BF, and Frame Index are positively correlated with each other. Thereby, %BF
and Frame Index have a direct positive influence on BMI. Further, due to the mediation an
increase in physical activity increases the Frame Index but decreases BMI and %BF.
Additionally, physical activity acts as a mediator via Frame Index on BMI. An increase in
physical activity increases Frame Index which effects BMI (Figure 1).
As described earlier, BMI is used to identify overweight and obese children as BMI and %BF
are positively correlated. In general, boys and girls with a high BMI have a high amount of
BF whereas the interaction is stronger in girls than in boys (La Guzmán-de Garza et al. 2017; Prentice and Jebb 2001; Woolcott and Bergman
2019). Despite the high correlation, BMI is not an ideal predictor of %BF either in
children and adolescents or in adults (Deurenberg-Yap
et al. 2000; Wells 2018; Wickramasinghe 2012). The relationship further depends
on ethnicity as, for example, Asians have a lower BMI but at the same time a higher %BF
(Deurenberg-Yap et al. 2000; Prentice and Jebb 2001), however, bone measures do not
differ significantly between ethnicities (Hetherington-Rauth et al. 2018). Although “bone mass, skeletal muscle mass, and
fat mass are highly correlated with BMI” (Wells
2014), BMI is only a measure of height and weight and not body composition. It does
not reflect population-specific body composition and is said to be a poor indicator of
adiposity within and across populations (Wells
2014; 2018).
Reliable information on body composition and %BF is obtained by dual-energy X-ray
absorptiometry (DXA), bio impendence analysis (BIA), or hydrostatic weighing (Borga et al. 2018). These methods are expensive,
invasive (in case of DXA), and too demanding of equipment and effort (e.g., BIA) for
low-cost fieldwork in e.g., kindergartens and schools. A valid substitute for public health
research is the non-invasive measurement of skinfold thickness (Wells 2014) to calculate %BF using the equation provided e.g., by Slaughter et al. (1988). However, skinfold thicknesses are rarely measured in screening programs,
mostly in programs with a specialized research question, as a special caliper and training
are needed for accurate measurements. Therefore, we aim to develop an easily applicable tool
with high accuracy to estimate %BF using standard measures of screening like height and
weight and the measure of elbow breadth which has a low measurement error and requires
almost no special training. Using BMI and skeletal properties might allow to combine
information on fat mass and lean mass to estimate %BF and might further allow identification
of NWO children and adolescents (= children and adolescents with hidden obesity).
We hypothesize:
| 1. | Frame Index and BMI together approximate %BF in German boys and girls. |
| 2. | Relative low Frame Index and normal BMI is a proxy for hidden obesity in children and
adolescents. |
Samples and Methods
Samples
We analyzed cross-sectional data on height, weight, bi-epicondylar humerus, and skinfold
thickness (triceps and subscapular) of German children aged 6 to 18 years. After Frisancho (1990), we refer to bi-epicondylar humerus as elbow breadth. Data originate from
the baseline KIGGS-study (German Health Interview and Examination Survey for Children and
Adolescents), a representative cross-sectional study conducted from 2003-2006. Details of
the study can be found elsewhere (Hölling et al.
2012; Kamtsiuris et al. 2007).
Additionally, data of several different studies of children and adolescents from Berlin
and the federal state of Brandenburg were used. For details see Schilitz (2001), Schüler (2009), Rietsch et al. (2013a). Due to data aggregation, 15,034 children and
adolescents were analyzed altogether. Table 1
shows the sample sizes per sex and age group.
Table 1 Sample size per sex and age group
| age |
6 |
7 |
8 |
9 |
10 |
11 |
12 |
13 |
14 |
15 |
16 |
17 |
18 |
total |
| girls |
736 |
706 |
719 |
772 |
694 |
659 |
588 |
512 |
488 |
502 |
451 |
505 |
93 |
7425 |
| boys |
828 |
739 |
667 |
779 |
735 |
668 |
604 |
565 |
523 |
531 |
456 |
457 |
57 |
7609 |
| total |
1564 |
1445 |
1386 |
1551 |
1429 |
1327 |
1192 |
1077 |
1011 |
1033 |
907 |
962 |
150 |
15034 |
Methods
As an indicator of the external skeletal robusticity, the Frame Index was used. It was
calculated after Frisancho (1990): Frame Index = elbow breadth (in mm)/height (in cm)*100. The
interobserver technical error of measurement (TEM) for elbow breadth is 1.54 mm (Frisancho 1990). Further, we calculated BMI as the
quotient of weight (in kg) and squared height (in m). For the estimation of %BF, equations
based on skinfold thickness (triceps and subscapular), published by Slaughter et al. (1988) were
used. Interobserver TEM for skinfolds at triceps and subscapular is 1.06 mm and 2.28 mm
respectively (Ulijaszek and Lourie 1994).
Estimation of %BF by Frisancho (1990) has a standard error of the estimate (SEE) of
3-4%. Modified body proportion charts as proposed by Hattori et al. (2011; 1997) were applied to the dataset to visualize the
relationship of %BF, Frame Index, and BMI. Frame Index was presented on the x-axis, BMI on
the y-axis, and %BF was added as splines (see Figure
2 and 3). To estimate %BF depending on
Frame Index and BMI, we conducted linear regression models for each sex and age group as
%BF varies between sexes and changes with development and maturation of children and
adolescents (Wells 2018). Age groups were defined
as completed years (age group 6: 6.00 to 6.99 years). Children and adolescents with a BMI
under the 90th centile and a %BF above the 85th centile of
appropriate references were classified as normal weight obese (= hidden obese) adapting a
definition by Czernitzki et al. (2017).
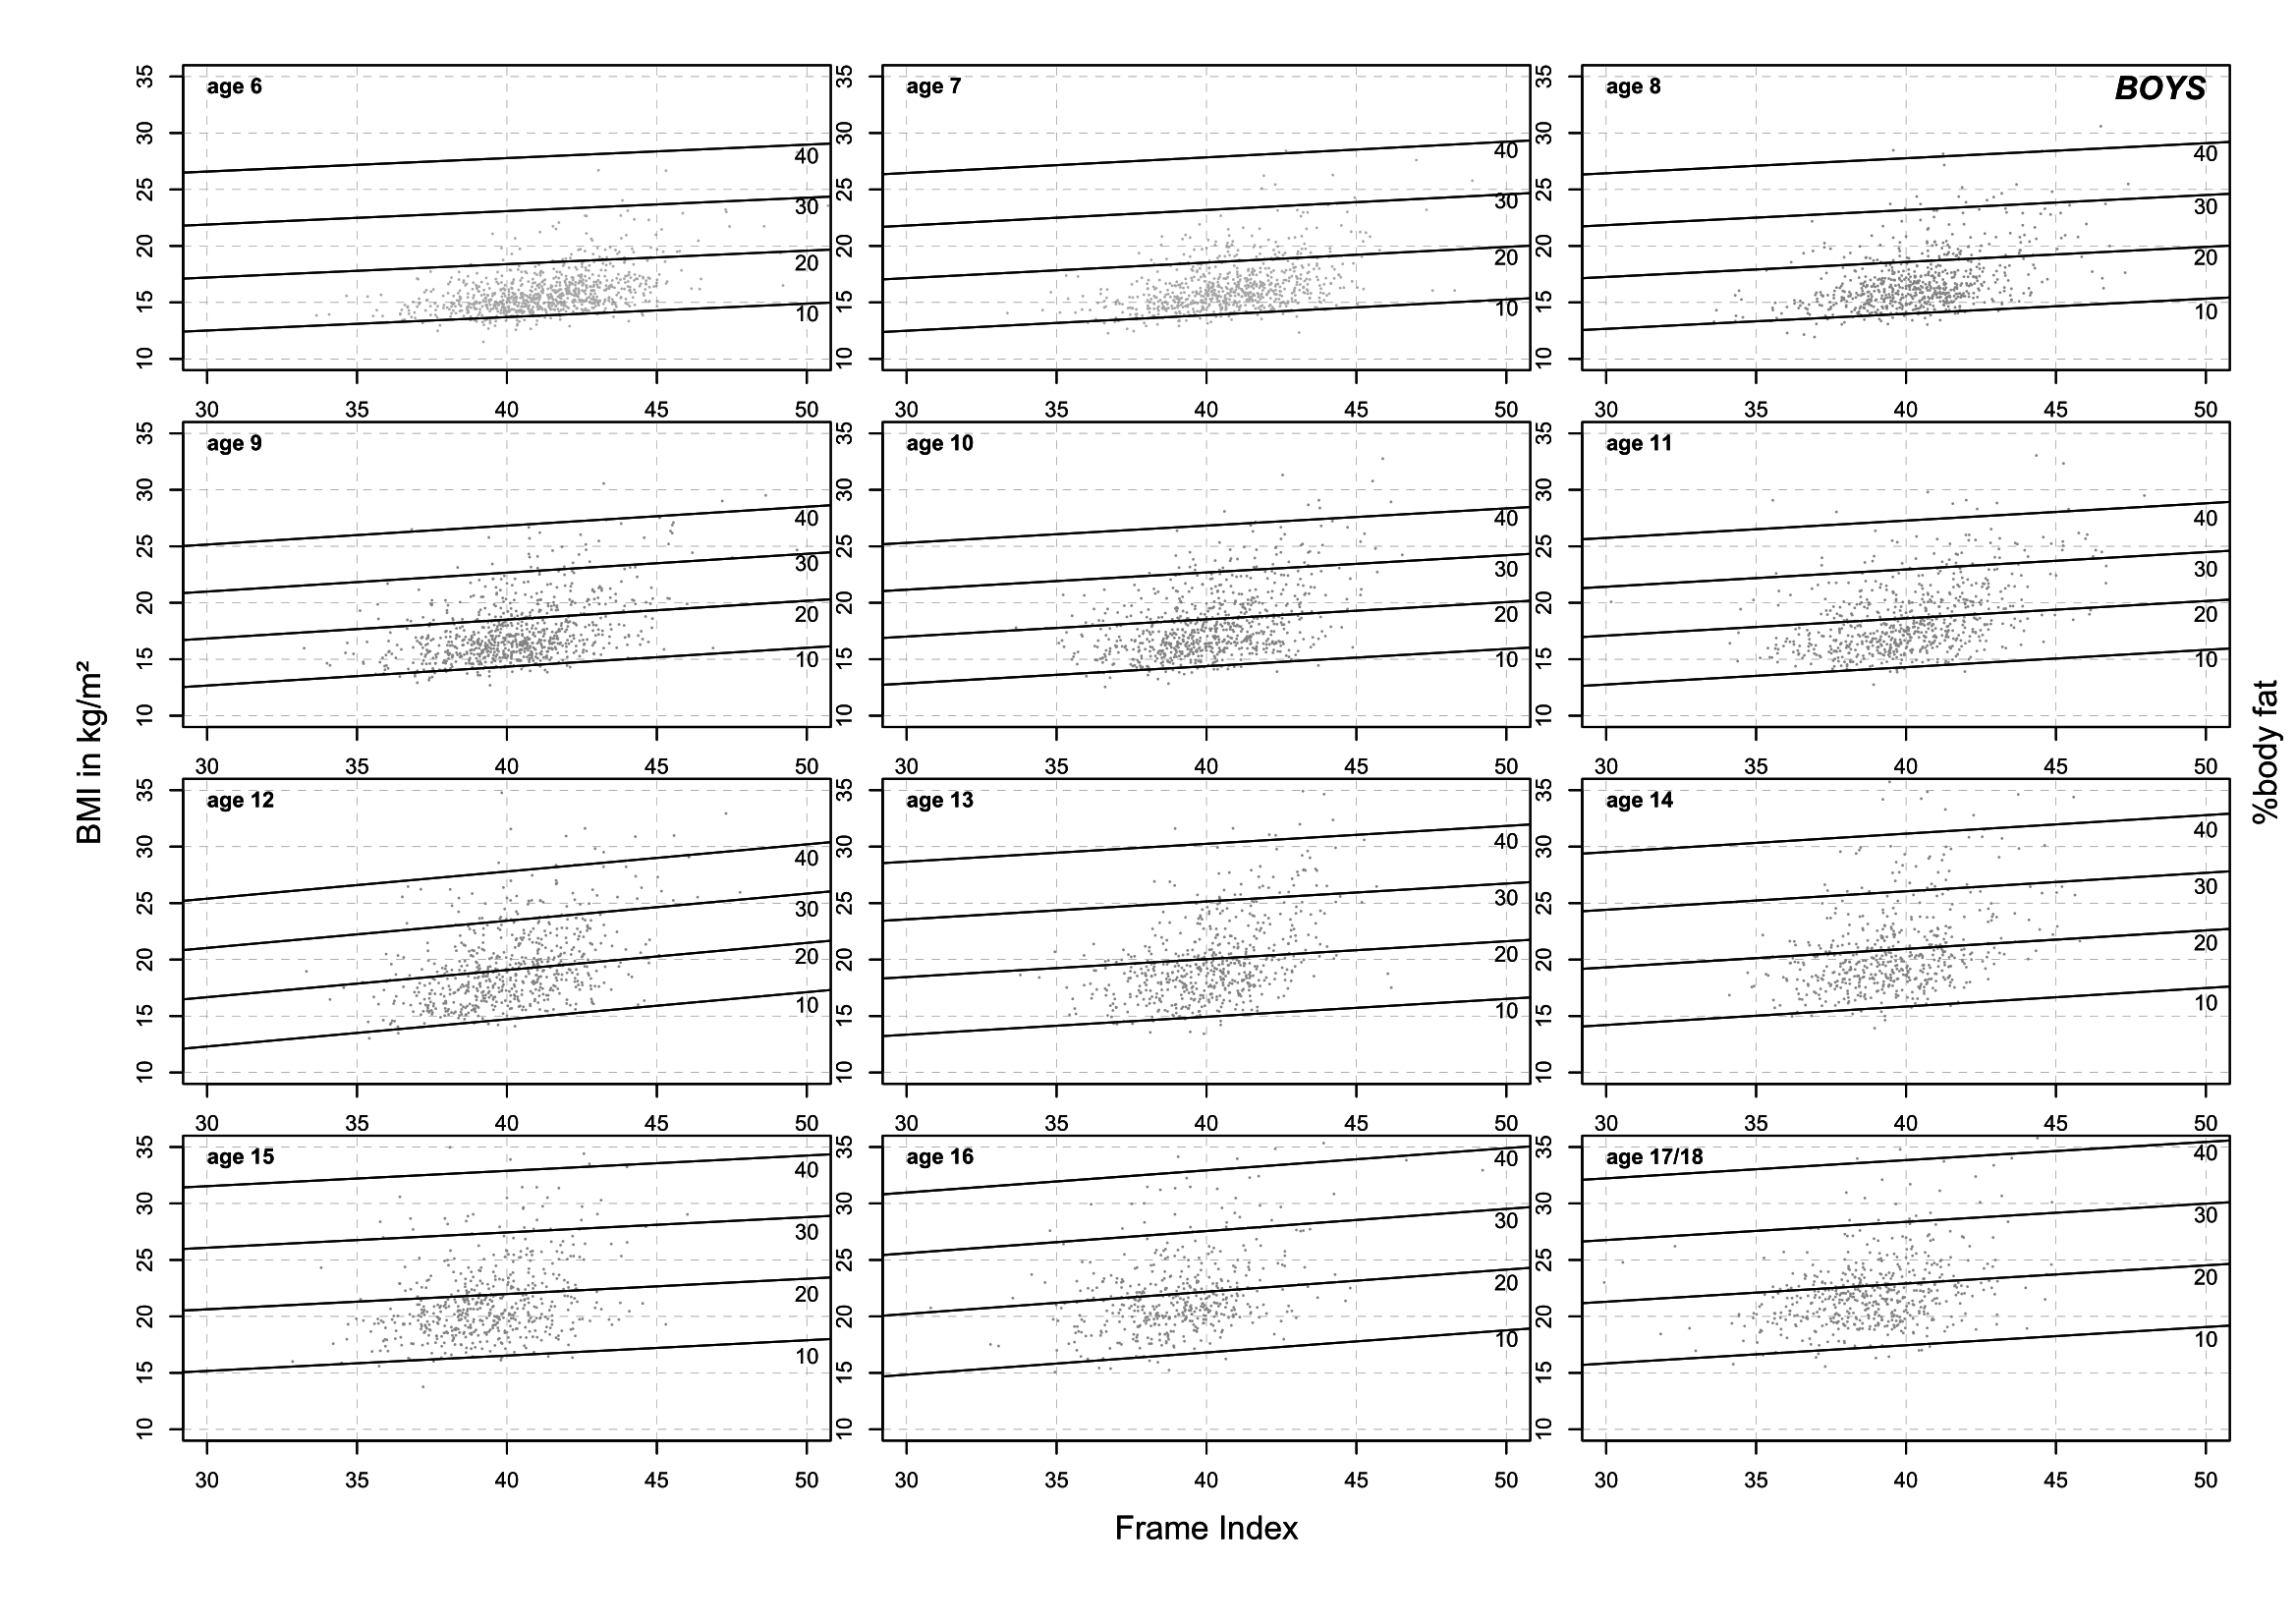
Figure 2 References for the estimation of %body fat by Frame Index and BMI per age for
boys (“%BF estimator”)
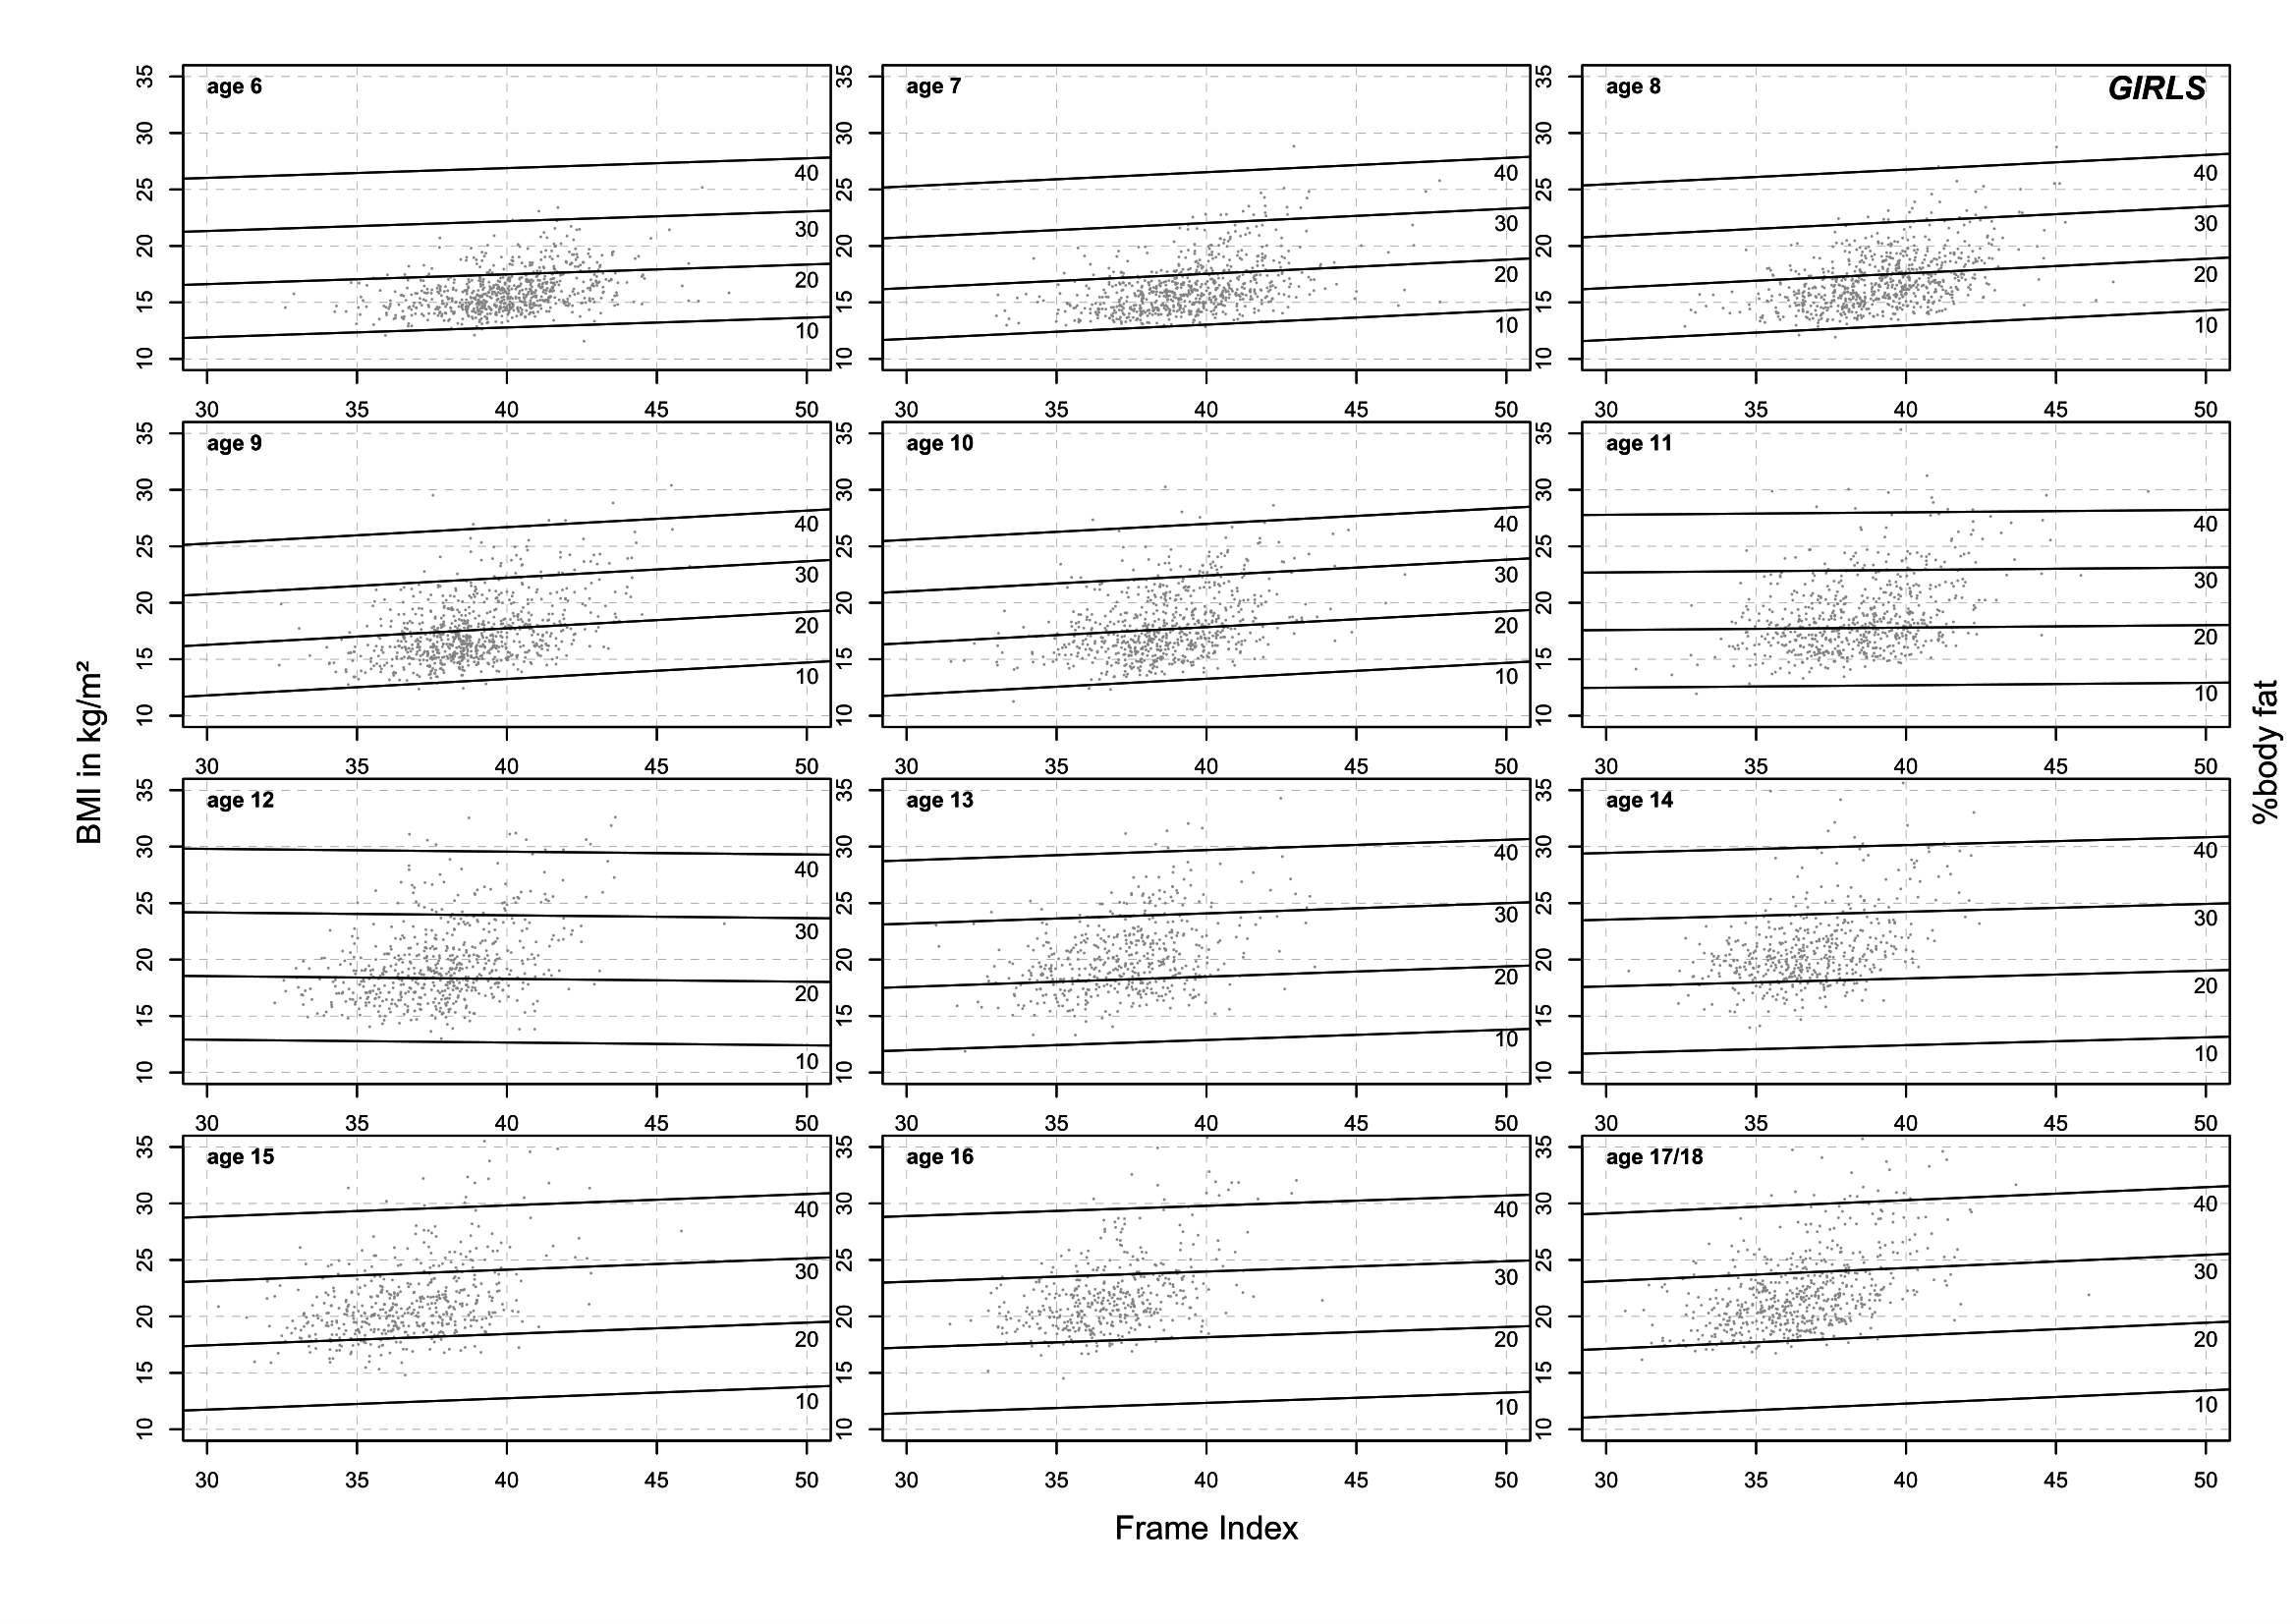
Figure 3 References for the estimation of %body fat by Frame Index and BMI per age for
girls (“%BF estimator”)
Results
The estimated %BF per sex and age group by Frame Index and BMI are presented as modified
Hattori chart in Figure 2 and 3. These charts act as a tool to estimate %BF and are therefore called
“%BF estimator”. Independent of sex and age a positive interaction of BMI and %BF and a
negative association of Frame Index and %BF can be overserved. An increase in BMI is
associated with an increase in %BF, an increase in Frame Index is associated with a decrease
in %BF. Exceptional, 11- and 12-year-old girls show a slightly reverse association. The
presented figures are references for the estimation of %BF, detailed figures per sex and age
group are presented in the supplementary files S1 and S2. To use the references BMI and
Frame Index need to be calculated and added to the reference graph before %BF can be
extracted.
Specific examples for 8-year-old girls are presented in Figure 4. For all example patients, the following references were used: Mumm et al. (2018) for Frame Index and Schaffrath
et al. (2010) for BMI. Children with a BMI
above the 90th centile of a specific reference are classified as overweight
(after recommendations by Kromeyer-Hauschild et al.
(2001)). The children differ in centiles (C) of
Frame Index and BMI:
| • | Child 1 (P1): Frame Index C10 (10th centile) and BMI C10 |
| • | Child 2 (P2): Frame Index C10 and BMI C90 |
| • | Child 3 (P3): Frame Index C50 and BMI C50 |
| • | Child 4 (P4): Frame Index C90 and BMI C10 |
| • | Child 5 (P5): Frame Index C25 and BMI C87 |
Child 5 is a real existing child not included in the dataset that was used for developing
the "%BF estimator". Child 5 further has a %BF above the 85th centile of German
references of %BF (dashed line) after Schwandt
et al. (2012). Child 5 would not be
classified as overweight as the BMI is below the 90th centile but according to
our definition child 5 would be classified as normal weight obese. Child 5 has an estimated
%BF of about 22.5%. The measured %BF of child 5 is 22.2%. Similar examples (not shown) can
be found in boys and girls of all ages.
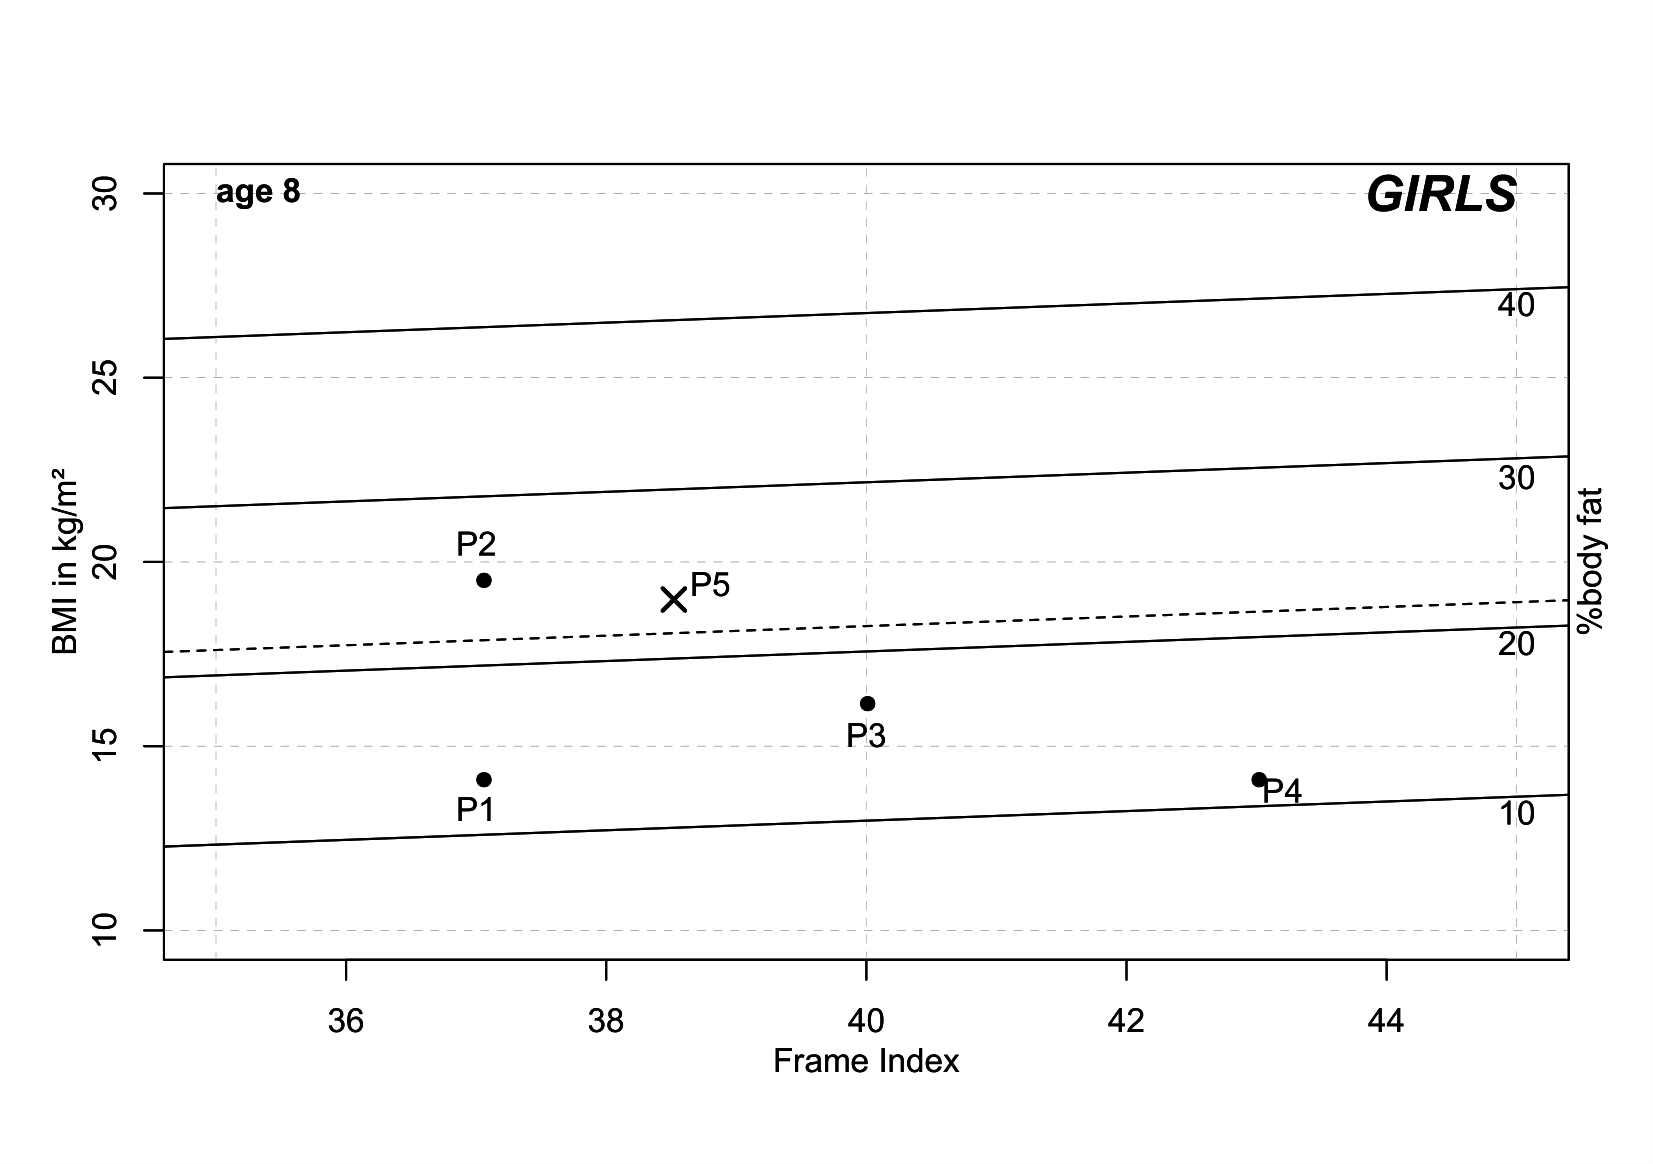
Figure 4 Examples %body fat estimation of 8-year old girls differing in BMI and Frame Index
(Pn - childn). 85th centile of German % body fat
references (Schwandt et al. 2012) added as a
dashed line.
Discussion
In this paper, we developed an easily applicable tool, the “%BF estimator” to approximate
%BF by Frame Index and BMI in German boys and girls. Hence, our first hypothesis is true.
The “%BF estimator” has implications for clinical practice and public health research as
with the tool it is easily possible to estimate %BF without complex equations and
calculations for the user by using the standard indexes BMI and Frame Index. “%BF estimator”
could, therefore, be used in all kinds of settings, particularly in low budget studies, for
population-wide screening, etc. in high-, low- and middle-income countries, but also in
screening programs in well-developed countries. Additionally, our second hypothesis is true
as well. “%BF estimator” can be used to identify NWO children and adolescents as seen in
example child 5 in Figure 4. Child 5 is classified as
NWO by an adaption of Czernitzki et al. (2017). The girl has a BMI within a normal range
(between 10th and 90th centile) and a %BF above the 85th
centile. As seen in Figure 4, the girl’s Frame
Index is very low (10th centile, C10). This is in line with results published by
Musálek et al. (2018). They found NWO children to have the lowest values of Frame Index. Children
and adolescents with a normal BMI but low skeletal robusticity measured by Frame Index are
at risk of suffering from hidden obesity.
It is known that adults classified as NWO have a higher risk of cardiovascular and
metabolic diseases (Lorenzo et al. 2006; Marques-Vidal et al. 2010; Romero-Corral et al. 2010). “Similar risk patterns may apply to
children at school age with %BF above the upper limit” (Wohlfahrt-Veje et al. 2014). Therefore, it is important to identify NWO boys and
girls with easily applicable tools. The “%BF estimator” seems to be such a tool but further
research is necessary to evaluate the tool in other populations and on children that are
classified as NWO by other measures e.g., DXA. NWO children and adolescents are often not
focused on when screening the population on overweight and obesity or in daily clinical
practice. As NWO boys and girls have “normal” BMI, they do not appear overweight or obese
although their risk for cardiovascular and metabolic diseases might be the same. If
integrated into standard screening procedures and guidelines for pediatricians the “%BF
estimator” can help to identify children at risk. NWO children, adolescents and adults are
often also referred to as “skinny fat”. The opposites of NWO is called “healthy obese” –
people with BMI that classifies them as overweight, but a %BF within the normal range. A
phenomenon often seen in sportsmen e.g., body builders.
But what are the advantages of the “%BF estimator”? As commonly known, BMI alone is a poor
predictor for %BF. Wickramasinghe (2012) found an increase in fat mass but not in lean
mass when body weight increases in Sri Lankan children and assumed a lack of physical
activity to be the underlying cause. Similar conclusions were drawn by Rietsch et al. (2013b) for
children in Germany and Russia. They use the Frame Index as a measure of skeletal
robusticity and substitute for lean mass and showed a direct effect of physical activity on
skeletal properties. The interaction of bone and body mass is more complex than generally
assumed and “unlikely to be driven principally by the loading imparted by body mass due to
gravity” (Pomeroy et al. 2018). Although fat mass
is a component of body mass and contributes to skeletal loading, lean mass is the main
determinant of limb bone strength, particularly on upper limbs (Hetherington-Rauth et al. 2018; Pomeroy et al. 2018). Skeletal properties can be used to estimate lean mass but
they are not reliable for estimating fat mass (Pomeroy
et al. 2018). Therefore, a combination of skeletal measures and BMI should be used
to approximate %BF like in the developed tool “%BF estimator”. The method behind “%BF
estimator” can be adapted to other populations with a different interaction of %BF and BMI
e.g., in Asia (Deurenberg-Yap et al. 2000; Prentice and Jebb 2001) by repeating the calculations
using population-specific information on BMI and Frame Index.
Normal weight obese children have low skeletal robusticity probably due to a lack of
physical activity. As seen in overweight children a reduction in BMI can be caused by a
reduction of energy intake but not with an increased amount of physical activity (Birch et al. 2019). The success of physical activity in
the reduction of overweight has to be measured differently (Epstein et al. 2008). Furthermore, although BMI is correlated with %BF
the “optimal percentile cutoff to define obesity in children differs between those with high
muscle mass or a large body frame” (La Guzmán-de Garza
et al. 2017). The interaction of lean mass and physical activity is not captured by
BMI measurements and Frame Index seems to be a more appropriate measure (Rietsch et al. 2013a). We assume that an increase in
Frame Index due to an increase in BMI is caused by an increase in body weight but not by
higher levels of physical activity. Bones and skeletal muscles form a functional unit. “Fat
mass is not a strong predictor of bone size or geometry” (Pomeroy et al. 2018), however, lean mass is. Lean mass contributes to all bones in
strength and measurements, whereas fat mass only contributes to weight-bearing bones.
Non-weight bearing bones like the upper limbs are not directly affected by fat mass,
however, during bipedal locomotion muscles and bones in arms and shoulders interact (Preuschoft 2004). When walking the non-weight bearing
bones of the upper limbs are moved due to pendulousness of shoulder and arms by muscles
(Preuschoft 2004; Scheffler and Hermanussen 2014). As lean mass influences bone strength,
physical activity like walking and thereby moving upper limbs, increase the Frame Index
(Rietsch et al. 2013a; Scheffler and Hermanussen 2014). “Moreover, in the non-weight bearing
diaphyseal radius, fat mass had a significant negative association with cortical bone
content […] and thickness […]” (Hetherington-Rauth et al.
2018). Further research is needed to understand the proximate and ultimate causes
of this interaction. However, Frame Index can be used as a substitute for lean mass and
physical activity as it is measured on non-weight bearing bones. In combination BMI, which
roughly measures the fat mass, the body composition of an individual can be taken into
account.
Our published tool “%BF estimator” is an easy tool to estimate %BF in respect to individual
body composition that is low-cost, non-invasive, and has high accuracy in terms of technical
measurement errors for measurements of height, weight and elbow breadth. Height and weight
are standard measurements in all screening programs globally and elbow breadth is a very
easy measurement that requires almost no training usable by health care workers or
researchers to integrate into said screening programs. Although bone measures are not
population-specific the references used for “%BF estimator” depend on age, sex, and
population (Deurenberg-Yap et al. 2000; Hetherington-Rauth et al. 2018). Our developed tool
might also be an answer to the statement of Pomeroy
et al. (2018): “The ability to estimate
fat and lean mass from skeletal characteristics would offer novel potential to investigate
past human adaptation, health, and evolution, as well as to understand the origins of
contemporary variation in body composition.“
We recommend using the “%BF estimator” in the field to approximate %BF if other methods
like DXA are not appropriate due to their invasive X-rays. Furthermore, the “%BF estimator”
can be used for the detection of NWO boys and girls in clinical practice and public health
research. It is not practical to use in adults, because physical activity (correspondingly
also the muscle mass and fat mass) can change over time, whereas the bone dimensions change
only marginally in adults. In that case for adults the handgrip strength as an recent
measure of muscular load at the same value of BMI is a good indicator of percentage of fat
(Nickerson et al. 2020).
Limitations
Our study is limited by several factors. First, %BF data measured by DXA or hydrostatic
weighing is missing. Second, as we used the equation by Slaughter et al. (1988) to calculated the
%BF for our analysis, we had to estimate the pubertal status in boys by age as recommended
by Schwandt et al. (2012). However, a comparison of using Tanner stages (Tanner 1962) for classification of maturation or the
age groups of Schwandt et al. (2012) showed no differences between the methods for the
accuracy of %BF calculation (Mumm 2015). Third,
direct data on physical activity levels of children e.g., accelerometer data or
questionnaires are missing, however, Frame Index and physical activity are positively
correlated (Rietsch et al. 2013a). The analysis and
estimation of the “%BF estimator” tool could be repeated with data from DXA and
accelerometry and differences in the methods could be compared by using the Bland-Altman
approach (Bland and Altman 1986; 1999). Fourth, our tool was developed for the German
population. As the relationship between BMI and %BF slightly differs between ethnicities
(Deurenberg-Yap et al. 2000), population-specific
adaptions are needed. The analyses can easily be repeated with data from other populations
and population specific %BF estimator plots can be created. Fifth, even within a country,
several references for %BF exist that are significantly different e.g., %BF in Germany by
Schwandt et al. (2012) or Plachta-Danielzik
et al. (2012). Results of classifications
might vary depending on the used references as cutoff values differ.
Conclusion
The “%BF estimator” is an easily applicable tool for the estimation of %BF in respect to
body composition for clinical practice, screening, and public health research. It is
non-invasive and the measurements have high accuracy. Further, it allows the identification
of normal weight obese children. We recommend to integrate the measurement of elbow breadth
into growth studies and population-wide screening to calculate %BF and identify boys and
girls at risk of hidden obesity.
Contribution of Authors
RM and CS designed the study. RM and AR analyzed the data. RM wrote the draft of the
manuscript. All authors discussed the results and revised the manuscript.
References
Birch, L./Perry, R./Hunt, L. P./Matson, R./Chong,
A./Beynon, R./Shield, J. P. (2019). What change in body mass index is associated with
improvement in percentage body fat in childhood obesity? A meta-regression. BMJ open 9
(8), e028231. https://doi.org/10.1136/bmjopen-2018-028231.
Bland, J. M./Altman, D. G. (1986). Statistical
methods for assessing agreement between two methods of clinical measurement. The Lancet
1 (8476), 307–310. https://doi.org/10.1016/s0140-6736(86)90837-8.
Bland, J. M./Altman, D. G. (1999). Measuring
agreement in method comparison studies. Statistical methods in medical research 8 (2),
135–160. https://doi.org/10.1177/096228029900800204.
Borga, M./West, J./Bell, J. D./Harvey, N. C./Romu,
T./Heymsfield, S. B./Dahlqvist Leinhard, O. (2018). Advanced body composition
assessment: from body mass index to body composition profiling. Journal of investigative
medicine : the official publication of the American Federation for Clinical Research 66
(5), 1–9. https://doi.org/10.1136/jim-2018-000722.
Czernitzki, A.-F./Kokstejn, J./Koziel, S./Mumm,
R./Musalek, M./Papez, P./Scheffler, C. (2017). Impact of normal weight obesity on
fundamental motor skills in pre-school children aged 3 to 6 years. Anthropologischer
Anzeiger 74 (3), 203–212. https://doi.org/10.1127/anthranz/2017/0752.
Deurenberg-Yap, M./Schmidt, G./van Staveren, W.
A./Deurenberg, P. (2000). The paradox of low body mass index and high body fat
percentage among Chinese, Malays and Indians in Singapore. International Journal of
Obesity and Related Metabolic Disorders : Journal of the International Association for
the Study of Obesity 24 (8), 1011–1017. https://doi.org/10.1038/sj.ijo.0801353.
Epstein, L. H./Roemmich, J. N./Robinson, J.
L./Paluch, R. A./Winiewicz, D. D./Fuerch, J. H./Robinson, T. N. (2008). A randomized
trial of the effects of reducing television viewing and computer use on body mass index
in young children. Archives of Pediatrics & Adolescent Medicine 162 (3), 239–245.
https://doi.org/10.1001/archpediatrics.2007.45.
Frisancho, A. R. (1990). Anthropometric standards
for the assessment of growth and nutritional status. Ann Arbor, The Univ. of Michigan
Pr.
Hattori, K./Hirohara, T./Satake, T. (2011). Body
proportion chart for evaluating changes in stature, sitting height and leg length in
children and adolescents. Annals of Human Biology 38 (5), 556–560. https://doi.org/10.3109/03014460.2011.577456.
Hattori, K./Tatsumi, N./Tanaka, S. (1997).
Assessment of body composition by using a new chart method. American Journal of Human
Biology 9 (5), 573–578. https://doi.org/10.1002/(SICI)1520-6300(1997)9:5<573::AID-AJHB5>3.0.CO;2-V.
Hermanussen, M./Scheffler, C./Groth, D./Aßmann, C.
(2015). Height and skeletal morphology in relation to modern life style. Journal of
Physiological Anthropology 34, 41. https://doi.org/10.1186/s40101-015-0080-4.
Hetherington-Rauth, M./Bea, J. W./Blew, R.
M./Funk, J. L./Hingle, M. D./Lee, V. R./Roe, D. J./Wheeler, M. D./Lohman, T. G./Going,
S. B. (2018). Relative contributions of lean and fat mass to bone strength in young
Hispanic and non-Hispanic girls. Bone 113, 144–150. https://doi.org/10.1016/j.bone.2018.05.023.
Hölling, H./Schlack, R./Kamtsiuris,
P./Butschalowsky, H./Schlaud, M./Kurth, B. M. (2012). Die KiGGS-Studie. Bundesweit
repräsentative Längs- und Querschnittstudie zur Gesundheit von Kindern und Jugendlichen
im Rahmen des Gesundheitsmonitorings am Robert Koch-Institut [The KiGGS study.
Nationwide representative longitudinal and cross-sectional study on the health of
children and adolescents within the framework of health monitoring at the Robert Koch
Institute]. Bundesgesundheitsblatt, Gesundheitsforschung, Gesundheitsschutz 55 (6-7),
836–842. https://doi.org/10.1007/s00103-012-1486-3.
Kamtsiuris, P./Lange, M./Schaffrath Rosario, A.
(2007). Der Kinder- und Jugendgesundheitssurvey (KiGGS): Stichprobendesign, Response und
Nonresponse-Analyse. Bundesgesundheitsblatt, Gesundheitsforschung, Gesundheitsschutz 50
(5-6), 547–556. https://doi.org/10.1007/s00103-007-0215-9.
Kromeyer-Hauschild, K./Wabitsch, M./Kunze,
D./Geller, F./Geiß, H. C./Hesse, V./Hippel, A. von/Jaeger, U./Johnsen, D./Korte,
W./Menner, K./Müller, G./Müller, J. M./Niemann-Pilatus, A./Remer, T./Schaefer,
F./Wittchen, H.-U./Zabransky, S./Zellner, K./Ziegler, A./Hebebrand, J. (2001).
Perzentile für den Body-mass-Index für das Kindes- und Jugendalter unter Heranziehung
verschiedener deutscher Stichproben. Monatsschrift Kinderheilkunde 149 (8), 807–818.
https://doi.org/10.1007/s001120170107.
La Guzmán-de Garza, F. J./González Ayala, A.
E./Gómez Nava, M./Martínez Monsiváis, L. I./Salinas Martínez, A. M./Ramírez López,
E./Mathiew Quirós, A./Garcia Quintanilla, F. (2017). Body frame size in school children
is related to the amount of adipose tissue in different depots but not to adipose
distribution. American Journal of Human Biology 29 (5). https://doi.org/10.1002/ajhb.23014.
Lorenzo, A. de/Martinoli, R./Vaia, F./Di Renzo, L.
(2006). Normal weight obese (NWO) women: an evaluation of a candidate new syndrome.
Nutrition, Metabolism, and Cardiovascular Diseases : NMCD 16 (8), 513–523. https://doi.org/10.1016/j.numecd.2005.10.010.
Marques-Vidal, P./Pécoud, A./Hayoz, D./Paccaud,
F./Mooser, V./Waeber, G./Vollenweider, P. (2010). Normal weight obesity: relationship
with lipids, glycaemic status, liver enzymes and inflammation. Nutrition, Metabolism,
and Cardiovascular Diseases : NMCD 20 (9), 669–675. https://doi.org/10.1016/j.numecd.2009.06.001.
Mokhtar, N./Elati, J./Chabir, R./Bour, A./Elkari,
K./Schlossman, N. P./Caballero, B./Aguenaou, H. (2001). Diet culture and obesity in
northern Africa. The Journal of Nutrition 131 (3), 887S-892S. https://doi.org/10.1093/jn/131.3.887S.
Mumm, R. (2015). It’s a matter of tempo -
influence of the individual developmental tempo in adolescents on anthropometric
measures and growth references [Eine Frage des Tempos - Der Einfluss der indivuellen
Entwicklungsgeschwindigkeit von Jugendlichen auf anthropometrische Maße und
Wachstumsreferenzen]. Master thesis. Potsdam, University of Potsdam.
Mumm, R./Godina, E./Koziel, S./Musalek, M./Sedlak,
P./Wittwer-Backofen, U./Hesse, V./Dasgupta, P./Henneberg, M./Scheffler, C. (2018).
External skeletal robusticity of children and adolescents - European references from
birth to adulthood and international comparisons. Anthropologischer Anzeiger 74 (5),
383–391. https://doi.org/10.1127/anthranz/2018/0826.
Musálek, M./Pařízková, J./Godina, E./Bondareva,
E./Kokštejn, J./Jírovec, J/Vokounová, Š. (2018). Poor skeletal robustness on lower
extremities and weak lean mass development on upper arm and calf: normal weight obesity
in middle-school-aged children (9 to 12). Frontiers in Pediatrics 6, 371. https://doi.org/10.3389/fped.2018.00371.
Navazo, B./Oyhenart, E./Dahinten, S./Mumm,
R./Scheffler, C. (2020). Decrease of external skeletal robustness (Frame Index) between
two cohorts of school children living in Puerto Madryn, Argentina at the beginning of
the 21st century. Anthropologischer Anzeiger 77 (5), 405–413. https://doi.org/10.1127/anthranz/2020/1182.
NCD Risk Factor Collaboration (2017). Worldwide
trends in body-mass index, underweight, overweight, and obesity from 1975 to 2016: a
pooled analysis of 2416 population-based measurement studies in 128.9 million children,
adolescents, and adults. The Lancet 390 (10113), 2627–2642. https://doi.org/10.1016/S0140-6736(17)32129-3.
Nickerson, B. S./Esco, M. R./Fedewa, M. V./Park,
K.-S. (2020). Development of a body mass index-based body fat equation: effect of
handgrip strength. Medicine and Science in Sports and Exercise 52 (11), 2459–2465.
https://doi.org/10.1249/MSS.0000000000002383.
Plachta-Danielzik, S./Gehrke, M. I./Kehden,
B./Kromeyer-Hauschild, K./Grillenberger, M./Willhöft, C./Bosy-Westphal, A./Müller, M. J.
(2012). Body fat percentiles for German children and adolescents. Obesity Facts 5 (1),
77–90. https://doi.org/10.1159/000336780.
Pomeroy, E./Macintosh, A./Wells, J. C. K./Cole, T.
J./Stock, J. T. (2018). Relationship between body mass, lean mass, fat mass, and limb
bone cross-sectional geometry: implications for estimating body mass and physique from
the skeleton. American Journal of Physical Anthropology 166 (1), 56–69. https://doi.org/10.1002/ajpa.23398.
Prentice, A. M./Jebb, S. A. (2001). Beyond body
mass index. Obesity Reviews 2 (3), 141–147. https://doi.org/10.1046/j.1467-789x.2001.00031.x.
Preuschoft, H. (2004). Mechanisms for the
acquisition of habitual bipedality: are there biomechanical reasons for the acquisition
of upright bipedal posture? Journal of Anatomy 204 (5), 363–384. https://doi.org/10.1111/j.0021-8782.2004.00303.x.
Rietsch, K./Eccard, J. A./Scheffler, C. (2013a).
Decreased external skeletal robustness due to reduced physical activity? American
Journal of Human Biology 25 (3), 404–410. https://doi.org/10.1002/ajhb.22389.
Rietsch, K./Godina, E./Scheffler, C. (2013b).
Decreased external skeletal robustness in schoolchildren--a global trend? Ten year
comparison of Russian and German data. PloS One 8 (7), e68195. https://doi.org/10.1371/journal.pone.0068195.
Romero-Corral, A./Somers, V. K./Sierra-Johnson,
J./Korenfeld, Y./Boarin, S./Korinek, J./Jensen, M. D./Parati, G./Lopez-Jimenez, F.
(2010). Normal weight obesity: a risk factor for cardiometabolic dysregulation and
cardiovascular mortality. European Heart Journal 31 (6), 737–746. https://doi.org/10.1093/eurheartj/ehp487.
Schaffrath, Rosario A./Kurth, B.-M./Stolzenberg,
H./Ellert, U./Neuhauser, H. (2010). Body mass index percentiles for children and
adolescents in Germany based on a nationally representative sample (KiGGS 2003-2006).
European Journal of Clinical Nutrition 64 (4), 341–349. https://doi.org/10.1038/ejcn.2010.8.
Scheffler, C. (2010). The change of skeletal
robustness of 6-12 years old children in Brandenburg (Germany)--comparison of body
composition 1999-2009. Anthropologischer Anzeiger 68 (2), 153–165. https://doi.org/10.1127/0003-5548/2011/0095.
Scheffler, C./Hermanussen, M. (2014). Is there an
influence of modern life style on skeletal build? American Journal of Human Biology 26
(5), 590–597. https://doi.org/10.1002/ajhb.22561.
Scheffler, C./Hermanussen, M. (2018). Growth in
childhood and adolescence. In: W. Trevathan (Ed.). The international encyclopedia of
biological anthropology. Hoboken, NJ, Wiley Blackwell, 693–703.
Schilitz, A. (2001). Körperliche Entwicklung und
Körperzusammensetzung von Brandenburger Schulkindern im Geschlechter- und
Altersgruppenvergleich. Zugl.: Potsdam, Univ., Diss, 2001. Aachen,
Shaker.
Schüler, G. (2009). Potsdamer Längsschnittstudie:
Beurteilung der körperlichen Entwicklung vom Kleinkindalter bis zum frühen Schulalter
mit Hilfe von Somatometrie, Fotogrammetrie und Morphognose. Dissertation. Potsdam,
University of Potsdam.
Schwandt, P./Eckardstein, A: von/Haas, G.-M.
(2012). Percentiles of percentage body fat in german children and adolescents: an
international comparison. International Journal of Preventive Medicine 3 (12), 846–852.
https://doi.org/10.4103/2008-7802.104855.
Slaughter, M. H./Lohman, T. G./Boileau, R.
A./Horswill, C. A./Stillman, R. J./van Loan, M. D./Bemben, D. A. (1988). Skinfold
equations for estimation of body fatness in children and youth. Human biology 60 (5),
709–723.
Swinburn, B. A./Kraak, V. I./Allender, S./Atkins,
V. J./Baker, P. I./Bogard, J. R./Brinsden, H./Calvillo, A./Schutter, O. de/Devarajan,
R./Ezzati, M./Friel, S./Goenka, S./Hammond, R. A./Hastings, G./Hawkes, C./Herrero,
M./Hovmand, P. S./Howden, M./Jaacks, L. M./Kapetanaki, A. B./Kasman, M./Kuhnlein, H.
V./Kumanyika, S. K./Larijani, B./Lobstein, T./Long, M. W./Matsudo, V. K. R./Mills, S. D.
H./Morgan, G./Morshed, A./Nece, P. M./Pan, A./Patterson, D. W./Sacks, G./Shekar,
M./Simmons, G. L./Smit, W./Tootee, A./Vandevijvere, S./Waterlander, W. E./Wolfenden,
L./Dietz, W. H. (2019). The Global Syndemic of Obesity, Undernutrition, and Climate
Change: The Lancet Commission report. The Lancet 393 (10173), 791–846. https://doi.org/10.1016/S0140-6736(18)32822-8.
Tanner, J. M. (1962). Growth at adolescence. With
a general consideration af the effects of hereditary and environmental factors upon
growth and maturation from birth to maturity. 2nd ed. Oxford, Blackwell Scientific
Publications.
Ulijaszek, S. J./Lourie, J. A. (1994). Intra- and
inter-observer error in anthropometric measurement. In: C. G. N. Mascie-Taylor/S. J.
Ulijaszek (Eds.). Anthropometry. The individual and the population. Cambridge, Cambridge
University Press, 30–55.
Wells, J. C. K. (2014). Toward body composition
reference data for infants, children, and adolescents. Advances in Nutrition 5 (3),
320S-329S. https://doi.org/10.3945/an.113.005371.
Wells, J. C. K. (2018). Body composition. In: W.
Trevathan (Ed.). The international encyclopedia of biological anthropology. Hoboken, NJ,
Wiley Blackwell, 1–8.
Wickramasinghe, V. P. (2012). Hattori chart based
evaluation of body composition and its relation to body mass index in a group of Sri
Lankan children. Indian Journal of Pediatrics 79 (5), 632–639. https://doi.org/10.1007/s12098-011-0615-6.
Wohlfahrt-Veje, C./Tinggaard, J./Winther,
K./Mouritsen, A./Hagen, C. P./Mieritz, M. G./Renzy-Martin, K. T. de/Boas, M./Petersen,
J. H./Main, K. M. (2014). Body fat throughout childhood in 2647 healthy Danish children:
agreement of BMI, waist circumference, skinfolds with dual X-ray absorptiometry.
European Journal of Clinical Nutrition 68 (6), 664–670. https://doi.org/10.1038/ejcn.2013.282.
Woolcott, O. O./Bergman, R. N. (2019). Relative
fat mass as an estimator of whole-body fat percentage among children and adolescents: a
cross-sectional study using NHANES. Scientific Reports 9 (1), 15279. https://doi.org/10.1038/s41598-019-51701-z.