Association of socio-economic status with obesity and hypertension among the
adult Angami Naga of Nagaland, North-East India
Sudipta Ghosh ✉
✉
Department of Anthropology, North-Eastern Hill University, Shillong-793022,
India.
Department of Anthropology, North-Eastern Hill University, Shillong-793022,
India.
DOI: https://doi.org/10.52905/hbph2022.1.27
Abstract
BackgroundPrevalence of non-communicable diseases (NCDs) has been observed to be rapidly
increasing in developing countries. The impact of urbanization has led to the transition
of lifestyle and the socio-economic status of many tribal communities in India, who used
to be known for the prevalence of underweight and chronic energy deficiencies (CED).
ObjectiveThe present study aims to assess the prevalence of obesity and hypertension in relation
with the socio-economic status among the adult Angami Naga of Nagaland.
Sample and methodsA cross-sectional sample of 194 (108 males and 86 females) adult Angami Naga from
Kohima district, Nagaland participated in the study. Information was collected on
household’s socio-economic particulars. Anthropometric data on height (cm) and body
weight (kg), and on both systolic and diastolic blood pressure were measured on each
participant. Relative weight status was evaluated through body mass index (BMI). The
analysis includes chi square test for sex differences in the prevalence of obesity and
hypertension. Linear regression was used to examine the association of socio-economic
status with obesity and hypertension.
ResultsOur results indicate a high prevalence of hypertension among the Angami, for both SBP
(50.0% males vs. 29.1% females) and DBP (84.3% males vs. 46.5% females). High prevalence
of overweight and obesity (59.3% males vs. 50.0% females) was also observed. According
to the regression model, only age and sex were significantly associated with
hypertension. For overweight and obesity, only age showed significant association.
ConclusionThe main findings of the present study show that age and sex influence hypertension,
with males being more susceptible than females. However, overweight and obesity show no
sex difference although they are significantly influenced by age. Other unobserved
factors that were not captured in the study may also have affected obesity and
hypertension in Angami population.
Keywords: Angami Naga, adults, overweight/obesity, hypertension, socio-economic status
Conflict of Interest: There are no
conflicts of interest.
Citation: Peseyie, V. / Ghosh, S. (2022). Association of socio-economic status with obesity and hypertension among the
adult Angami Naga of Nagaland, North-East India. Human Biology and Public Health 1. https://doi.org/10.52905/hbph2022.1.27.
Copyright: This is an open access article distributed under the terms of the Creative Commons Attribution License which permits unrestricted use, distribution, and reproduction in any medium, provided the original author and source are credited.
Received: 01-11-2021 | Accepted: 05-05-2022 | Published: 14-09-2022
Take home message for students
External and/or environmental effects on obesity and hypertension can be multifactorial
and population specific. Males appear more susceptible to hypertension than females.
Contents
Introduction
Globally, high blood pressure (BP) is estimated to cause 7.1 million deaths per year, which
is about 13% of the total deaths. Moreover, overweight and obesity increase the risks of
high BP and other non-communicable diseases (NCDs), which are attributable to a body mass
index (BMI) above 21 kg/m2 (WHO 2002).
Non-communicable diseases (NCDs) or chronic diseases tend to be of long duration and are
known to be the result of a combination of factors including genetics, physiology,
environment and behavior. An increasing number of these diseases are attributed to certain
combined factors that include rapid unplanned urbanization, globalization of unhealthy
lifestyles and also population ageing. Unhealthy diets and a lack of physical activity may
show up in people as raised blood pressure, increased blood glucose, elevated blood lipids,
overweight and obesity (WHO 2014). A prospective
cohort study including 135 population-based studies of adults from 90 countries reports on
global disparities of hypertension prevalence, awareness, treatment and control. The
prevalence of hypertension decreased in high-income countries, whereas the burden of
hypertension appears to increase in low- and middle-income countries indicating an
increasing disparity of global hypertension (Mills et al.
2016). Another review study accounting for the difference in mean blood pressure of
different populations in the world reported differences in the prevalence of raised blood
pressure across regions, with the highest in South Asia and in Central Asia, the Middle East
and North Africa, and lowest in the high-income Asia Pacific and high-income Western regions
(Zhou et al. 2018). Worldwide, overweight and
obesity is a major public health concern, and it has been reported that there are more
overweight and obese than underweight adults. Both overweight and obesity have markedly
increased over the past four decades (WHO
2021).
India, being a low- and middle-income country, deals with the triple burden of
epidemiological transition like many other low- and middle-income countries. For example, it
was recently reported that more than 135 million individuals in this country were affected
by obesity and the prevalence of obesity in India varies due to age, sex, geographical
environment, socio-economic status and many other factors (Ahirwar and Mondal 2019). In fact, the study suggests that the prevalence of
overweight will more than double among Indian adults aged 20–69 years between 2010 and 2040,
while the prevalence of obesity will triple (Luhar et al.
2020). Alarmingly enough, a country traditionally known for malnutrition is now
reported more and more frequently with overweight, obesity, and their consequences (Kalra and Unnikrishnan 2012). Obesity is an important
risk factor for NCDs and the increasing prevalence of obesity, hypertension and diabetes,
poses enormous implications for the healthcare system in India (Babu et al. 2018). The Indian population is diversified with an
imbalance in rural-urban and slum areas. Studies reported on the double burden of
malnutrition, with both trends in undernutrition and rapidly rising problems of overweight
and obesity (Nguyen et al. 2021). Also, the
rural-urban convergence of hypertension in India is due to urbanization of rural populations
with consequent changes in lifestyles (sedentariness, high dietary salt, sugar and fat
intake) and increase in overweight and obesity (Gupta
2016).
The study and relationship of body mass index (BMI) and hypertension is of particular
interest to developing countries, especially among the indigenous populations. Studies on
different population groups highlight that there is a high prevalence of hypertension across
all socio-economic groups in India (). The National
Family Health Survey (NFHS-4) reported that for both males and females, the North-Eastern
states (except Meghalaya for men) have a higher prevalence of hypertension than the national
average (IIPS and ICF 2017). More specifically,
studies among the North-East Indians have reported a high prevalence of hypertension and
obesity in different tribal populations of the region (Khual and Limbu 2019; Lalnuneng 2022;
Limbu and Khual 2020; Maken and Varte 2013; Marbaniang
et al. 2021; Meshram et al. 2021) which
according to these studies may be because of the impact of urbanization and modernization
processes that have led to a major transition in diet and lifestyle of many tribal
communities. This is in contradiction with the studies reported on the tribal or indigenous
populations of other parts of India, who are known for a prevalence of undernutrition and
CED (Bose et al. 2006; Chakrabarty and Bharati 2010; Das
et al. 2008; Ghosh and Bhatrati 2005;
Ghosh 2017; Mittal and Srivastava 2006). This inconsistent reporting from various tribal
populations of India, compelled us to examine the cardiovascular and nutritional health of
the Angami Naga population of North-East India. Furthermore, it is perhaps worth mentioning
that the lifestyle and diet of this population has substantially changed in recent decades,
with increasing intake of carbohydrate and protein rich food from the markets to their usual
diet and living a more sedentary lifestyle. There has been an enormous transition in
lifestyle. More people are engaging themselves in less physically demanding jobs: Government
or private employed, businesses and others; whereas agriculture has become a secondary
option for many. These lifestyle changes can make the above-mentioned population more
vulnerable to develop NCDs. With that in mind, the present paper aims to investigate the
prevalence of obesity and hypertension among the Angami Naga of Nagaland, North-East India,
with special emphasis on their relationship with physical activity and socio-economic
status.
Sample and Methods
The Study Area and Population
The Angami Nagas are an indigenous population from Kohima and Dimapur districts of
Nagaland, North-East India. The average population density of Kohima district is 183
people per square kilometer. The total area is 1463 square kilometers and had a population
of 267,988 as per census 2011 (Census of India
2011). The Angami Naga belong to the Mongoloid group and linguistically fall
under the group of the Tibeto-Burman family. In general, they are agriculturists engaged
in different agricultural practices, such as dry cultivation of crops on the higher steep
slopes of the hills where irrigation of water from the streams is not possible; and wet
terrace cultivation, mainly for rice, on the hilly terrains. These are the main
traditional means of subsistence. The staple food of the Angami Naga is rice and their
diet usually consists of carbohydrate and protein-rich food, especially in terms of rice
and red/lean meat with fat. They also consume varieties of local vegetables or greens,
cultivated and/or from the wild flora.
The Sample
Cross-sectional data was collected on 194 adults (108 males and 86 females) Angami Naga
with age ranges from 18-59 years, from Kohima district, Nagaland. Participants were
selected by using the stratified random sampling method, by using age and sex criteria.
More specifically, the entire Angami population was stratified into two sexes and various
age groups and then above-mentioned age ranges were selected in each sex strata. Later,
equivalent numbers of male and female participants were randomly selected from each age
strata. Ethical clearance was taken from the board of Institutional Ethics Committee
(Human Model) of North-Eastern Hill University. Written and oral information regarding the
study was given to the respective village Headmen and written consent was obtained from
all the participants who were selected for this study.
Body Mass Index and Blood Pressure
Anthropometric measurements including height and body weight were measured following
Carter and Heath (Carter 2002). Height
measurements were taken using an anthropometer. The subject was standing straight against
an upright wall, touching the wall with heels, buttocks and back; the head was oriented in
Frankfort Horizontal (FH) Plane, the heels were touching together and the headboard was
lowered until it firmly touched the vertex and reading was taken. Body weight was measured
using a portable scale with the subject wearing minimal clothing and standing in the
center of the scale platform. Relative weight status was evaluated by calculating body
mass index (BMI = weight / height2; kg/m2). Standard BMI
classification was used following WHO cut-off points for Asian population (WHO 2004) as follows: underweight <18.5
kg/m2; normal weight 18.5–22.9 kg/m2; overweight 23.0–24.9
kg/m2 and obese 25.0 kg/m2. Blood pressure, both systolic (SBP)
and diastolic (DBP), was measured using a standard mercury sphygmomanometer (Diamond
Mercurial Type Conventional BP Monitor-Deluxe). Measurements were taken on the left hand
with the subject seated. Systolic blood pressure was recorded as the first Korotkoff
sound. Diastolic blood pressure was taken as the disappearance of the Korotkoff sound
(Beevers 2001). Blood pressure categories were
defined following Joint National Committee VII protocols (NHLBI 2004), which are as following: normal: SBP<120 mmHg and DBP
<80 mmHg; prehypertension: SBP 120–139 mmHg and/or DBP 80–89 mmHg; and hypertension:
SBP≥140 mmHg and/or DBP90 mmHg.
Socio-Economic Parameters
An open-ended interview schedule was used to collect information on the socio-economic
status (SES) of each participant. Income classes were categorized on the basis of the
monthly income and primary occupation of the participants. Data on protein consumption was
collected following recall method of the last one week before the survey by developing
open-ended and close-ended questions on different types of protein items, like meat, egg,
fish etc., following the protocols developed by the Indian Council of Medical Research
(ICMR 2010). Data on physical activity was
collected by using a list of activities performed and their intensity in terms of
metabolic equivalents (METs), and the duration (in minutes) of each participant in the
past 24 hours. Types of physical activity and hours spent were calculated using the
structured schedule, as prescribed in the Global Physical Activity Questionnaire (GPAQ)
developed by WHO (WHO, 2016) and physical activity levels were classified following the
tools and techniques developed by Gerrior (Gerrior
et al. 2006).
Statistical Analysis
The collected data was analyzed using IBM-SPSS Statistics Version 20. T-test and
chi-square test were used to evaluate sex and age group differences in the anthropometric
and physiological variables. Linear Regression analysis followed, by considering BMI, SBP
and DBP as dependent variables; and age, sex, income class, physical activity level and
frequency of protein consumption per week as independent variables. For all the
statistical analyses, 5% probability level (p<0.05) was used for the level of
significance. In the regression model, all the dependent variables were considered
simultaneously and the independent categorical variables like sex, income class, physical
activity level and frequency of protein consumption per week, were re-coded and
incorporated by means of dummy variables, in the following manner:
| • | Sex: 1=males, 2=females |
| • | Income class: 1=Low Income Group (Monthly family income Rs21,000); 2=High Income Group (Monthly family income
Rs22,000) |
| • | Physical activity level: 1=Inactive, 2=Active |
| • | Protein Consumption (Frequency per week): 1=Low (3 times a week), 2=High (4 times a week) |
Results
Population Characteristics
The background information of socio-economic status of the Angami Naga, based on the
variables for this study (Table 1), revealed that the majority of them belonged to the
middle- (55.6% males) and low-income class (47.7% females); showing significant difference
(p<0.05) between the distribution of income level between males and females. Similarly,
the majority was found to be ‘very active’ (60.2% male vs. 86.0% female) according to
their physical activity level. However, there was a significant difference (p<0.001) in
the distribution of activity levels with more males being found in the low active level
category than females (Table 1). Protein
consumption was found to be mostly three days a week (49.1% males vs. 54.7% females),
followed by more than four days a week (34.3% males vs. 23.3% females), irrespective of
the sex difference.
Table 1 Background information of socio-economic variables among the adult Angami, by
sex
| Socio-Economic Variables |
Male (N=108) |
Female (N=86) |
| Age group |
N |
% |
N |
% |
| 18-39 years |
54 |
50.0 |
37 |
43.0 |
| 40-59 years |
54 |
50.0 |
49 |
57.0 |
| Test |
0.936 |
| p-value |
0.205 |
| Income class (per month, in rupees) |
N |
% |
N |
% |
| Low (20,000) |
27 |
25.0 |
41 |
47.7 |
| Middle (21,000-40,000) |
60 |
55.6 |
38 |
44.2 |
| High (41,000) |
21 |
19.4 |
7 |
8.1 |
| Test |
12.487 |
| p-value |
0.002 |
| Physical activity level |
N |
% |
N |
% |
| Low active |
12 |
11.1 |
4 |
4.7 |
| Active |
31 |
28.7 |
8 |
9.3 |
| Very active |
65 |
60.2 |
74 |
86.0 |
| Test |
15.856 |
| p-value |
0.000 |
| Protein consumption (Days per week) |
N |
% |
N |
% |
| Low (2) |
18 |
16.7 |
19 |
22.1 |
| Medium (3) |
53 |
49.1 |
47 |
54.7 |
| High (4) |
37 |
34.3 |
20 |
23.3 |
| Test |
3.001 |
| p-value |
0.223 |
Anthropometric and Physiological Characteristics
Descriptive statistical analyses of anthropometric and physiological characteristics
revealed statistically significant (p<0.01) sex differences in blood pressure, but not
in body mass index and age (Table 2). Males had
significantly higher levels of blood pressure, in both SBP (138.94±13.64 males vs.
132.14±15.14 females) and DBP (97.19±8.44 males vs. 88.98±9.06 females). BMI was similar
in males and females (23.96±4.28 males vs. 23.38±3.82 females).
Table 2 Descriptive statistics (Mean±SD) of anthropometric and physiological
characteristics among adult Angami, by sex
| Anthropometric and Physiological Measures |
Male |
Female |
t-value |
| Mean |
SD |
Mean |
SD |
| Age (years) |
38.12 |
12.24 |
36.92 |
11.58 |
0.71 |
| Body mass index (kg/m2) |
23.96 |
4.28 |
23.38 |
3.82 |
0.99 |
| SBP≠ (mmHg) |
138.94 |
13.64 |
132.14 |
15.14 |
3.28 |
| DBP≠ (mmHg) |
97.19 |
8.441 |
88.98 |
9.06 |
6.51 |
Prevalence of Obesity and Hypertension
The frequency distribution of BMI and blood pressure, by sex and age groups are presented
in Table 3. In particular, overweight and obesity
were observed to be high among the adult Angami Naga (59.3% males vs. 50.0% females).
Prevalence of overweight+obesity among the females of age group 18-39 years was lower than
compared to their male counterpart of the same age group (Table 3).
Table 3 Frequency distribution of body mass index and blood pressure variables among
adult Angami, by age groups and sex
Physiological
Parameters |
Age groups |
| 18-39 (N=103) |
40-59 (N=91) |
All age groups (N=194) |
| Male (N=54) |
Female (N=49) |
Male (N=54) |
Female (N=37) |
Male (N=108) |
Female (N=86) |
| N |
% |
N |
% |
N |
% |
N |
% |
N |
% |
N |
% |
| Body Mass Index |
| Underweight |
4 |
7.4 |
8 |
16.3 |
7 |
13.0 |
1 |
2.7 |
11 |
10.2 |
9 |
10.5 |
| Normal |
20 |
37.0 |
18 |
36.7 |
13 |
24.1 |
16 |
43.2 |
33 |
30.6 |
34 |
39.5 |
| Overweight and obesity |
30 |
55.6 |
23 |
46.9 |
34 |
63.0 |
20 |
54.1 |
64 |
59.3 |
43 |
50.0 |
|
Test |
2.125 |
5.455 |
1.866 |
| p-value |
0.346 |
0.065 |
0.393 |
| Systolic Blood Pressure Categories |
| Normal |
4 |
7.4 |
5 |
10.2 |
2 |
3.7 |
1 |
2.7 |
6 |
5.6 |
6 |
7.0 |
| Prehypertension |
30 |
55.6 |
37 |
75.5 |
18 |
33.3 |
18 |
48.6 |
48 |
44.4 |
55 |
64.0 |
| Hypertension |
20 |
37.0 |
7 |
14.3 |
34 |
63.0 |
18 |
48.6 |
54 |
50.0 |
25 |
29.1 |
| Test |
6.875 |
2.156 |
8.739 |
| p-value |
0.032 |
0.340 |
0.013 |
| Diastolic Blood Pressure Categories |
| Normal |
1 |
1.9 |
5 |
10.2 |
0 |
0.00 |
0 |
0.00 |
1 |
0.9 |
5 |
5.8 |
| Prehypertension |
14 |
25.9 |
30 |
61.2 |
2 |
3.7 |
11 |
29.7 |
16 |
14.8 |
41 |
47.7 |
| Hypertension |
39 |
72.2 |
14 |
28.6 |
52 |
96.3 |
26 |
70.3 |
91 |
84.3 |
40 |
46.5 |
| Test |
20.082 |
12.145 |
31.395 |
| p-value |
0.000 |
0.001 |
0.000 |
BMI depends on age. Both males and females tend to show an increase in overweight and
obesity with advancing age (Figure 1). In both
males and females, the highest prevalence of overweight+obesity was observed in the 40-59
years age category (63.0% males vs. 54.1% females). There was no significant BMI
difference among the age groups in both males and females (p>0.05; Figure 1).
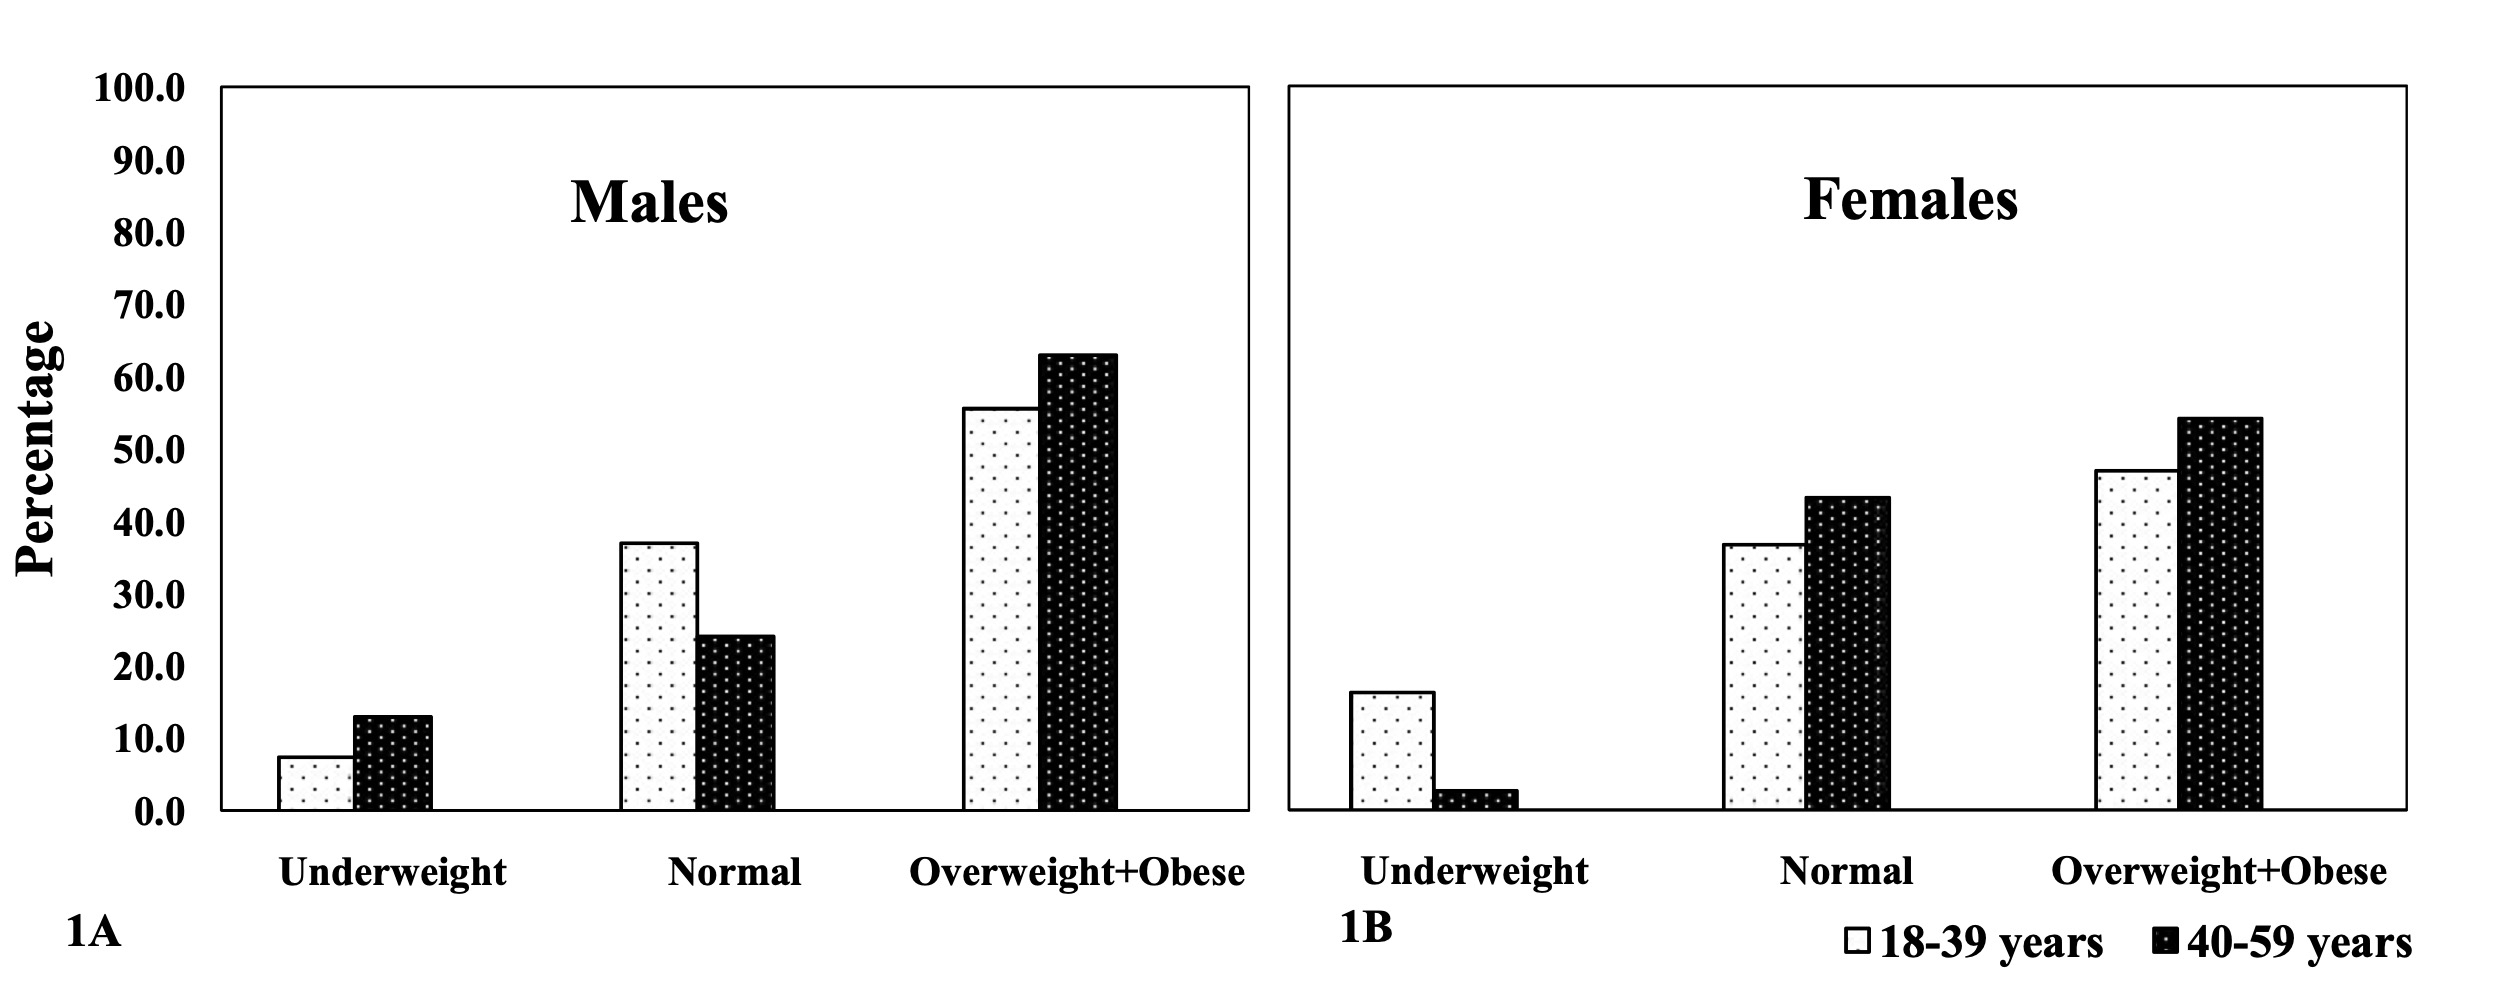
Figure 1 Body Mass Index amongst the adult Angami Naga males (1A) and females (1B), by
age groups. test (age group differences): males: 2.553 (p-value:
>0.05); females: 4.178 (p-value: >0.05).
The prevalence of hypertension in systolic blood pressure was significantly higher
(p<0.01) in males than in their female counterparts (50.0% males vs. 29.1% females).
Systolic hypertension was higher in the age group 40-59 years, in both males and females
(63.0% males vs. 48.6% females) than in the age group 18-39 years (37.0% males vs. 14.3%
females). Nevertheless, it was alarming to observe that in both males and females,
systolic pre-hypertension was more prevalent in the 18-39 years age category (55.6% males
vs. 75.5% females) than in the 40-59 years age category (33.3% males vs. 48.6% females).
Overall, pre-hypertension in systolic blood pressure was significantly more prevalent
(p<0.01) among females than males (44.4% males vs. 64.0% females). Similarly,
hypertension in diastolic blood pressure was significantly more prevalent (p<0.001) in
males than in females (84.2% males vs. 46.5% females). Diastolic hypertension was more
frequent in the 40-59 years age group (96.3% males vs. 70.3% females) than in the 18-39
years age category (72.2% males vs. 28.6% females) (Table 3). Overall, significant age group differences in the prevalence of
hypertension were found in both males and females, in systolic (test=7.296 males and test=12.642 females, p<0.05; Figure 2) and diastolic
(test=11.857 males, p<0.05 and test=16.043 females, p<0.001; Figure 3) blood pressures (Figure 2
& 3).
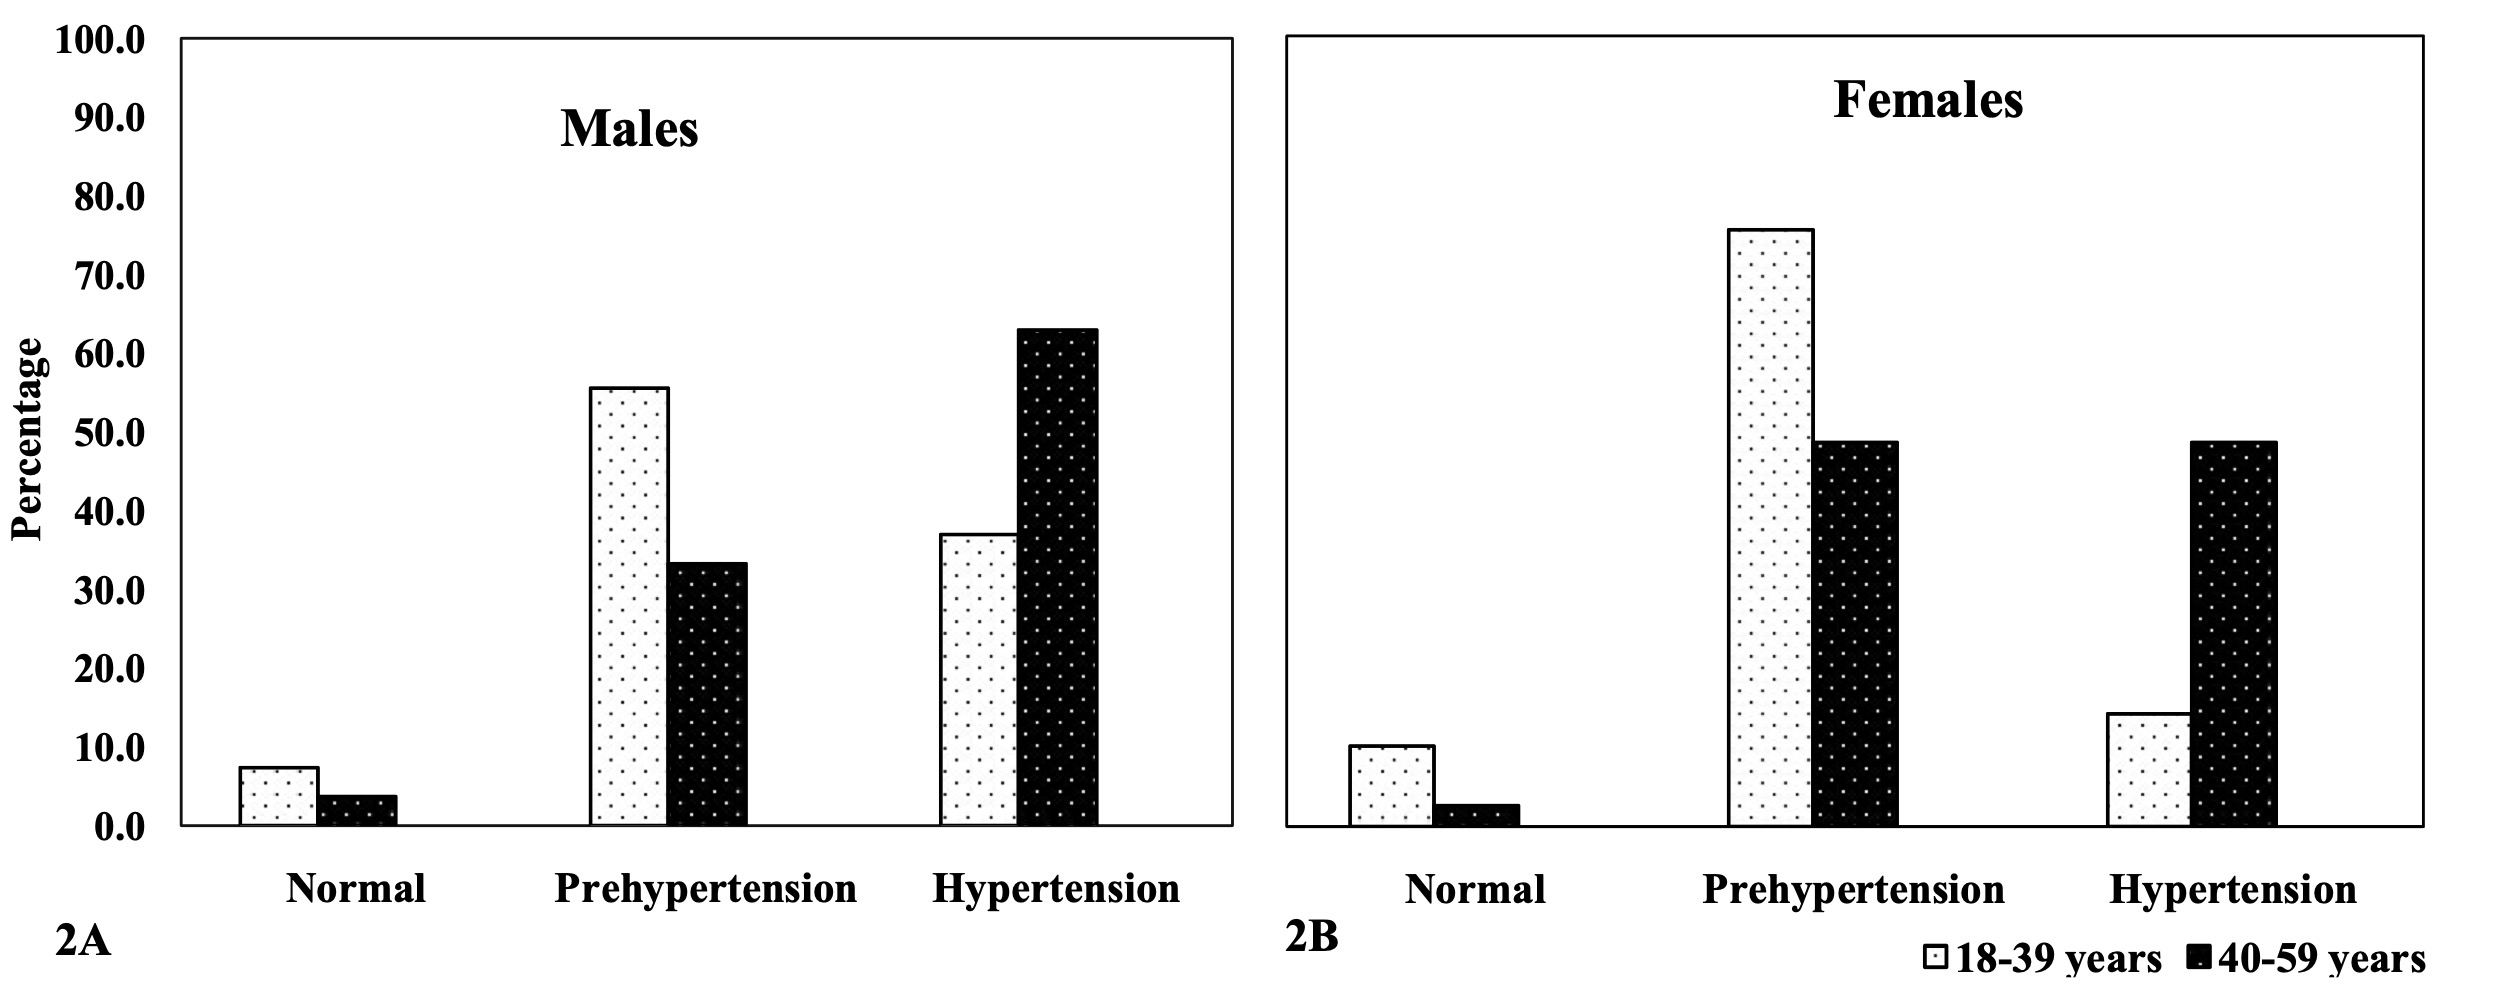
Figure 2 Systolic Blood Pressure amongst the adult Angami Naga males (2A) and females
(2B), by age groups, test (Age groups differences): Males: 7.296 (p-value:
<0.05); Females: 12.642 (p-value: <0.05).
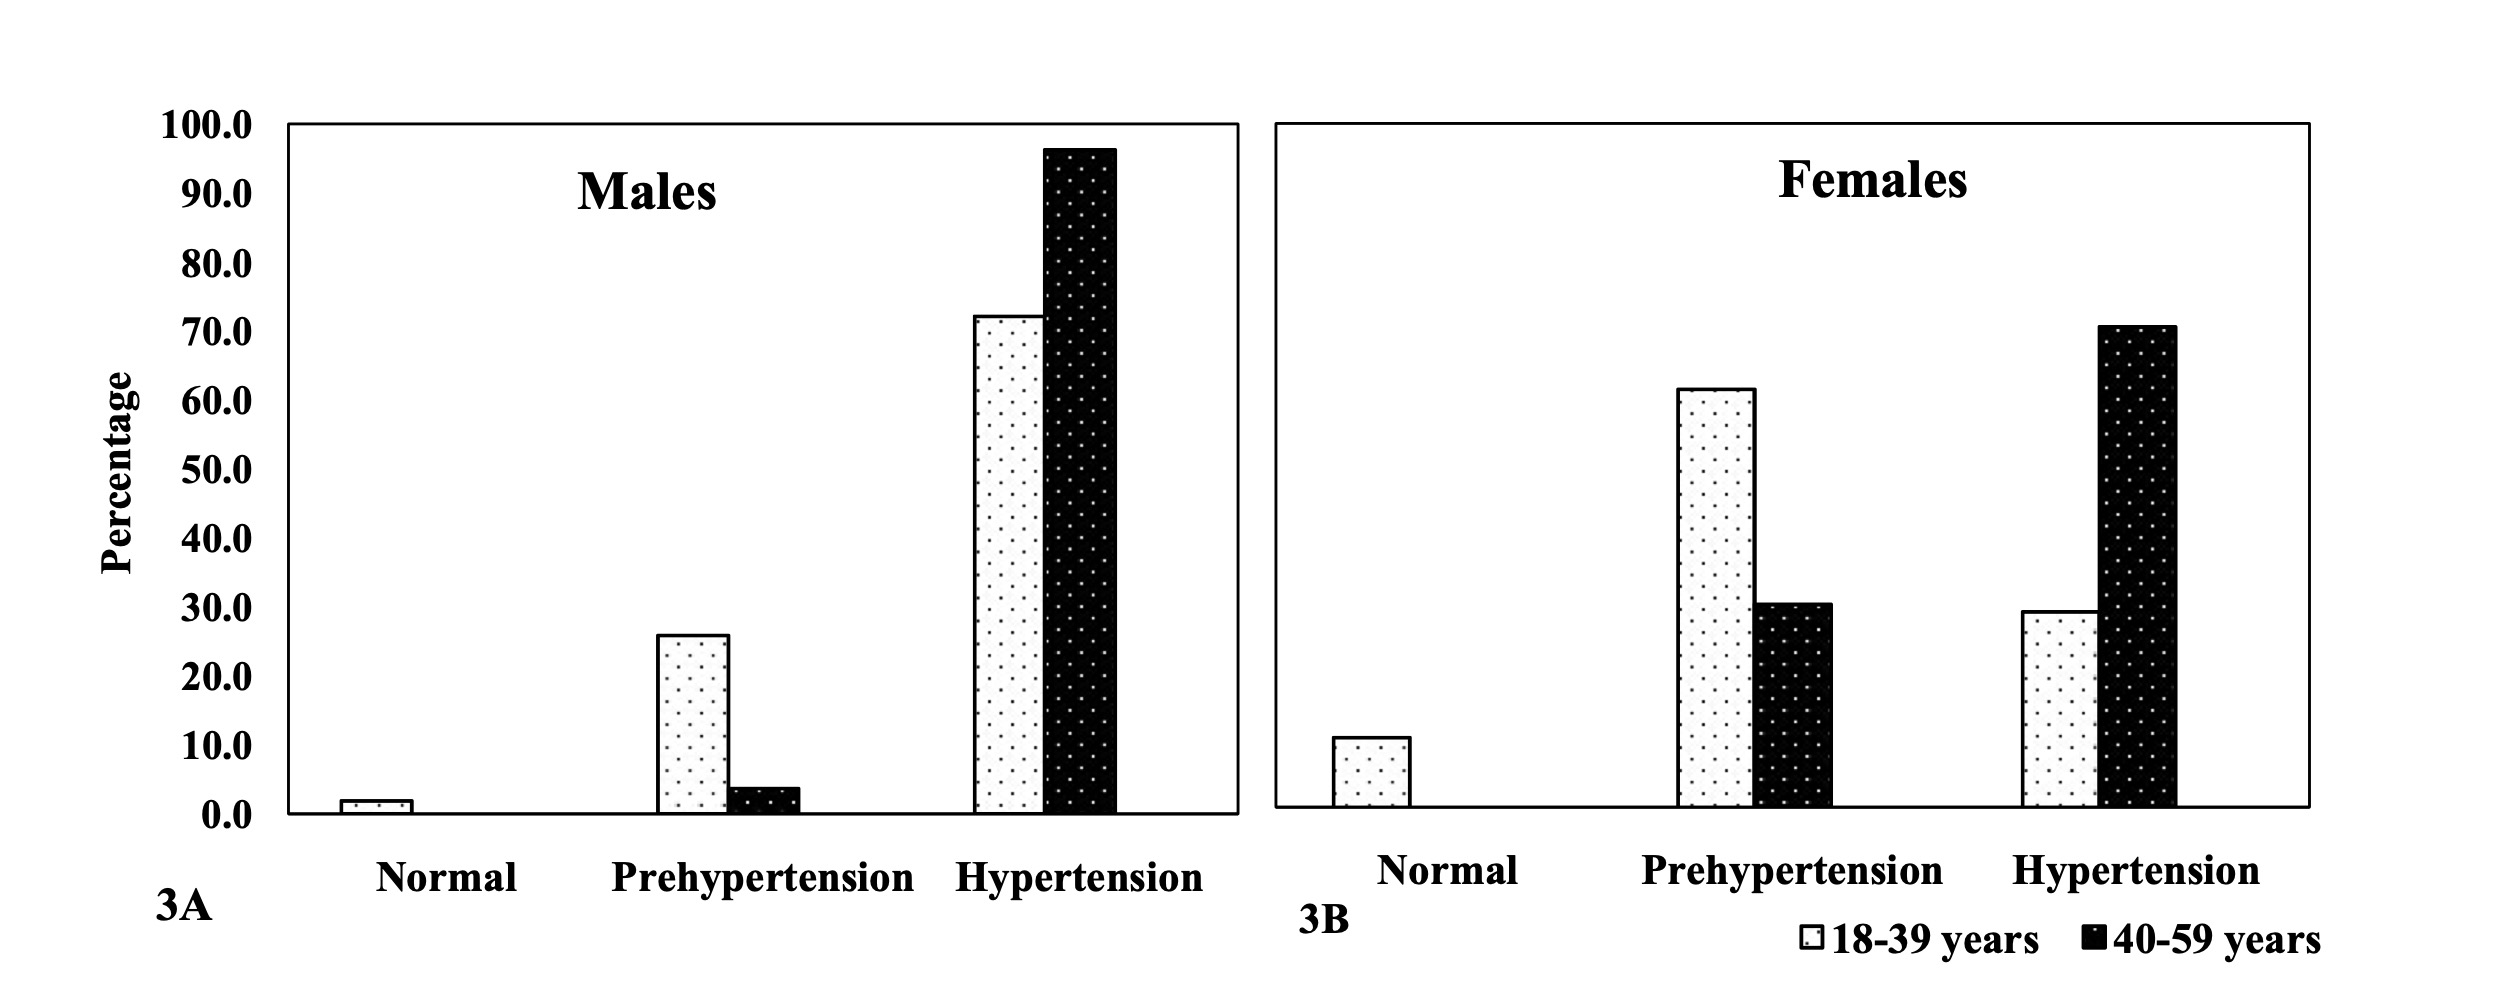
Figure 3 Diastolic Blood Pressure amongst the adult Angami Naga males (3A) and females
(3B), by age groups, test (age group differences): males: 11.857 (p-value:
<0.05); females: 16.043 (p-value: <0.001).
Effect of Demographic and Socio-economic factors on BMI and Blood Pressure
Table 4 presents the results of the linear
regression model for the analysis of socio-economic and demographic factors on blood
pressure and BMI and shows important influences of age (β= 0.539, p<0.001) and sex (β =
-6.234, p<0.05) on SBP. Similarly, significant effects of age (β= 0.364, p<0.001)
and sex (β = -8.123, p<0.001) were also evident on DBP. Age (β=0.056, p<0.05) was
significantly associated with BMI, but not sex (p>0.05). Socio-economic variables like
income class, physical activity level and protein consumption show no significant effects
(p>0.05) on neither blood pressure nor BMI among the Angami (Table 4). The results show that the adult Angami Naga are
susceptible to develop obesity and are also prone to become hypertensive, in both SBP and
DBP.
Table 4 Linear Regression Result: Effect of socio-economic factors on SBP, DBP and BMI
| Dependent Variables |
Confounding variables |
β-coefficient |
Standard error |
t-value |
p-value |
| SBP |
Age |
0.539 |
0.080 |
6.761 |
0.000 |
| Sex |
-6.234 |
1.991 |
-3.132 |
0.002 |
Income Class≠
(LIG
vs.HIG) |
0.027 |
2.185 |
0.012 |
0.990 |
Physical Activity Level
(Inactive vs.
Active) |
-0.793 |
2.224 |
-0.357 |
0.722 |
Protein Consumption
(Low vs. High) |
-2.628 |
2.210 |
-1.189 |
0.236 |
| DBP |
Age |
0.364 |
0.047 |
7.766 |
0.000 |
| Sex |
-8.123 |
1.169 |
-6.946 |
0.000 |
Income Class≠
(LIG
vs.HIG) |
0.282 |
1.283 |
0.219 |
0.827 |
Physical Activity Level
(Inactive vs.
Active) |
0.969 |
1.306 |
0.742 |
0.459 |
Protein Consumption
(Low vs. High) |
-1.500 |
1.299 |
-1.155 |
0.249 |
| BMI |
Age |
0.056 |
0.025 |
2.261 |
0.025 |
| Sex |
-0.683 |
0.616 |
-1.108 |
0.269 |
Income Class≠
(LIG
vs.HIG) |
0.512 |
0.677 |
0.757 |
0.450 |
Physical Activity Level
(Inactive vs.
Active) |
1.335 |
0.689 |
1.939 |
0.054 |
Protein Consumption
(Low vs. High) |
0.566 |
0.684 |
0.827 |
0.409 |
Discussion
The present paper aims to examine the prevalence of obesity and hypertension among the
adult Angami Naga. High prevalence of overweight and obesity along with hypertension were
observed in both males and females of this community. Several recent studies, in this
regard, have reported on the prevalence of NCD risk factors in tribal populations residing
in different parts of India (Kandpal et al. 2016;
Kshatriya et al. 2016; Sajeev and Soman 2018; Tripathi
2020). Furthermore, a high prevalence of NCD risk factors like obesity and
hypertension was also reported from the neighboring populations of North-East India, such as
the Padam (Adi) of Arunachal Pradesh (Limbu and Khual
2020), the Mishing of Assam (Misra et al.
2014), the Hmars of Manipur (Lalnuneng and
Khongsdier 2017), the tribal populations of Mokokchung, Nagaland (Tushi et al. 2018), Tangkhul Naga of Manipur (Mungreiphy et al. 2011), and the Ao of the Mokokchung
District, Nagaland (Maken and Varte 2013). It is
alarming to note that indigenous or tribal populations, including the present population,
who were known for undernutrition, now suffer from NCD risk factors like obesity and
hypertension.
In this study, hypertension was significantly associated with advancing age. Similar
results were also observed by previous researchers in many Indian populations, including
tribal populations (Lalnuneng 2022) (Lalnuneng and Khongsdier 2017; Mungreiphy et al. 2011; Singh et al.
2017; Tripathi 2020). However, the study
from Kolkata showed no effect of age and sex on the cardiovascular disease (CVD) risk
factors (Das et al. 2008). In our study, males were
more hypertensive than females. Similar results were reported in studies on the prevalence
of hypertension in other populations of India (Singh
et al. 2017; Tripathi 2020). However, a
study on the tribal populations from different regions of India reported contradicting
results with higher prevalence of hypertension in females (14.0%) than in their male
counterparts (9.2%) (Kshatriya et al. 2016). Sex
differences in the prevalence of hypertension may be attributed to differences in dietary
habits, lifestyle, physical activity levels and genetic polymorphisms (Ruixing et al. 2008). Considering the significant (p<0.001) physical
activity level differences between males and females, this could be the primary reason
behind the elevated blood pressure among the Angami males. Moreover, no sex influence was
observed in the BMI of Angami, suggesting that might not play any role in the sex
differences in the prevalence of hypertension in this population. In line with the
above-mentioned reasoning, previous studies have also suggested that physical inactivity is
positively associated with obesity and blood pressure in adults of Delhi, India (Devi et al. 2020) and also in the population of rural
South India (Little et al. 2016). Moreover, high
prevalence of hypertension among the hill tribe of the Mizoram (Borah et al. 2020) and the Hmars of Manipur of North-East India (Lalnuneng and Khongsdier 2017) was observed among
individuals with low level of physical activity. Contradicting to these studies, even among
physically active individuals, a high prevalence of hypertension and obesity was observed
among the Wanchos of Arunachal Pradesh, North-East India (Basumatary and Begum 2020).
Overweight and obesity were significantly associated with advancing age in the present
population. Similarly, age showed significant association with overweight and obesity among
the Rengma adults of North-East India (Rengma et al.
2015) and the Tangkhul Naga of Manipur (Mungreiphy et al. 2011). Although studies in India have shown that the prevalence
of obesity among females was significantly higher as compared to males (Ahirwar and Mondal 2019), our study showed no
significant sex difference in BMI. The challenge of controlling obesity and hypertension was
observed to be enormous in Asia. Changes in socio-economic status and lifestyle have led to
a co-existence of obesity and undernourishment in some Asian countries (Chu and Singh 2021). Studies in different Indian
populations showed that the socio-economic conditions does influence BMI and blood pressure
of individuals (Borah et al. 2020; Devi et al. 2020; Lalnuneng and Khongsdier 2017; Limbu and Khual
2020; Little et al. 2016; Rengma et al. 2015; Shridhar et al. 2018; Singh et al. 2017).
The importance of certain behavioral factors, such as of increased physical activity levels,
to reduce the risk of hypertension has been well documented (Börjesson et al. 2016; Liu et al.
2017). Although income status did not show significant associations with
hypertension and overweight+obesity in the present study, associations of income and
overweight+obesity and hypertension were observed in studies from North-East India (Marbaniang et al. 2021; Rengma et al. 2015). In a prospective cohort study, red meat (both
processed and unprocessed) and poultry consumption was associated with a higher risk of
hypertension (Zhang and Zhang 2018). A dietary
pattern with high meat-consumption was positively associated with cardio-metabolic risk
factors in India (Shridhar et al. 2018). In a study
on people residing in urban areas of Delhi, Chennai and Karachi reported that high dietary
diversity appeared to be protective against cardio-metabolic disease risk factors, yet, with
hypertension as one of the risk factors (Kapoor et al.
2018). A study among the North-East Indian population by Marbaniang et al. (Marbaniang et al. 2021) mentioned that the indigenous
people of North-East India are habituated in consuming a wide variety of wild edible fruits
and local vegetables. Such a diet with fruits, vegetables and low-fat dairy products, as
well as enhanced physical activity and controlling sodium intake, had a greater effect on
decreasing blood pressure levels in hypertensive adults and on stabilizing weight. However,
a study among the population of rural South India reported that animal fat intake (saturated
fats in milk products and meat) was negatively associated with BMI (Little et al. 2016). Our result did not show any significant
association of protein intake with overweight/obesity and hypertension, even though
participants consumed lean/red meat more than thrice a week. It was observed that overweight
and obesity and hypertension is prevalent among the Angami, irrespective of their physical
activity, income status and meat intake and hence are not influenced by these parameters. In
other words, no significant association of socio-economic factors with obesity and
hypertension was observed in the present study.
Conclusion
The main findings of the present study showed that Angami males tend to be more susceptible
to hypertension than their female counterparts. The prevalence of overweight and obesity
along with hypertension seem to be exaggeratedly high among the Angami Naga for both males
and females as compared to other neighboring populations of North-East India. As observed in
other studies, the impact of sedentary lifestyle, especially in terms of low or very low
physical activity may have played a role on the health of this population. These changes
must have led to a steady susceptibility to obesity and hypertension, even among the Angami.
In the past, people often engaged in vigorous physical activity and strenuous work in the
fields; agriculture being the only means of subsistence back then. Perhaps, a diet including
carbohydrate with increased protein intake in the form of meat was required at that time.
However, with the changed subsistence pattern, the same dietary pattern of meat intake and
low physical activity might have resulted into observed prevalence of NCD risk factors.
Nevertheless, other unobserved factors not included in the present study may also have
affected the present situation of obesity and hypertension. Owing to the limited number of
variables in the present study, we suggest a more well-designed introspective study to
further elaborate the issues examined in this study on the factors influencing NCD risk
factors that lead to metabolic diseases even among the indigenous populations, who were
traditionally known for undernutrition and CED.
References
Ahirwar, R./Mondal, P. R. (2019). Prevalence of
obesity in India: A systematic review. Diabetes Metab. Syndr. Clin. Res. Rev. 13 (1),
318–321. https://doi.org/10.1016/j.dsx.2018.08.032.
Babu, G. R./Murthy, G. V.S./Ana, Y./Patel,
P./Deepa, R./Neelon, S. E. B./Kinra, S./Reddy, K. S. (2018). Association of obesity with
hypertension and type 2 diabetes mellitus in India: A meta-analysis of observational
studies. World J. Diabetes 9 (1), 40–52. https://doi.org/10.4239/wjd.v9.i1.40.
Basumatary, J./Begum, G. (2020). Risk factors of
hypertension and physical activity level among the adult Wanchos of Arunachal
Pradesh.pdf. Antrocom Online J. Anthropol. 16 (1), 187–195.
Beevers, G. (2001). ABC of hypertension: Blood
pressure measurement. BMJ 322 (7292), 981–985. https://doi.org/10.1136/bmj.322.7292.981.
Borah, P. K./Mahanta, J./Kalita, H.
C./Bhattacharjee, Ch. K. (2020). Distribution of hypertension subtypes in a hill tribe
of Mizoram, Northeast India. Indian Heart J 72 (5), 398–402. https://doi.org/10.1016/j.ihj.2020.08.003.
Börjesson, M./Onerup, A./Lundqvist, S./Dahlöf, B.
(2016). Physical activity and exercise lower blood pressure in individuals with
hypertension: narrative review of 27 RCTs. Br. J. Sports Med. 50 (6), 356–361. https://doi.org/10.1136/bjsports-2015-095786.
Bose, K./Ganguly, S./Mamtaz, H./Mukhopadhyay,
A./Bhadra, M. (2006). Bose et al 2005 High prevalence of undernutrition among adult Kora
Mudi tribals of Bankura district West Bengal India.pdf. Anthropol. Sci. 114,
65–68.
Carter, J. (2002). Part 1: The Heath-Carter
Anthropometric Somatotype - Instruction Manual -. Instr. Man. (March),
1–25.
Census of India (2011). District Census Handbook,
Nagaland. Dir. Census Oper. Nagal. SERIES-12 (PART XII-B), 308.
Chakrabarty, S./Bharati, P. (2010). Adult body
dimension and determinants of chronic energy deficiency among the Shabar tribe living in
urban, rural and forest habitats in Orissa, India. Ann. Hum. Biol. 37 (2), 150–168.
https://doi.org/10.3109/03014460903234742.
Chu, D.-T./Singh, V. (2021). Obesity and
hypertension in Asia: Current status and challenges. Lancet Reg. Heal. - West. Pacific
15, 100243. https://doi.org/10.1016/j.lanwpc.2021.100243.
Das, M./Pal, S./Ghosh, A. (2008). Rural urban
differences of cardiovascular disease risk factors in adult Asian Indians. Am. J. Hum.
Biol. 20 (4), 440–445. https://doi.org/10.1002/ajhb.20757.
Devi, K. S./Nilupher/Gupta, U./Dhall, M./Kapoor,
S. (2020). Incidence of obesity, adiposity and physical activity pattern as risk factor
in adults of Delhi, India. Clin. Epidemiol. Glob. Heal. 8 (1), 8–12. https://doi.org/10.1016/j.cegh.2019.03.008.
Gerrior, S./Wenyen, J./Basiotis, P. (2006). An
Easy Approach to Calculating Estimated Energy Requirements.pdf. Centers Dis. Control
Prev. 3 (4), 1–4.
Ghosh, R./Bhatrati, P. (2005). Women’s Status and
Health of Two Ethnic Groups Inhabiting a Periurban Habitat of Kolkata City, India: A
Micro-Level Study. Health Care Women Int 26 (3), 194–211. https://doi.org/10.1080/07399330590917753.
Ghosh, S. (2017). Understanding chronic energy
deficiency among population living under limited nutritional resources.pdf. Coll.
Antropol. 41 (4), 327–334.
Gupta, R. (2016). Convergence in urban–rural
prevalence of hypertension in India. J. Hum. Hypertens. 30 (2), 79–82. https://doi.org/10.1038/jhh.2015.48.
Gupta, R./Gaur, K./Ram, C. V. S. (2019). Emerging
trends in hypertension epidemiology in India. J. Hum. Hypertens. 33 (8), 575–587.
https://doi.org/10.1038/s41371-018-0117-3.
ICMR (2010). Nutrient requirements and recommended
dietary allowances for Indians. Indian Council of Medical Research. New
Delhi.
IIPS/ICF (2017). National Family Health Survey
(NFHS 4) 2015-16.pdf. Natl. Fam. Heal. Surv.
Kalra, S./Unnikrishnan, A. G. (2012). Obesity in
India The weight of the nation.pdf. J. Med. Nutr. Nutraceuticals 1 (1),
37–41.
Kandpal, V./Sachdeva, M. P./Saraswathy, K. N.
(2016). An assessment study of CVD related risk factors in a tribal population of India.
BMC Public Health 16 (1), 434. https://doi.org/10.1186/s12889-016-3106-x.
Kapoor, D./Iqbal, R./Singh, K./Jaacks, L.
M./Shivashankar, R./Sudha, V./Anjana, R. M./Kadir, M./Mohan, V./Ali, M. K./Narayan, K.
M./Tandon, N.l/Prabhakaran, D./Merchant, A. T. (2018). Association of dietary patterns
and dietary diversity with cardiometabolic disease risk factors among adults in South
Asia: The CARRS study. Asia Pac. J. Clin. Nutr. 27 (6), 1332–1343. https://doi.org/10.6133/apjcn.201811_27(6).0021.
Khual, G. K./Limbu, D. K. (2019). Prevalence of
Obesity and Hypertension Among the Zou Mothers of Manipur, Northeast India. Orient.
Anthropol. A Bi-annual Int. J. Sci. Man 19 (1), 112–120. https://doi.org/10.1177/0972558X19835388.
Kshatriya, G. K./Acharya, S. K./Gonzalez-Bulnes,
A. (2016). Triple Burden of Obesity, Undernutrition, and Cardiovascular Disease Risk
among Indian Tribes. PLoS One 11 (1), e0147934. https://doi.org/10.1371/journal.pone.0147934.
Lalnuneng, A. (2022). Age variation in blood
pressure: Rural–urban and sex differences among the Hmar adults of Manipur, Northeast
India. Am. J. Hum. Biol. 34 (3). https://doi.org/10.1002/ajhb.23656.
Lalnuneng, A./Khongsdier, R. (2017). Rural-Urban
Differences in Hypertension among the Hmars of Manipur in Northeast India. Anthropol 28
(3), 173–183. https://doi.org/10.1080/09720073.2017.1349627.
Limbu, D. K./Khual, G. K. (2020). Influence of BMI
on Blood Pressure among the Padam of Arunachal Pradesh.pdf. Thar Multidiscip. J.,
22–32.
Little, M./Humphries, S./Patel, K./Dewey, C.
(2016). Factors associated with BMI, underweight, overweight, and obesity among adults
in a population of rural south India: a cross-sectional study. BMC Obes 3 (1), 12.
https://doi.org/10.1186/s40608-016-0091-7.
Liu, X./Zhang, D./Liu, Y./Sun, X./Han, C./Wang,
B./Ren, Y./Zhou, J./Zhao, Y./Shi, Y./Hu, D./Zhang, M. (2017). Dose–Response Association
Between Physical Activity and Incident Hypertension. Hypertension 69 (5), 813–820.
https://doi.org/10.1161/HYPERTENSIONAHA.116.08994.
Luhar, S./Timæus, I. M./Jones, R./Cunningham,
S./Patel, S. A./Kinra, S./Clarke, L./Houben, R./Joe, W. (2020). Forecasting the
prevalence of overweight and obesity in India to 2040. PLoS One 15 (2), e0229438.
https://doi.org/10.1371/journal.pone.0229438.
Maken, T./Varte, L-R. (2013). Anthropometric
indicators as predictors of high blood pressure among the Ao tribe of Northeast
India.pdf. Asian J. Med. Sci. 4 (3), 15–22.
Marbaniang, S. P./Lhungdim, H./Yadav,
B./Yajurvedi, V. K. (2021). Overweight/obesity risks and prevalence of diabetes and
hypertension in North Eastern India: An analysis using seemingly unrelated probit model.
Clin. Epidemiol. Glob. Heal. 11, 100764. https://doi.org/10.1016/j.cegh.2021.100764.
Meshram, I./Boiroju, N. K./Longvah, T. (2021).
Prevalence of overweight/obesity, hypertension and its associated factors among women
from Northeast India. Indian Heart J. https://doi.org/10.1016/j.ihj.2021.12.009.
Mills, K. T./Bundy, J. D./Kelly, T. N./Reed, J.
E./Kearney, P. M./Reynolds, K./Chen, J./He, J. (2016). Global Disparities of
Hypertension Prevalence and Control. Circulation 134 (6), 441–450. https://doi.org/10.1161/CIRCULATIONAHA.115.018912.
Misra, P. J./Mini, G. K./Thankappan, K. R. (2014).
Risk factor profile for non-communicable diseases among Mishing tribes in Assam, India:
results from a WHO STEPs survey. Indian J. Med. Res. 140 (3), 370–378.
Mittal, P. C./Srivastava, S. (2006). Diet,
nutritional status and food related traditions of Oraon tribes of New Mal (West Bengal),
India.pdf. Rural Remote Health 6 (385), 1–11. Available online at http://rrh.deakin.edu.au.
Mungreiphy, N. K./Kapoor, S./Sinha, R. (2011).
Association between BMI, Blood Pressure, and Age: Study among Tangkhul Naga Tribal Males
of Northeast India. J. Anthr. 2011, 1–6. https://doi.org/10.1155/2011/748147.
Nguyen, P. H./Scott, S./Headey, D./Singh, N./Tran,
L. M./Menon, P./Ruel, M. T./Goli, S. (2021). The double burden of malnutrition in India:
Trends and inequalities (2006–2016). PLoS One 16 (2), e0247856. https://doi.org/10.1371/journal.pone.0247856.
NHLBI (2004). The seventh report of the joint
national committee on prevention, detection, evaluation, and treatment of high blood
pressure (JNC 7). National Heart Lung and Blood Institute.
Rengma, M. S./Sen, J./Mondal, N. (2015).
Socio-Economic, Demographic and Lifestyle Determinants of Overweight and Obesity among
Adults of Northeast India. Ethiop. J. Health Sci. 25 (3), 199. https://doi.org/10.4314/ejhs.v25i3.2.
Ruixing, Y./Jinzhen, W./Shangling, P./Weixiong,
L./Dezhai, Y./Yuming, C. (2008). Sex Differences in Environmental and Genetic Factors
for Hypertension. Am. J. Med. 121 (9), 811–819. https://doi.org/10.1016/j.amjmed.2008.04.026.
Sajeev, P./Soman, B. (2018). Prevalence of
noncommunicable disease risk factors among the Kani tribe in Thiruvananthapuram
district, Kerala. Indian Heart J 70 (5), 598–603. https://doi.org/10.1016/j.ihj.2018.01.022.
Shridhar, K./Satija, A./Dhillon, P. K./Agrawal,
S./Gupta, R./Bowen, L./Kinra, S./Bharathi, A. V./Prabhakaran, D./Srinath Reddy,
K./Ebrahim, S. (2018). Association between empirically derived dietary patterns with
blood lipids, fasting blood glucose and blood pressure in adults - the India migration
study. Nutr. J. 17 (1), 15. https://doi.org/10.1186/s12937-018-0327-0.
Singh, S./Shankar, R./Singh, G. P. (2017).
Prevalence and Associated Risk Factors of Hypertension: A Cross-Sectional Study in Urban
Varanasi. Int. J. Hypertens. 2017, 1–10. https://doi.org/10.1155/2017/5491838.
Tripathi, N. (2020). Prevalence of Hypertension in
Indian Tribal Adult population: A Scoping Review. J. Adv. Res. Med. 07 (01), 5–13.
https://doi.org/10.24321/2349.7181.202002.
Tushi, A./Rao, S. R./Pattabi, K./Kaur, P. (2018).
Prevalence of risk factors for noncommunicable diseases in a rural tribal.pdf. Natl.
Med. J. India 31 (1), 11–14.
WHO (2002). The world health report reducing risks
promoting healthy life.pdf. World Heal. Organ.
WHO (2004). Public health Appropriate body-mass
index for Asian populations and its implications for policy and intervention strategies.
World Heal. Organ. 363, 157–163.
WHO (2014). Global status report on
noncommunicable diseases.pdf. World Heal. Organ.
WHO (2021). Overweight and obesity.pdf. World
Heal. Organ.
Zhang, Y./Zhang, D. (2018). Red meat, poultry, and
egg consumption with the risk of hypertension: a meta-analysis of prospective cohort
studies. J. Hum. Hypertens. 32 (7), 507–517. https://doi.org/10.1038/s41371-018-0068-8.
Zhou, B./Bentham, J./di Cesare, M./Bixby,
H./Danaei, G./Hajifathalian, K./Taddei, C./Carrillo-Larco, R. M./Djalalinia,
S./Khatibzadeh, S./Lugero, C./Peykari, N./Zhang, W. Z./Bennett, J./Bilano, V./Stevens,
G. A./Cowan, M. J./Riley, L. M./Chen, Z./ … /Cisneros, J. Z. (2018). Contributions of
mean and shape of blood pressure distribution to worldwide trends and variations in
raised blood pressure: a pooled analysis of 1018 population-based measurement studies
with 88.6 million participants. Int. J. Epidemiol. 47 (3), 872-883i. https://doi.org/10.1093/ije/dyy016.