Correlation between childhood episodes of stress and long bone-ratios in
samples of medieval skeletons - using linear enamel hypoplasia as proxy
Cecilie Cordua Mattsson ✉
✉
ADBOU, Institute of Forensic Medicine, University of Southern Denmark,
Campusvej 55, DK 5230 Odense M, Denmark.
DOI: https://doi.org/10.52905/hbph2021.3.23
Abstract
Background
Linear enamel hypoplasia (LEH) in the canines is used as an indicator of ill health in
early childhood. LEH is assumed to be an indicator of catch-up growth in archeological
material. Previous research indicated that certain body proportions were altered due to
catch-up growth during childhood.
Objectives
The aim of this study was to assess whether catch-up growth during childhood affects
the long bone ratios of the arms and legs of adults.
Sample and Methods
Positive or negative scores for LEH in the four canines and anthropometric measurements
of humerus, radius, femur, and tibia were obtained for 67 skeletons from two Danish
medieval cemeteries in Nordby (Jutland) and Refshale (Lolland). Age and sex was
estimated to see if any uneven distribution was present. The data was processed using
the St. Nicolas house analysis, t-tests, univariate ANOVA and Kaplan-Meier survival
analyses.
Results
The St. Nicolas house analysis showed no correlation between hypoplasia score and
anthropometric measurements. No statistically significant difference was found between
the long bone ratios of the arms and legs in adults with and without LEH.
Conclusion
Contrary to earlier research on body proportions in Medieval Denmark this study showed
no significant difference in the long bone ratios of arms and legs associated with LEH.
It did, however, find an alteration of femur and tibia length associated with
hypoplasia. The findings indicate that males and females react differently to
physiological stress in childhood.
Keywords: Early childhood stress, linear enamel hypoplasia, catch-up growth, anthropometrics, body proportions, Danish medieval cemeteries
Conflict of Interest: There are no
conflicts of interest.
Citation: Mattsson, C. (2021). Correlation between childhood episodes of stress and long bone-ratios in
samples of medieval skeletons - using linear enamel hypoplasia as proxy. Human Biology and Public Health 3. https://doi.org/10.52905/hbph2021.3.23.
Copyright: This is an open access article distributed under the terms of the Creative Commons Attribution License which permits unrestricted use, distribution, and reproduction in any medium, provided the original author and source are credited.
Received: 18-10-2021 | Accepted: 31-03-2022 | Published: 16-06-2022
Take home message for students
Linear enamel hypoplasia is associated with an alteration of femur and tibia length of
males and females from medieval Danish cemeteries, but not with the ratio of the long
bones. The findings indicate that males and females react differently to physiological
stress in childhood.
Contents
Introduction
Conventionally, human growth is seen as a target-seeking process (Tanner 1986). But recent research suggests that human height to a large
extend depends on the living conditions and a person’s social, economic, political and
emotional (SEPE) environment (Bogin 2021; Hermanussen and Scheffler 2016) height tends to cluster
(Aßmann and Hermanussen 2013b; Hermanussen and Scheffler 2016; Jørkov 2015). When a child reaches adolescence and experiences the
adolescent growth spurt, he/she tends to follow a distal-to-proximal growth pattern; first
the feet, hands, and the distal parts of the lower and upper extremities starts to grow,
thereafter the proximal parts of the extremities and last, the central parts of the skeleton
(Hermanussen 2013). Humans grow for a limited time
and reach final height in early adulthood, which means that adjustments to body height are
limited to this period of life (Hermanussen and Scheffler
2016).
Different factors can influence an individual’s growth. If the child experiences
physiological stress such as malnutrition or severe illness it may stop to grow. Although
the causes of growth failure can be many, the response to overcome is one: the child resumes
growing and experiences catch-up growth (Tanner
1986). Catch-up growth is characterized by height velocity above the limits of
normal for age for at least 1 year after a transient period of growth inhibition (Hermanussen 2013; Wit
and Boersma 2002; Wit et al. 2013).
In archeological material, linear enamel hypoplasia (LEH) is a sign of physiological stress
during childhood. LEH is defined as horizontal lines of deficiencies of the thickness of the
enamel in the labial or buccal surface of the tooth crown (Boldsen 2007; Marchewka et al. 2014). In
paleopathology, LEH is generally used as an unspecific indicator of physiological stress
during childhood. It is used as an indicator of growth stop in early childhood.
The physiological mechanisms controlling catch-up growth are unknown. Based on Boldsen (1998)
who stated “… secondly, in regaining size after such episodes – through catch up growth –
certain body proportions were altered” an idea evolved regarding a possible pattern of
catch-up growth in historic samples: Catch-up growth will lead to simultaneous growth of the
whole body so that the three ratios between the proximal and distal arm- and leg-bones
(humerus/radius and femur/tibia) and upper and lower extremities (arms/legs) will decrease.
The overall hypothesis for this study was developed: Adults scored positive for hypoplasia
will have smaller bone-ratios than adults scored negative for hypoplasia.
In contrast to Boldsen (1998) who studied vertebrae, this study was based on anthropometric
measurements of humerus, radius, femur, and tibia, and the ratio between the proximal and
distal arm bones (humerus/radius), the ratio between the proximal and distal leg bones
(femur/tibia), and the ratio between the arms and legs ((arm ratio)/(leg ratio)).
Sample and Methods
Sample
The skeleton material for this study was excavated from the two Danish medieval
cemeteries Nordby in Jutland and Refshale on Lolland. The Nordby cemetery was excavated in
1996 and is assumed to have been in use in The Middle Ages from approx. AD 1050 to 1250.
From the Nordby cemetery a total of 235 skeletons were excavated (Lynnerup et al. 2000). There have been multiple excavations of the
Refshale cemetery, the first in 1969 and the last in 1994, where a total of 218 skeletons
were excavated. The cemetery of Refshale is estimated to have been in use from around AD
1100 until mid-14th century (Lolland-Falster Museum
2020). Due to the clay soil combined with the fact that the excavation has taken
place in cultivated land many of the bones from Refshale were broken.
Only skeletons of people who survived into adulthood were analyzed. A skeleton is
classified as an adult if all epiphyses of the long bones had fused prior to death.
Methods
The teeth scored positive for LEH were classified as having a visible line seen with the
naked eye and/or felt by carefully scratching the labial surface of the canine enamel. To
insure no false negative score of LEH the teeth were only scored with “0” or “1” if more
than half of the tooth crown was visible, otherwise the score was “/” indicating that the
relevant skeletal parts were not preserved. Enamel of the canines mineralizes around the
age 2 to 5 years (Boldsen 2007), and thus, defined
the age period of investigation for childhood stress of the individuals of this study.
Maximum length of humerus (1, page 199), radius (1, page 201), femur (1, page 217), and
tibia (1a, page 220) were measured according to (Knussmann 1988), and registered in millimeters. If bones were broken postmortem,
in not more than two pieces and could be fitted at the location of the break, the maximum
length was measured. If bones were broken in more than two pieces or partially missing the
score “/” was registered.
Age at death was estimated visually by “standard method” with different age markers in
the cranium, pelvis, and postcranial skeleton (Milner
and Boldsen 2012). An overall assessment of the age-related changes of the long
bones including the proximal femur was made (Tarp
2017). Sex was estimated visually by markers in the cranium, pelvis and
postcranial skeleton (White and Folkens 2005).
Sex was scored from 1 to 7, with 1 and 2 for male, 6 and 7 for female, and “4” for
undeterminable (Table 1).
All skeletons were registered for sex, for age at death, and for LEH in the four canines.
Maximum length of left and right humerus, radius, femur, and tibia were measured in
millimeters. The material consisted of 67 individuals providing reliable information of
the individual and at leasst the measurement of humerus and radius or femur and tibia.
Table 1 Sex estimation scores used for sex determination of the sample.
| Score |
Description: |
| / |
Sex cannot be estimated – the relevant skeletal parts
are not preserved |
| 1 |
Clear male morphology |
| 2 |
Predominantly male morphology |
| 3 |
Slight male morphology |
| 4 |
Sex indeterminable/children |
| 5 |
Slight female morphology |
| 6 |
Predominantly female morphology |
| 7 |
Clear female morphology |
Statistics
To get a first impression of data St. Nicolas House Analysis (SNHA) (Hermanussen et al. 2021) was used. The dataset was
analyzed using the Shapiro-Wilk normality test to check for normal distribution,
subsequently the Welch two sample t-test was used to test the hypothesis. A univariate
ANOVA was used to compare the means of the long bones and their ratios in correlation to
sex and hypoplasia. A Kaplan-Meier survival analysis was applied to test for mortality
differences between the sexes.
Most of the statistical analyses were performed using the statistical program R studio
version 1.2.5033 for Mac. For SNHA the R package “asg” (Groth et al. 2019; Hermanussen et al.
2021) was used. Waterfall chart was made in Microsoft Excel version 16.53 for
Mac. The crosstabulation of sexxhypoplasia, Kaplan-Meier survival analysis, and
univariate analysis of variance was performed in IBM SPSS Statistics version 28.0.0.0 for
Mac.
Results
The material consisted of 67 individuals (37 females, 29 males, one indeterminable). Nearly
three quarters (71.6%, 48 individuals) of the individuals in the sample were scored positive
(1) for LEH in the canines, whereas only 19 individuals were scored negative (0).
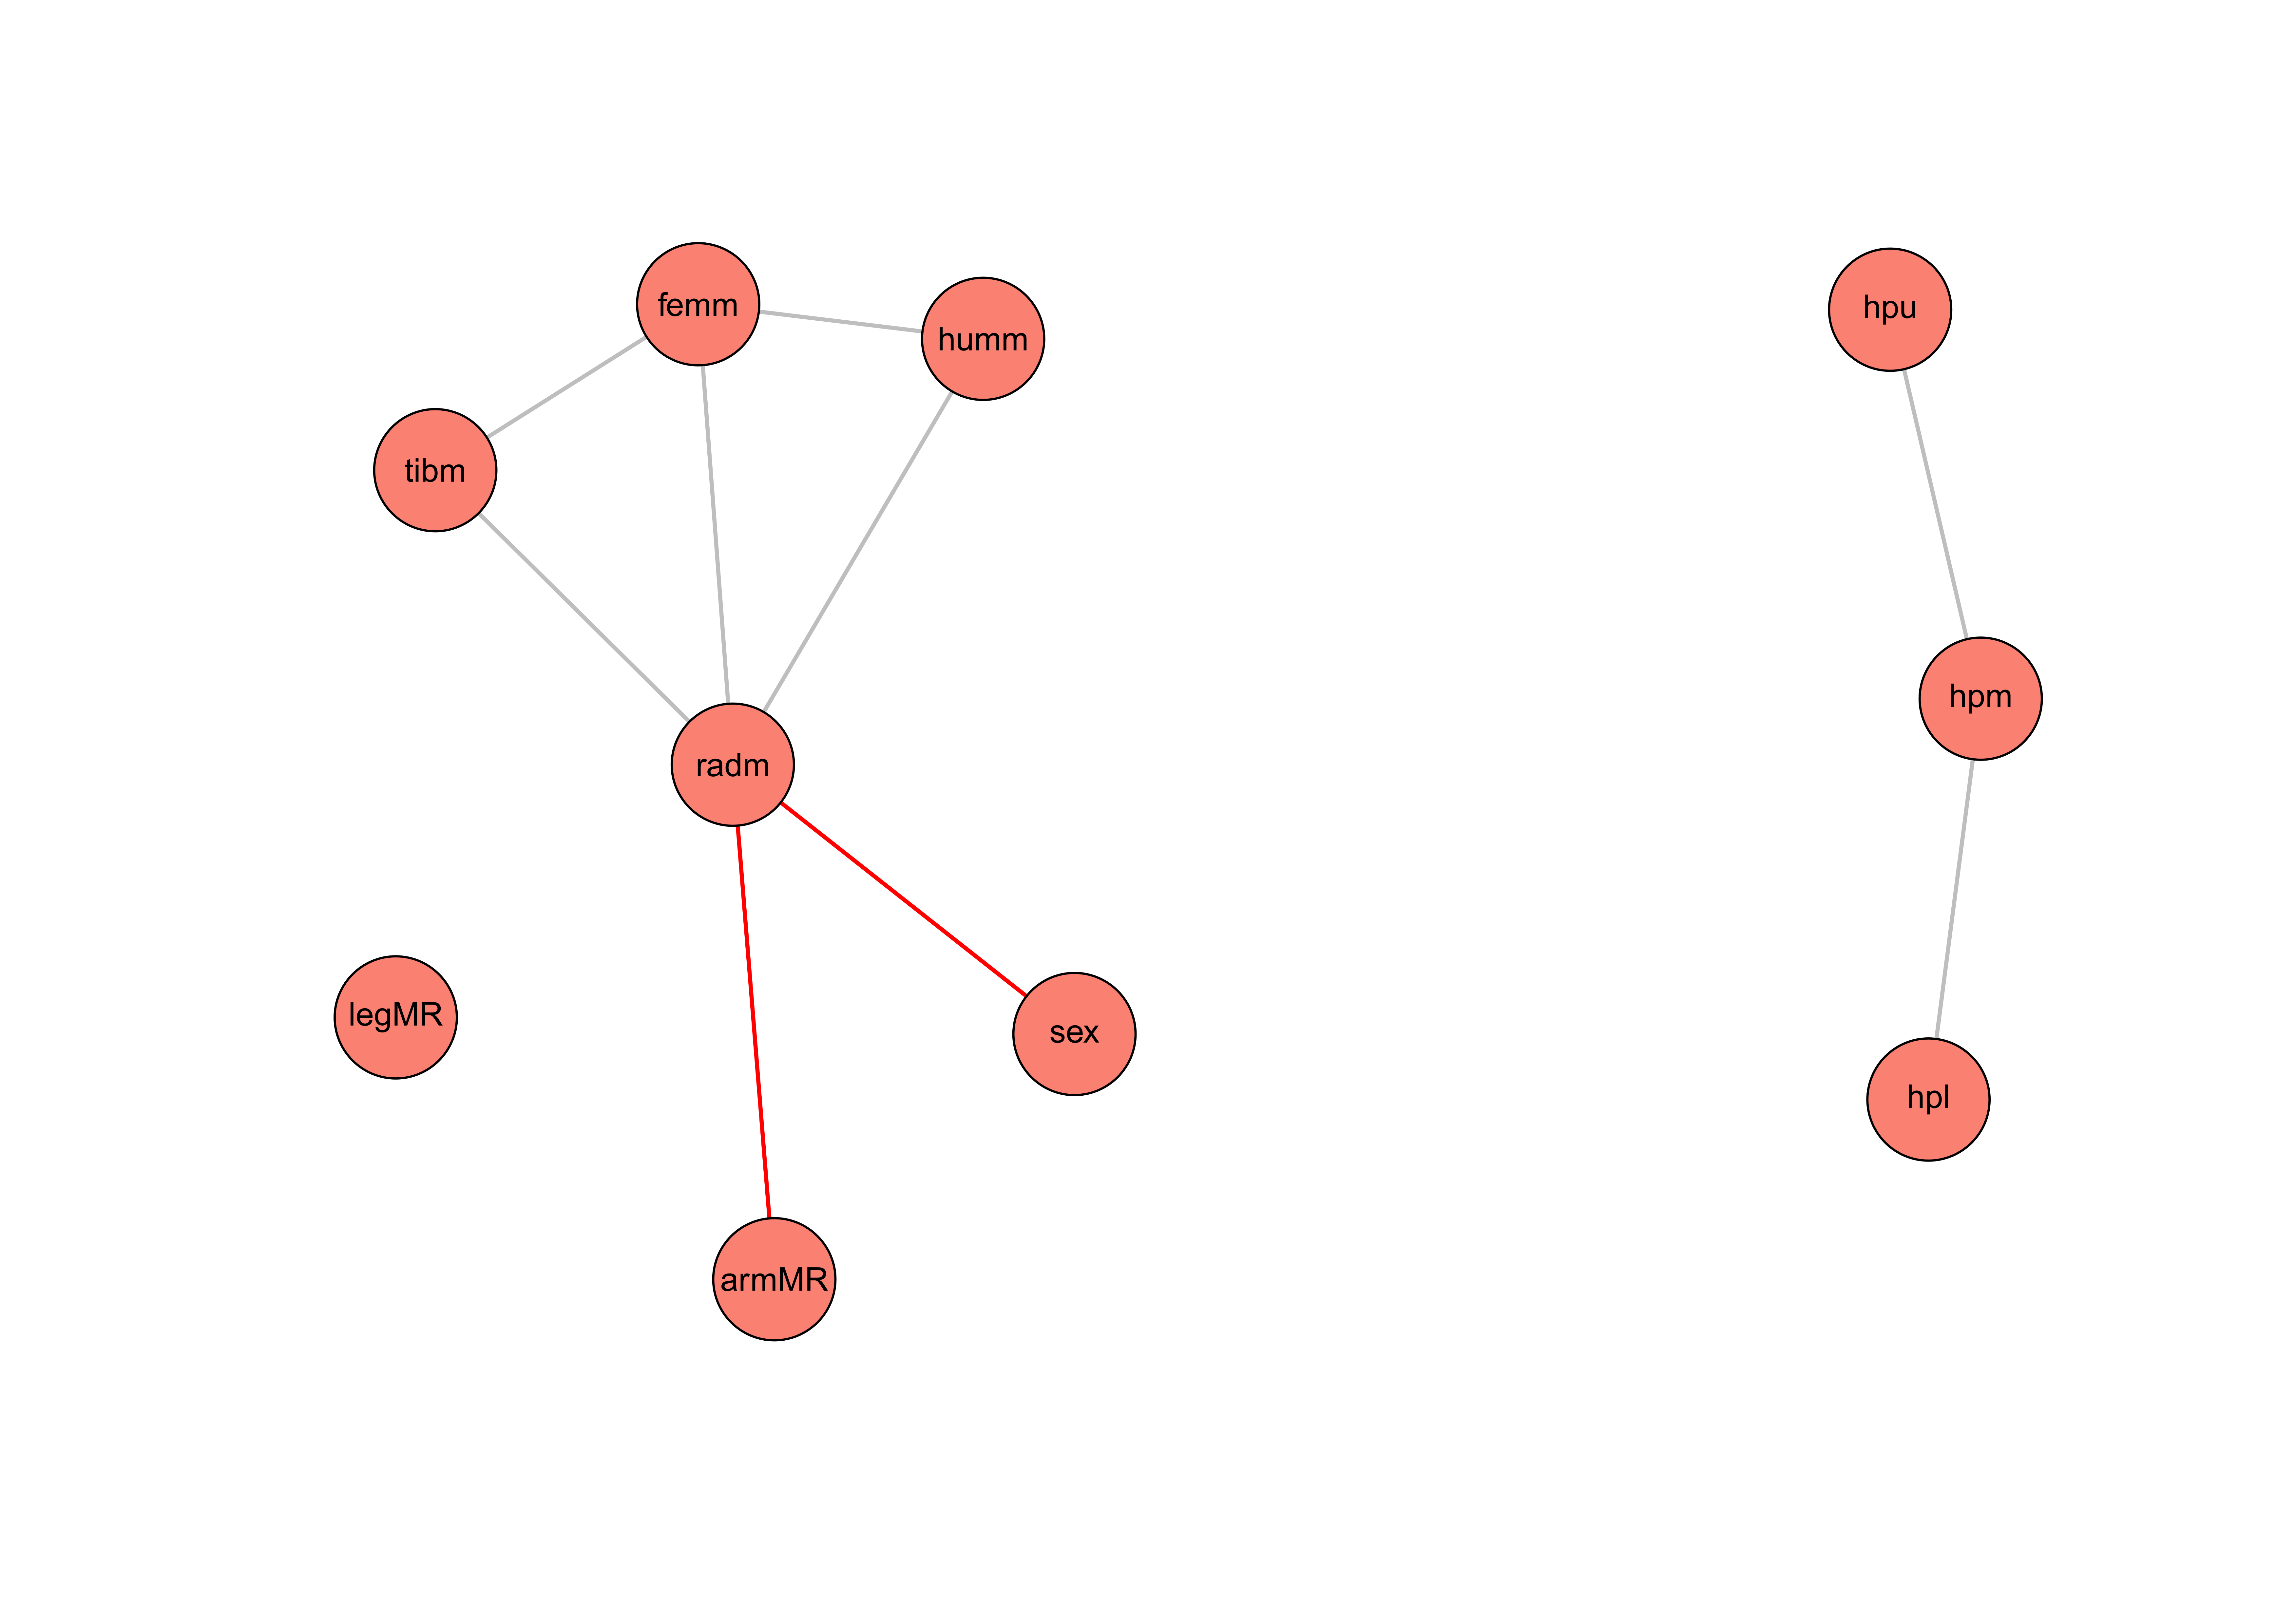
Figure 1 SNHA for the bone measurements, hypoplasia scores and sex. Alpha = 0.05 and
threshold = 0.001. Red lines = negative asssociation, grey lines = positive association.
hpl = hypoplasia lower, hpm = hypoplasia mean, hpu = hypoplasia upper, armMR = arm mean
ratio, humm = humerus mean, radm = radius mean, sex = sex, femm = femur mean, tibm =
tibia mean, legMR = leg mean ratio.
Initially, the SNHA was applied to get an idea of what to expect from the analysis. The
SNHA plot, Figure 1, is built based on the Spearman
correlation matrix, Figure 2, with alpha = 0.05 and a threshold = 0.001. The SNHA plot shows
a positive correlation between the hypoplasia mean scores (hpm) of the four canines and the
scores for the upper (hpu) and lower (hpl) canines. The hpm variable is computed with the
mean value of the four hypoplasia scores. The hpm variable can therefore also be seen as a
kind of probability for childhood stress. The hpu and hpl are variables computed of the
upper and lower canines scores – if the left-side score is available this is used, otherwise
the right-side score is used. The association chains between hpm, hpu, and hpl indicate that
there is no direct correlation between the scores of the upper and lower canines.
Furthermore, there is no correlation either between the LEH scores and the anthropometric
measurements nor the sex of the individuals, not even with an alpha = 0.2. As expected, the
SNHA shows a correlation between the mean values of the anthropometric measurements.
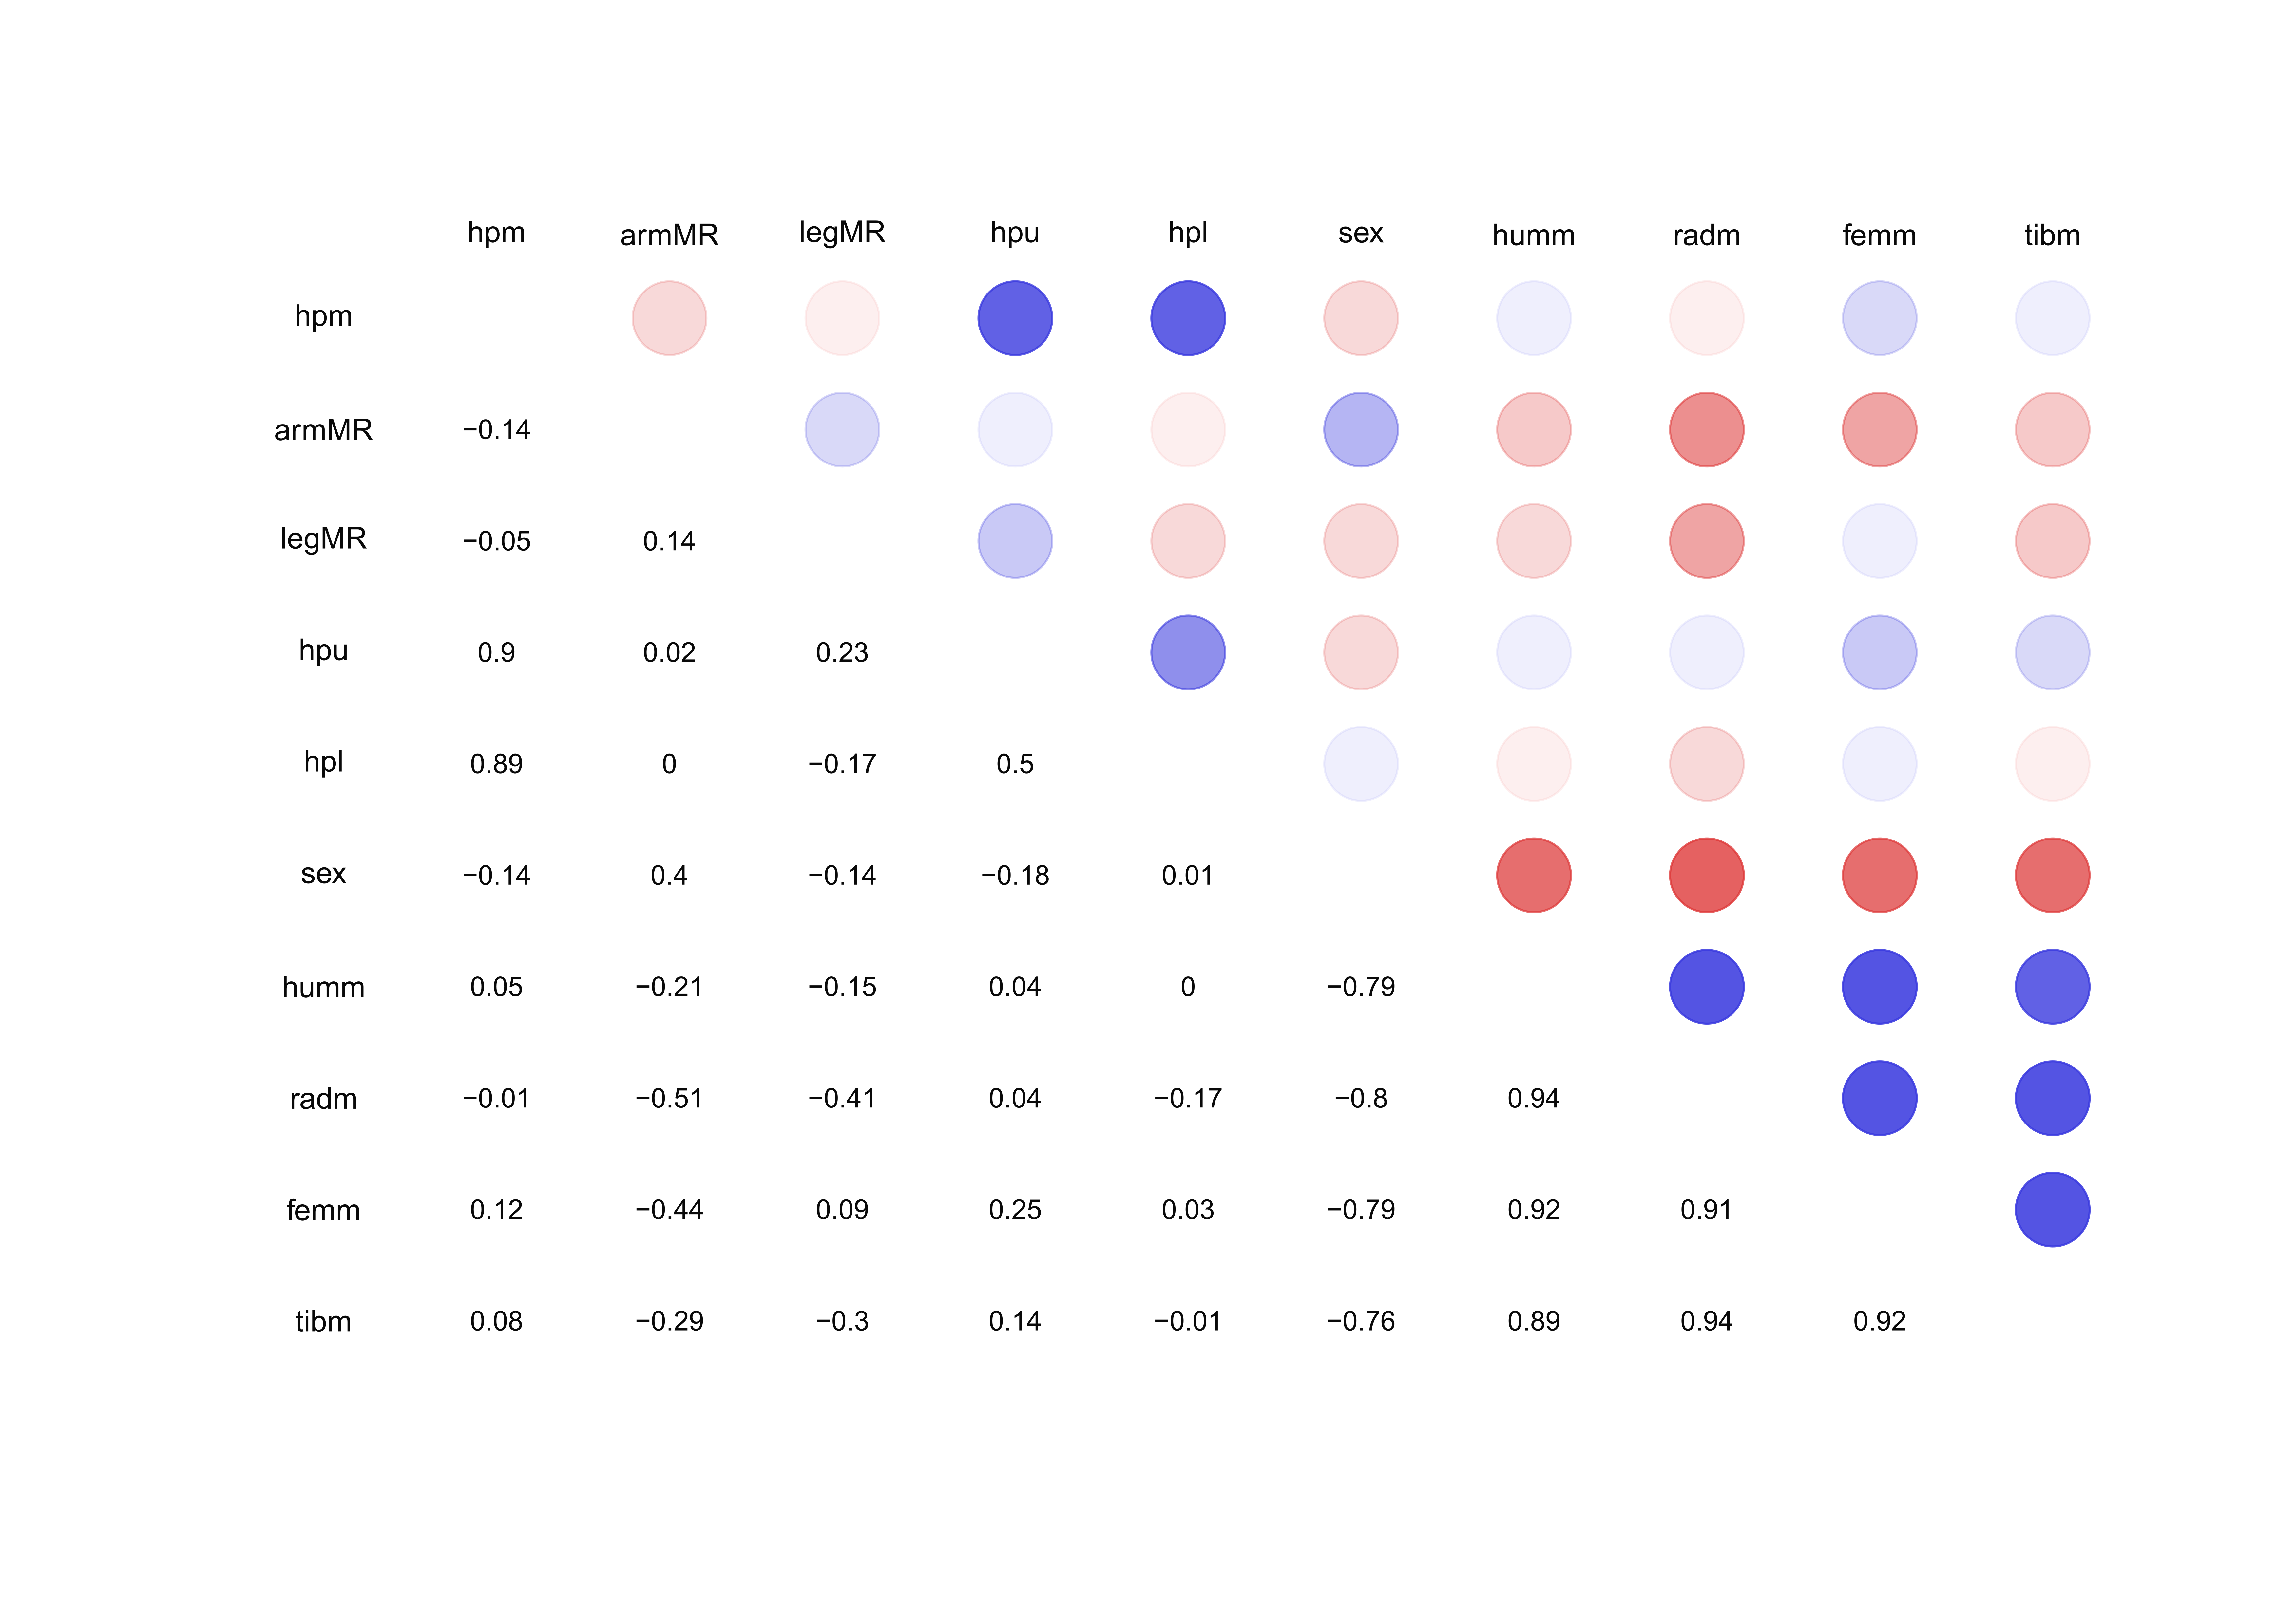
Figure 2 Spearman correlation matrix for pairwise correlations between the measurements of
the bones and scores of hypoplasia. Blue color circles indicate positive and red colors
indicate negative correlations. hpl = hypoplasia lower, hpm = hypoplasia mean, hpu =
hypoplasia upper, armMR = arm mean ratio, humm = humerus mean, radm = radius mean, sex =
sex, femm = femur mean, tibm = tibia mean, legMR = leg mean ratio.
Figure 2, described how well the variables correlate
to each other. The correlation values for the hpm and the hpu and hpl are 0.9 and 0.89,
respectively. The correlation between the hpm and the mean length of the long bones are all
under 0.15 which explains the pattern of SNHA in Figure 1. As expected, the correlation
matrix, Figure 2, shows a high correlation (0.89-0.94) between the mean lengths of the long
bones.
Out of the 48 individuals scored positive for LEH, 26 were females and 22 were males. In
addition, 11 females and 7 males scored negative for LEH. There were no significant (p = 0.782) sex difference between hypoplasia scores. The
Kaplan-Meier survival analysis showed no significant (p =
0.392) difference in mean age at death in adults scored positive or negative for LEH. There
is only a tendency showing lower mean age at death (= 34.99 years) in those scored positive
for LEH than in those scores negative (= 38.42 years).
Even though the original dataset contained 67 individuals, only 15 individuals were tested
by the Welch two-sample t-test due to missing values. To compute the arm-mean-ratio (armMR)
and leg-mean-ratio (legMR) variables, the anthropometric measurements of both sides of
humerus/radius and femur/tibia were needed. Further, to compute the arm/leg ratio variable,
values for both armMR and legMR had to be present.
To secure an unambiguous LEH score the “hypoplasia-mean” (hpm) score should be either “0”
or “1”.
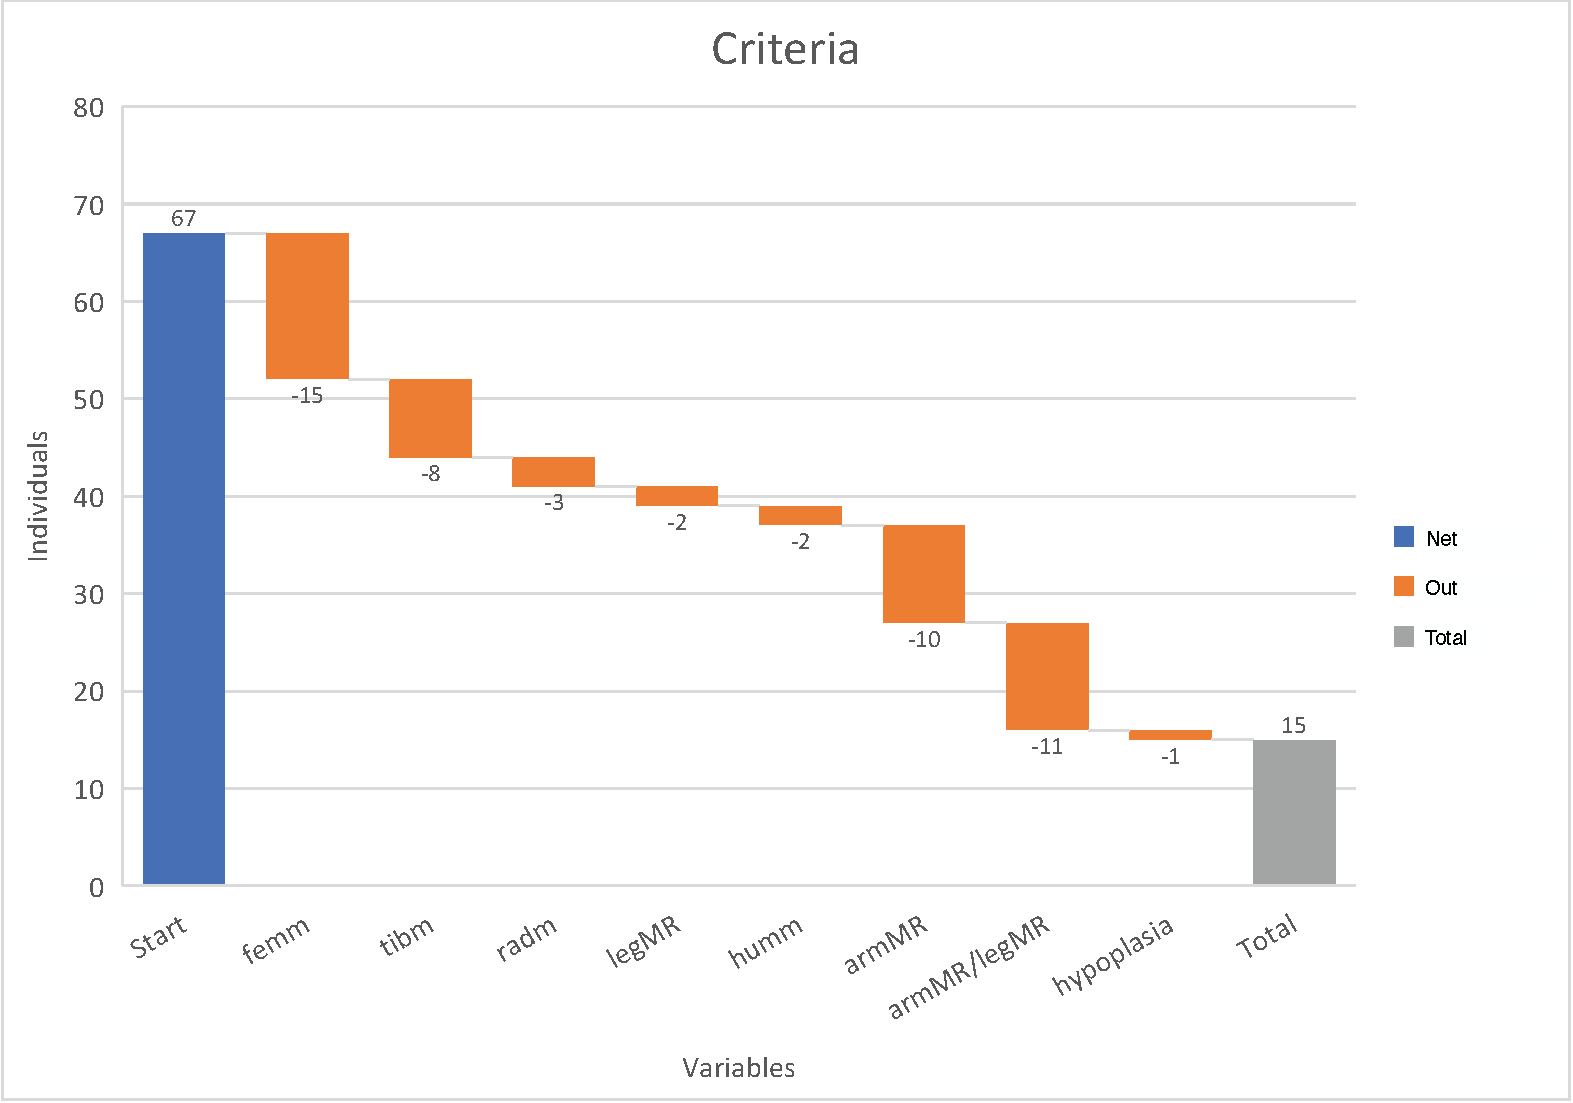
Figure 3 Waterfall chart showing the different variables made for the analysis and how many
individuals were discarded due to missing measurements. Start = number of individuals
registered, femm = mean value femur, tibm = mean value tibia, radm = mean value radius,
legMR = leg mean ratio (femm/tibm), humm = mean value humerus, armMR = arm mean ratio
(humm/radm), armMR/legMR = arm mean ratio/leg mean ratio, hypoplasia = unambiguous
hypoplasia score.
Due to missing values, the original sample of 67 individuals reduced to 15 individuals
(Figure 3). The Welch two sample t-test supported the result of the SNHA, there was no
statistically significant interaction between the hpm and the arm/leg ratio (p = 0.62) There was also no significant association between hpm and
the proximal and distal part of the extremities (humerus/radius ratio, p = 0.40; femur/tibia ratio p = 0.61).
The results of the univariate ANOVA, Table 2, showed no difference in length of humerus,
radius, or the ratios of the arm, leg, and arm/leg in males and females associated with
hypoplasia. But there was a significant difference between male and female lengths of femur
(σ = 0.015) and tibia (σ = 0.007) when associated with hypoplasia.
Table 2 Results of univariate analysis of variance showing the levels of significance of
the 7 variables. Hp = hypoplasia.
| Sig. |
Humerus |
Radius |
Femur |
Tibia |
Arm ratio |
Leg ratio |
Arm/leg ratio |
| Sex |
<0.001 |
<0.001 |
<0.001 |
<0.001 |
0.168 |
0.901 |
0.171 |
| Hp |
0.117 |
0.121 |
0.163 |
0.543 |
0.658 |
0.452 |
0.447 |
| Sex*Hp |
0.172 |
0.153 |
0.015 |
0.007 |
0.360 |
0.583 |
0.390 |
The profile plot of femur, Figure 4, illustrates that males and females reacted differently
to physiological stress in childhood. Males with hypoplasia had shorter femora than males
without hypoplasia, whereas females with hypoplasia had longer femora than females without
hypoplasia.
The differences of mean femur length between males and females were smaller in those with
hypoplasia than in the males and females without hypoplasia. The difference of mean length
of the femur was larger in males than in females.
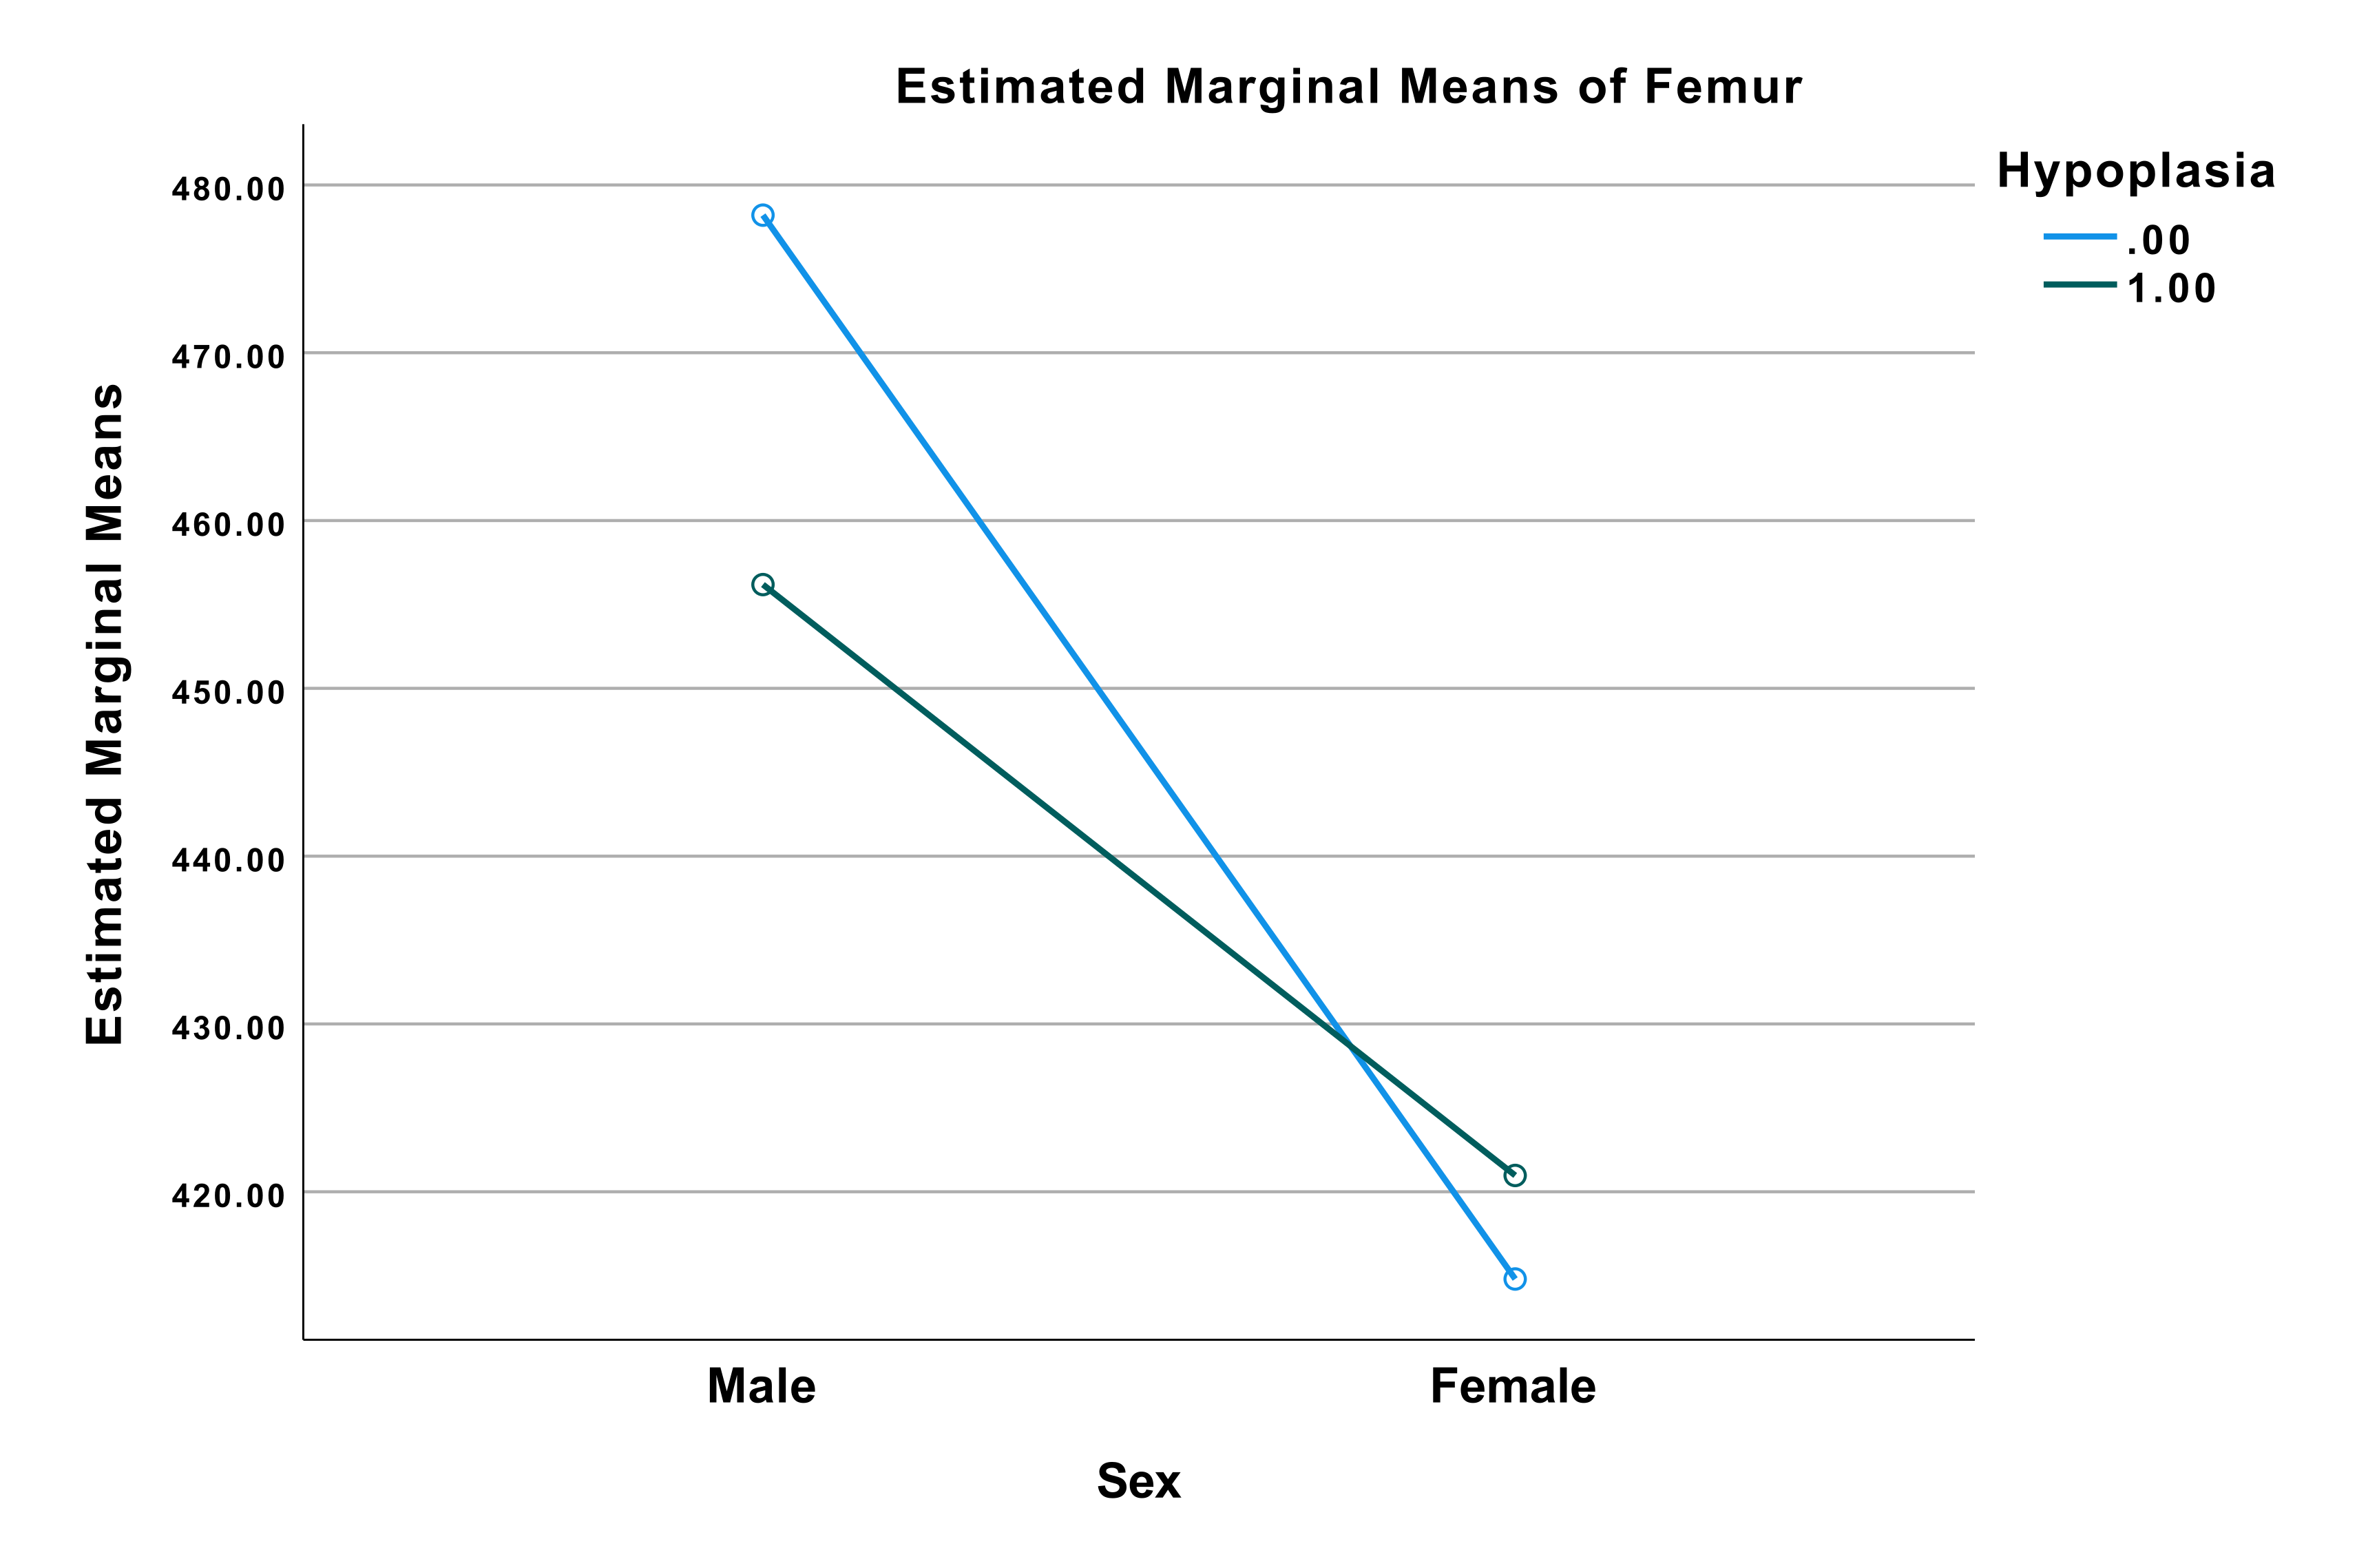
Figure 4 Profile plot from the univariate analysis of variance with dependent variable:
Femur. Blue line (0) indicating no hypoplasia. Green line (1) indicating positive for
hypoplasia. Values at (male, 0) = 478.20 mm, (male, 1) = 456.18 mm, (female, 0) = 414.80
mm, (female, 1) = 420.97 mm.
The profile plot of tibia, Figure 5, illustrates the same tendency as Figure 4. Males with
hypoplasia had shorter tibia than males without hypoplasia, whereas females with hypoplasia
had longer tibia than females without hypoplasia. The difference of mean tibia length
between male and female were smaller in those with hypoplasia than in the males and females
without hypoplasia. Furthermore, the difference of mean length of tibia was larger in males
than in females.
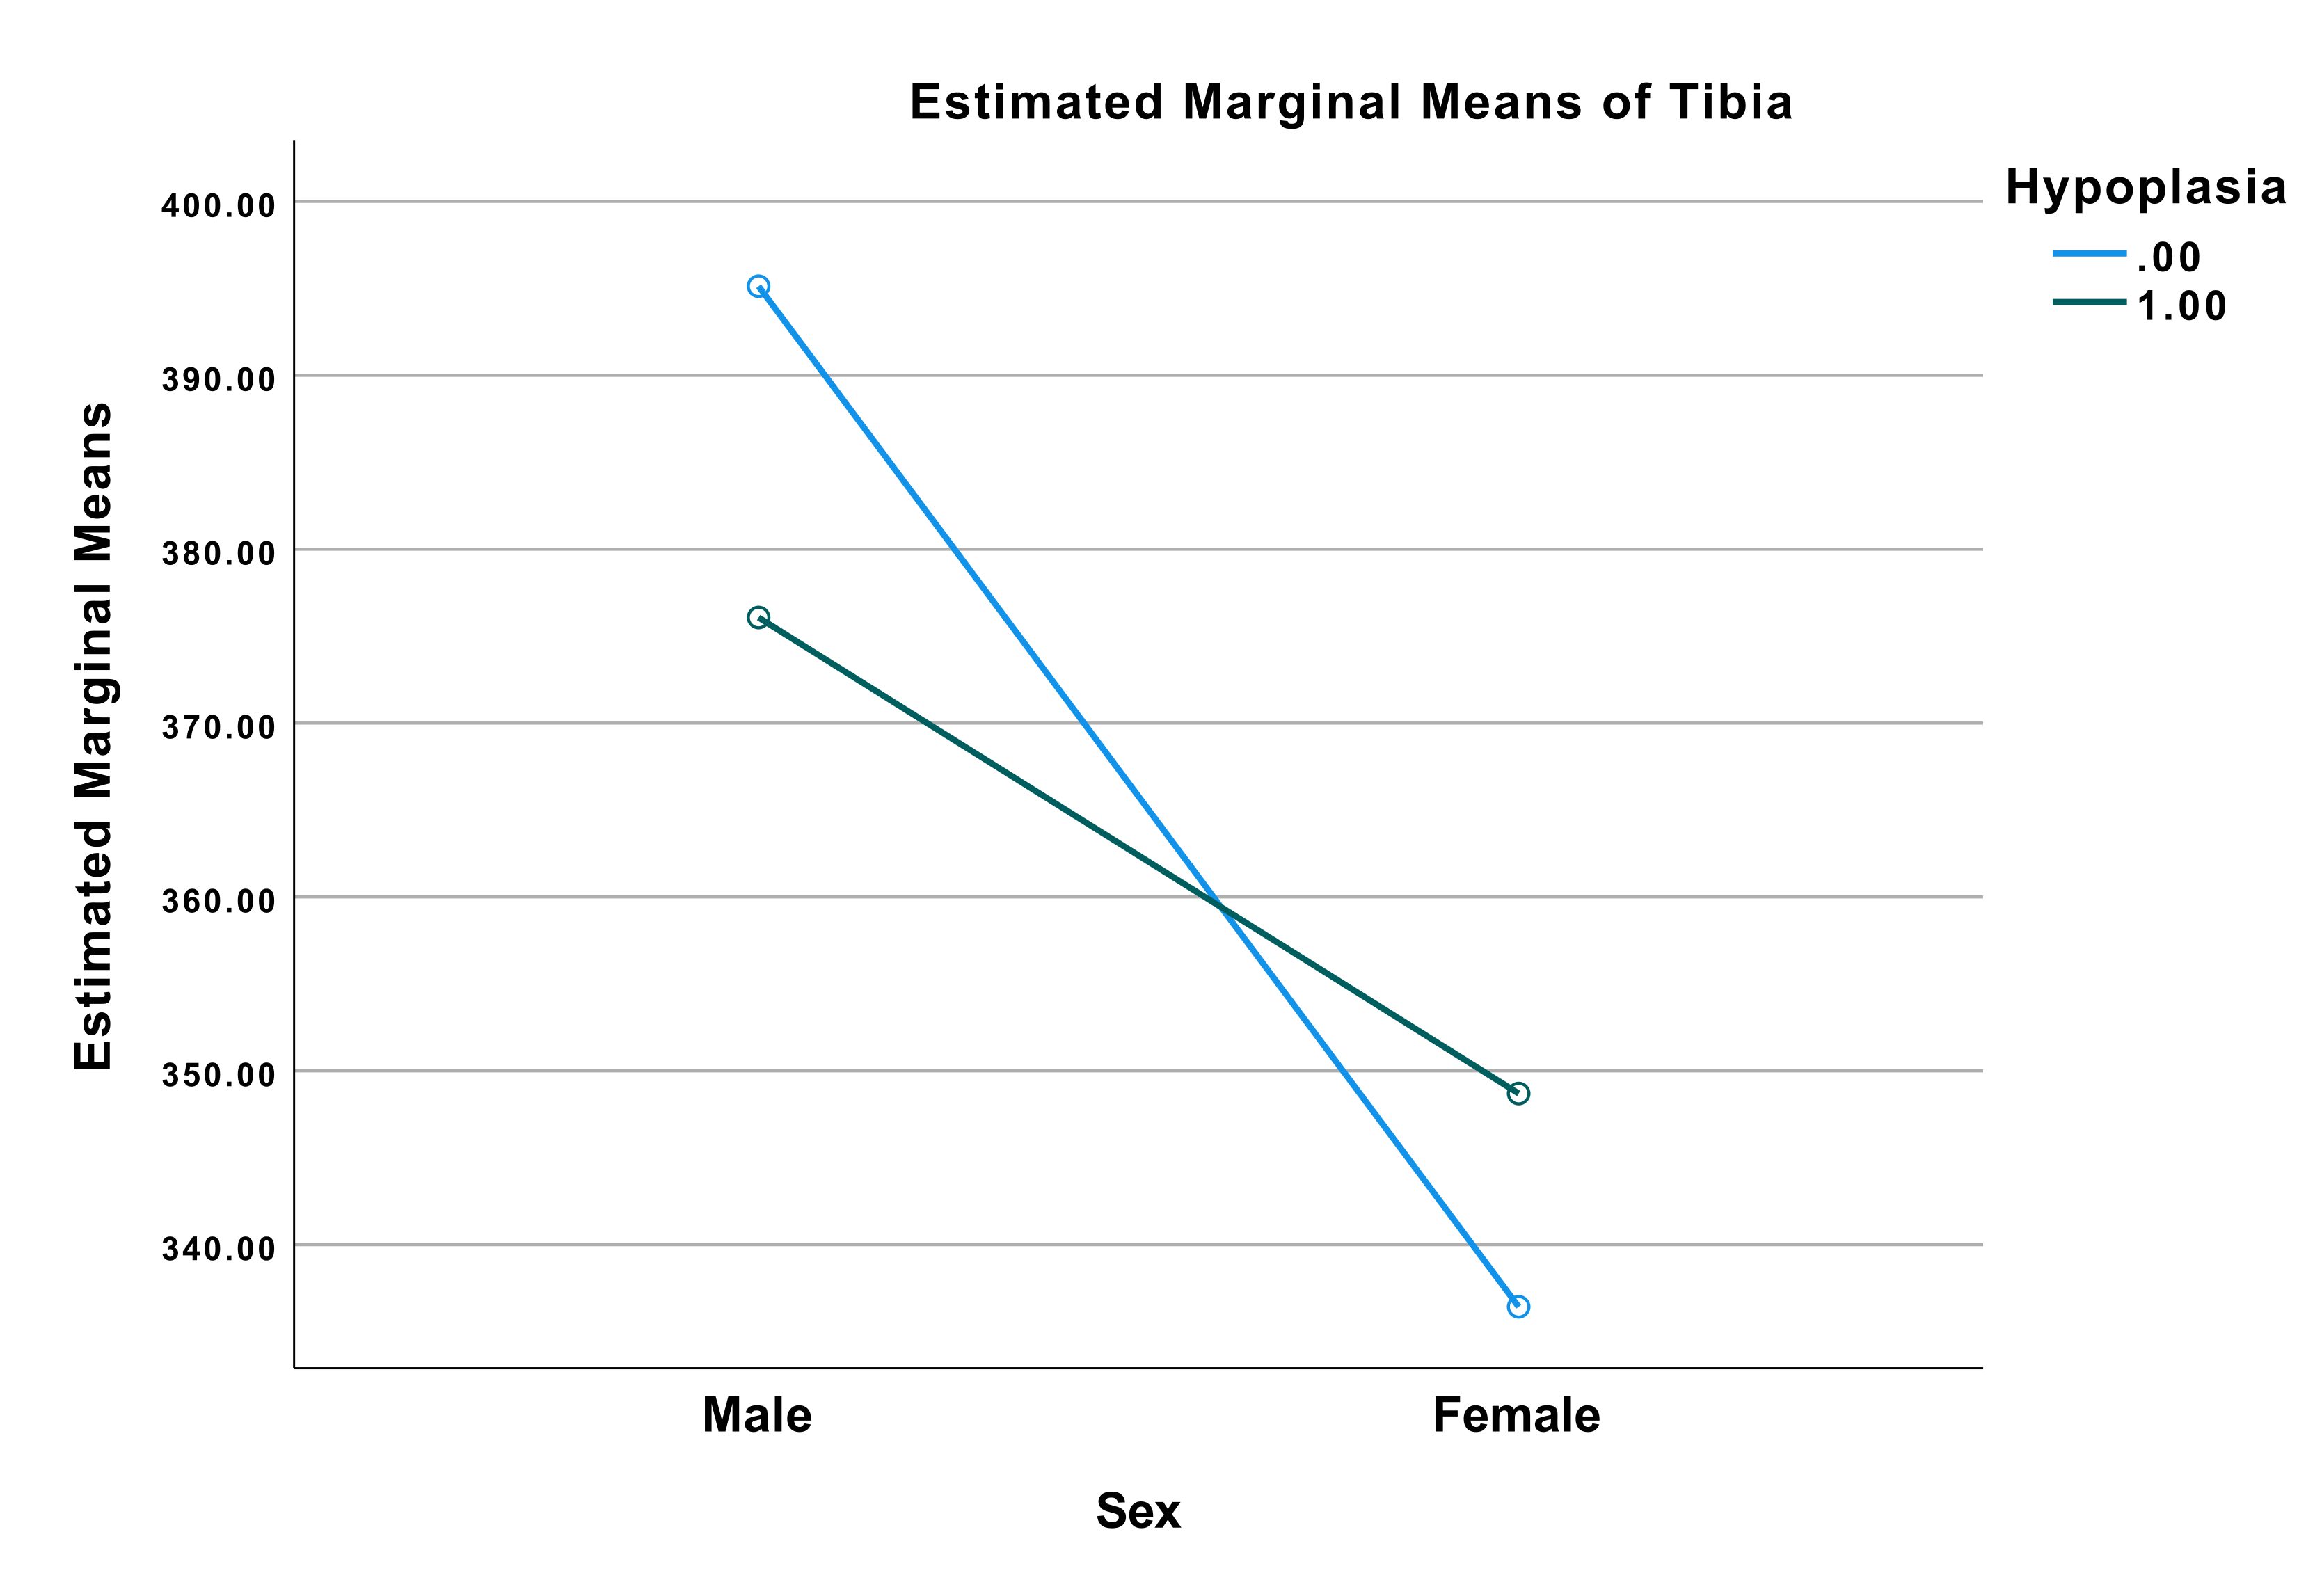
Figure 5 Profile plot from the univariate analysis of variance with dependent variable:
Tibia. Blue line (0) indicating no hypoplasia. Green line (1) indicating positive for
hypoplasia. Values at (Male, 0) = 395.13 mm, (male, 1) = 376.07 mm, (female, 0) = 336.43
mm, (female, 1) = 348.69 mm.
Discussion
There is little knowledge about the effect of catch-up growth on body proportion and on the
ratios of long bones. This study uses an archeological collection from ADBOU, Denmark, to
test the association of enamel hypoplasia scores as an indicator of early life growth
inhibition and long bone ratios. We used skeletal material of 15 individuals. Though small,
the study may be considered a pilot study, and may be seen as an introduction to this field
of research.
The analyses showed no significant differences in the ratios of either the length of the
proximal and the distal arm bones (humerus/radius, p = 0.40)
or the ratios of the proximal and the distal leg bones (femur/tibia, p = 0.61) in association with enamel hypoplasia scores. We studied adults.
Adults are survivors which means they had approx. 10 to 12 years of growth to catch-up and
compensate for any early childhood growth impairment.
Yet we failed to detect any association between linear enamel hypoplasia (LEH) in the four
canines and the bone ratio between arms and legs ((humerus/radius)/(femur/tibia)) after
having grown up.
However, the effect of early growth impairment on later growth differed between the sexes.
Males with hypoplasia had on average 22.02 mm shorter femora than males without hypoplasia,
whereas females with hypoplasia on average had 6.17 mm longer femora than females without
hypoplasia. The same pattern was seen for tibia indicating that males and females react
differently to physiological stress in childhood (McLaughlin et al. 2021).
The present study is not in line with Boldsen
(1998) who stated that early growth impairment
followed by catch-up growth results in changes in body proportion. Yet, as we studied
lengths and ratios of proximal and distal extremities instead of vertebrae, the present
findings may not be taken as proof against the statement of Boldsen. The present result may
indicate that early illness or malnutrition differs in its effects on dental and skeletal
growth (Boeker et al. 2022). In addition, survival
bias, possibly even sex dependent survival bias, could have affected the outcome of this
study. The children with LEH who did not survive to adulthood would probably have
experienced more severe illness and/or malnutrition, and stopped growth early (Bhutta et al. 2017). Further research is needed in
particular to study the association between the length of early growth arrests and the width
of the enamel hypoplasia
The difference in age at death between those with (= 34.99 years) and those without LEH (=
38.42 years) though statistically not significant, suggests higher mortality among people
who experienced physiological stress during childhood.
Conclusion
Contrary to earlier research on body proportions in Medieval Denmark this study shows no
significant difference in long bone ratios of the arms and legs associated with LEH. It did,
however, find an alteration of femur and tibia length associated with hypoplasia. The
findings indicate that males and females react differently to physiological stress in
childhood.
Acknowledgement
I would like to thank my supervisor Jesper Boldsen and the department of ADBOU for the
opportunity to collect data for this project and, furthermore, make it possible for me to go
the International Summer School “Human Growth – Data Analyses and Statistics” in
Potsdam/Gülpe from 19th to 24th of July 2021. Further, thanks to PD
Dr. Christiane Scheffler, Prof. Dr. Michael Hermanussen, Dr. Detlef Groth, and the
University of Potsdam for hosting the summer school, funded with KoUP.
References
Aßmann, C./Hermanussen, M. (2013a). Modeling determinants of growth:
evidence for a community-based target in height? Pediatric research 74 (1),
88–95.
Bhutta, Z. A./Berkley, J. A./Bandsma, R. H. J./Kerac, M./Trehan,
I./Briend, A. (2017). Severe childhood malnutrition. Nature Reviews. Disease Primers 3,
17067. https://doi.org/10.1038/nrdp.2017.67.
Boeker, S./Hermanussen, M./Scheffler, C.(2021). Dental age is an
independent marker of biological age. Human Biology and Public Health. Human Biology and
Public Health 3.https://doi.org/10.52905/hbph2021.3.24.
Bogin, B. (2021). Patterns of human growth. Cambridge, United Kingdom/New
York, NY/Port Melbourne, Australia/New Delhi, India/Singapore, Cambridge University
Press.
Boldsen, J. L. (1998). Body proportions in a medieval village population:
effects of early childhood episodes of ill health. Annals of Human Biology 25 (4),
309–317.
Boldsen, J. L. (2007). Early childhood stress and adult age mortality--a
study of dental enamel hypoplasia in the medieval Danish village of Tirup. American
journal of physical anthropology 132 (1), 59–66. https://doi.org/10.1002/ajpa.20467.
Groth, D./Scheffler, C./Hermanussen, M. (2019). Body height in stunted
Indonesian children depends directly on parental education and not via a nutrition
mediated pathway - Evidence from tracing association chains by St. Nicolas House
Analysis. Anthropologischer Anzeiger 76 (5), 445–451. https://doi.org/10.1127/anthranz/2019/1027.
Hermanussen, M. (Ed.) (2013). Auxology: studying human growth and
development: 89 tables. Stuttgart, Schweizerbart Science Publ.
Hermanussen, M./Aßmann, Ch./Groth, D. (2021). Chain Reversion for
Detecting Associations in Interacting Variables—St. Nicolas House Analysis.
International Journal of Environmental Research and Public Health 18 (4). https://doi.org/10.3390/ijerph18041741.
Hermanussen, M./Scheffler, Ch. (2016). Stature signals status: The
association of stature, status and perceived dominance - a thought experiment.
Anthropologischer Anzeiger 73 (4), 265–274. https://doi.org/10.1127/anthranz/2016/0698.
Jørkov, M. L. S. (2015). Stature in 19th and early 20th century
Copenhagen. A comparative study based on skeletal remains. Economics & Human Biology
19, 13–26. https://doi.org/10.1016/j.ehb.2015.07.002.
Knussmann, R. (1988). Anthropologie: Handbuch der vergleichenden Biologie
des Menschen. Fischer.
Lolland-Falster Museum (2020). Archive material 2020.
Lynnerup, N./Qvist, M./Homøe, P. (2000). Mellemørebetændelse. Hikuin 27
(27), 287. Available online at https://tidsskrift.dk/Hikuin/article/view/111692.
Marchewka, J./Skrzat, J./Wróbel, A. (2014). Analysis of the enamel
hypoplasia using micro-CT scanner versus classical method. Anthropologischer Anzeiger 71
(4), 391–402.
McLaughlin, C./Schutze, R./Henley, D./Pennell, C./Straker, L./Smith, A.
(2021). Prenatal and childhood stress exposure and the sex specific response to
psychosocial stress in adulthood. Psychoneuroendocrinology 125, 105109. https://doi.org/10.1016/j.psyneuen.2020.105109.
Milner, G. R./Boldsen, J. L. (2012). Transition analysis: a validation
study with known-age modern American skeletons. American journal of physical
anthropology 148 (1), 98–110. https://doi.org/10.1002/ajpa.22047.
Tanner, J. M. (1986). Growth as a Target-Seeking Function. In: F.
Falkner/J. M. Tanner (Eds.). Human Growth: A Comprehensive Treatise Volume 1
Developmental Biology Prenatal Growth. Boston, MA, Springer US,
167–179.
Tarp, P. (2017). Skeletal age estimation. PhD. Odense, University of
Southern Denmark.
White, T. D./Folkens, P. A. (2005). The human bone manual.
Elsevier.
Wit, C. C. de/Sas, Theo C. J./Wit, J. M./Cutfield, W. S. (2013). Patterns
of catch-up growth. The Journal of pediatrics 162 (2), 415–420. https://doi.org/10.1016/j.jpeds.2012.10.014.
Wit, J.-M./Boersma, B. (2002). Catch-up growth: definition, mechanisms,
and models. Journal of pediatric endocrinology & metabolism : JPEM 15 Suppl 5,
1229–1241. Available online at https://pubmed.ncbi.nlm.nih.gov/12510974/.