Social status influences human growth
A summary and analysis of historical data from German school girls in 1914 with
comparison to modern references
Liza Wilke ✉
✉
University of Potsdam, Human Biology, 14469 Potsdam, Germany
Sonja Boeker
University of Potsdam, Human Biology, 14469 Potsdam, Germany
Rebekka Mumm
University of Potsdam, Human Biology, 14469 Potsdam, Germany
Detlef Groth
University of Potsdam, Institute of Biochemistry and Biology, 14476
Potsdam-Golm, Germany
DOI: https://doi.org/10.52905/hbph2021.3.22
Abstract
Background
In the animal kingdom body size is often linked to dominance and subsequently the
standing in social hierarchy. Similarly, human growth has been associated and linked to
socioeconomic factors, including one’s social status. This has already been proposed in
the early 1900s where data on young German school girls from different social strata
have been compared.
Objectives
This paper aims to summarize and analyze these results and make them accessible for
non-German speakers. The full English translation of the historic work of Dikanski
(Dikanski, 1914) is available as a supplement. Further,
this work aims to compare the historical data with modern references, to test three
hypotheses: (1) higher social class is positively associated with body height and
weight, (2) affluent people from the used historical data match modern references in
weight and height and (3) weight distributions are skewed in both modern and historical
populations.
Methods
Comparison of historical data from 1914 with WHO and 1980s German data. The data sets,
for both body weight and height for 6.0- and 7.0-year-old girls, were fitted onto
centile curves and quantile correlation coefficients were calculated.
Results
In historical data social status is positively associated with body height and weight
while both are also normally distributed, which marks a significant difference to modern
references.
Conclusion
Social status is positively associated with height, signaling social dominance, making
children of affluent classes taller. Children from the historical data do not reach the
average height of modern children, even under the best environmental conditions. The
children of the upper social class were not skewed in weight distribution, although they
had the means to become as obese as modern children.
Keywords: social status, historical data, community effect, strategic growth adjustment
Conflict of Interest: There are no
conflicts of interest.
Citation: Wilke, L. et al. (2021). Social status influences human growth. Human Biology and Public Health 3. https://doi.org/10.52905/hbph2021.3.22.
Copyright: This is an open access article distributed under the terms of the Creative Commons Attribution License which permits unrestricted use, distribution, and reproduction in any medium, provided the original author and source are credited.
Received: 15-10-2021 | Accepted: 31-03-2022 | Published: 16-06-2022
Take home message for students
Comparing modern references with historical data suggests both community effect on height
and strategic growth adjustments. The average height of modern references is not met by
historical data, not even by the affluent classes, who lived under favorable
circumstances. Additionally, historical data show that weight distributions are not always
skewed.
Contents
Introduction
Social hierarchy in association with reproductive rights and breeding order has been
extensively studied in animal societies. Less well studied is the association of social
hierarchy, growth rate, and body size. Huchard and colleagues (Huchard et al., 2016) studied wild Kalahari meerkats (Suricata
suricatta), where both male and female subordinates increase their growth rate in response
to experimentally altered rivals of the same sex, showing that they adjust their growth to
match their closest competitor. Huchard’s study suggests that these responses also occur in
other social mammals, domestic animals and primates.
Since humans are social and consequently rely on social cues and symbols to navigate their
respective communities, it is not a leap to assume that dominance in humans is also linked
to body height and weight. This connection has been the subject of research for some time.
In 1963 James Tanner described growth as a “target seeking process” which is at least
partially influenced by the individual’s social environment (Niere et al., 2020; Tanner,
1963). Even though, this connection is still often dismissed or disregarded in
studies of human growth and development (Hermanussen
et al., 2019). However, not unlike the previously mentioned meerkats, humans may
also perceive body height and mass as a symbol of social dominance and subsequently of
social hierarchy. Lourenco shows how children already interpret physical size as a sign of
social dominance (Lourenco et al., 2015).
Additionally, taller statue has been linked to higher social status across different
cultures (Bogin et al., 2002; Czapla and Liczbińska, 2014; Hermanussen and Scheffler, 2016; Niere et al.,
2020; Stulp et al., 2015). The influence
of socioeconomic status and one's standing in social hierarchy, is already well researched;
there is an association between body height and social status (Koziel et al., 2019). The social environment of a person influences
their growth, and research indicates that taller stature is associated with higher
socioeconomic status and vice versa (Hermanussen and
Scheffler, 2016).
This connection, however, has only gained popularity in the field of human growth and
development research in the 21st century. For example, the results listed on
PubMed if one searches for 'social influence on height/ weight' only date back to 1976 and
pick up at around the year 2000. This is certainly connected to problems of digitalization,
lacking translations of non-English historical data from the field of auxology (defined as
the scientific study of growth and development) (Grupe,
2005). In accordance with the nature of a developing field, studies that reach
further back than 1970 are usually descriptive and atheoretical. For instance, samples were
presented and described and then often compared to similar data without investigating
hypotheses for possible explanations (Bogin, 2021a,
2021b). In the present article, we show that the connection between different
social strata and differing body height and weight was made as early as 1914 in a German
dissertation (Dikanski, 1914). Here, we compare
historical data with modern German and international growth references to test the
hypothesis: (1) higher social class is positively associated with body height and weight. In
addition, we test two further hypotheses, (2) affluent people of historical data, in this
particular case 6- and 7-year-old girls from upper-class families, match modern references
in weight and height and, consequently, (3) weight distributions are always (i.e. including
historical populations) skewed. Hypotheses 2 and 3 are tested to evaluate the applicability
of modern growth references, which are sometimes claimed to represent a universal ideal
pattern of human growth for historical and non-Western populations.
Background
The historical data used in this article were taken from the German-language dissertation
by Mordchaj Dikanski who wrote about “The influence of social status on the body
measurements of school children" to obtain his doctorate in 1914. The following is a summary
of his work and proceedings (Dikanski, 1914).
At the beginning of his work Dikanski noted that the extent of social deprivation and its
influence on physical development had been studied many times. Mostly children from
different social classes were measured and their mean values of body height and weight were
compared, both in Germany and abroad. He provided a table with data from England, Italy,
Germany, Russia, Denmark and Sweden. Dikanski argued that the results of the compared data
vary in their differences. There were large variations between studies, with the difference
between social classes being small or large, and decreasing or increasing with age. This
prompted him to conduct his own study with material about Munich elementary school
children.
Dikanski used a method of comparison which, according to him, was new at the time. He
sorted the entire material from three Munich elementary schools, whose students belonged to
different social classes, into three classes based on the parents' occupations: the rich and
affluent middle class (Class I), the working class (Class III), and the rest middle class
(II). Class I included occupations such as pharmacists, doctors, bank officials and railway
administrators; Class II included chauffeurs, printers, electricians, field weavers,
hairdressers and gardeners; Class III included assistants to various trades, hired hands,
clerks and factory workers. Dikanski noted two more distinguishing features of his study,
first, the body measurements are strictly net values (surveyed without shoes and clothes)
and second, they are reduced to certain age groups, namely to the age of exactly 6.0 or 7.0
years.
He processed his data according to the rules of the ‘collective measure theory’. Through
mean values, error sums and other parameters, Gaussian curves were calculated. Although
Dikanski did not provide detailed calculations, it was possible to recalculate the centiles
for weight and height using the data provided and compare them with modern WHO
references.
Sample and Method
In Dikanski’s data set, data from 1843 girls were used (Table 1). This material is divided
into distinct social and age groups, as shown in Table
1, which is taken and translated directly from Dikanski's work.
Table 1 The division of Dikanski's data, split into two age groups and three social
classes.
| Social Class |
Girls, age 6 |
Girls, age 7 |
Total number |
| I |
174 = 18,3% |
176 = 19,7% |
350 |
| II |
246 = 25,9% |
281 = 31,5% |
527 |
| III |
530 = 55,8% |
436 = 48,8% |
956 |
|
950 = 100% |
893 = 100% |
1843 |
Since Dikanski does not provide raw, individual data in his work, the centiles according to
body height and weight for all social classes were re-calculated. This was possible through
the data provided in his dissertation which included: Gaussian curves with values given in
per mille, mean values, error square sums and standard deviations. Afterwards, using the
software R, LMS-scores were calculated to make the data comparable.
Modern references were taken from data from Germany (Flügel et al., 1986) in the 1980s and data from WHO growth references. The WHO
growth reference and the data collection method is freely accessible online (de Onis et al., 2007; WHO, 2022a, 2022b). For this paper, only the data of the six- and
seven-year-old girls (72 and 84 months respectively) for both height and weight were used.
The original study for Germany from the 1980s included 41035 participants aged 0 to 70
years. Only the relevant and comparable groups of girls were used, i.e., a total of 2284
girls, including 1185 six-year-old and 1099 seven-year-old girls.
All three data sets, for both body weight and height, were fitted onto centile curves for
comparison. Additionally, quantile correlation coefficients (Choi and Shin, 2021) were calculated to further emphasize differences
and similarities.
Results
German girls in the 1980s are both the tallest and heaviest, following the WHO reference.
According to the historical data, the affluent class (I) is the tallest and heaviest.
Dikanski's middleclass girls (II) are both shorter and less heavy than the affluent class,
but taller and heavier than the working class (Figure
1 and 2). On average, the affluent class of
Dikanski with 5.23 cm and 1.7 kg for the 6-year-old and 7.7 cm and 3 kg for the 7-year-old
shorter and lighter compared to 1980s German girls. In comparison to the WHO reference, the
affluent class with 3 cm and 0.7 kg for the 6-year-old and 5 cm and 1.8 kg for the
7-year-old shorter and less heavy.
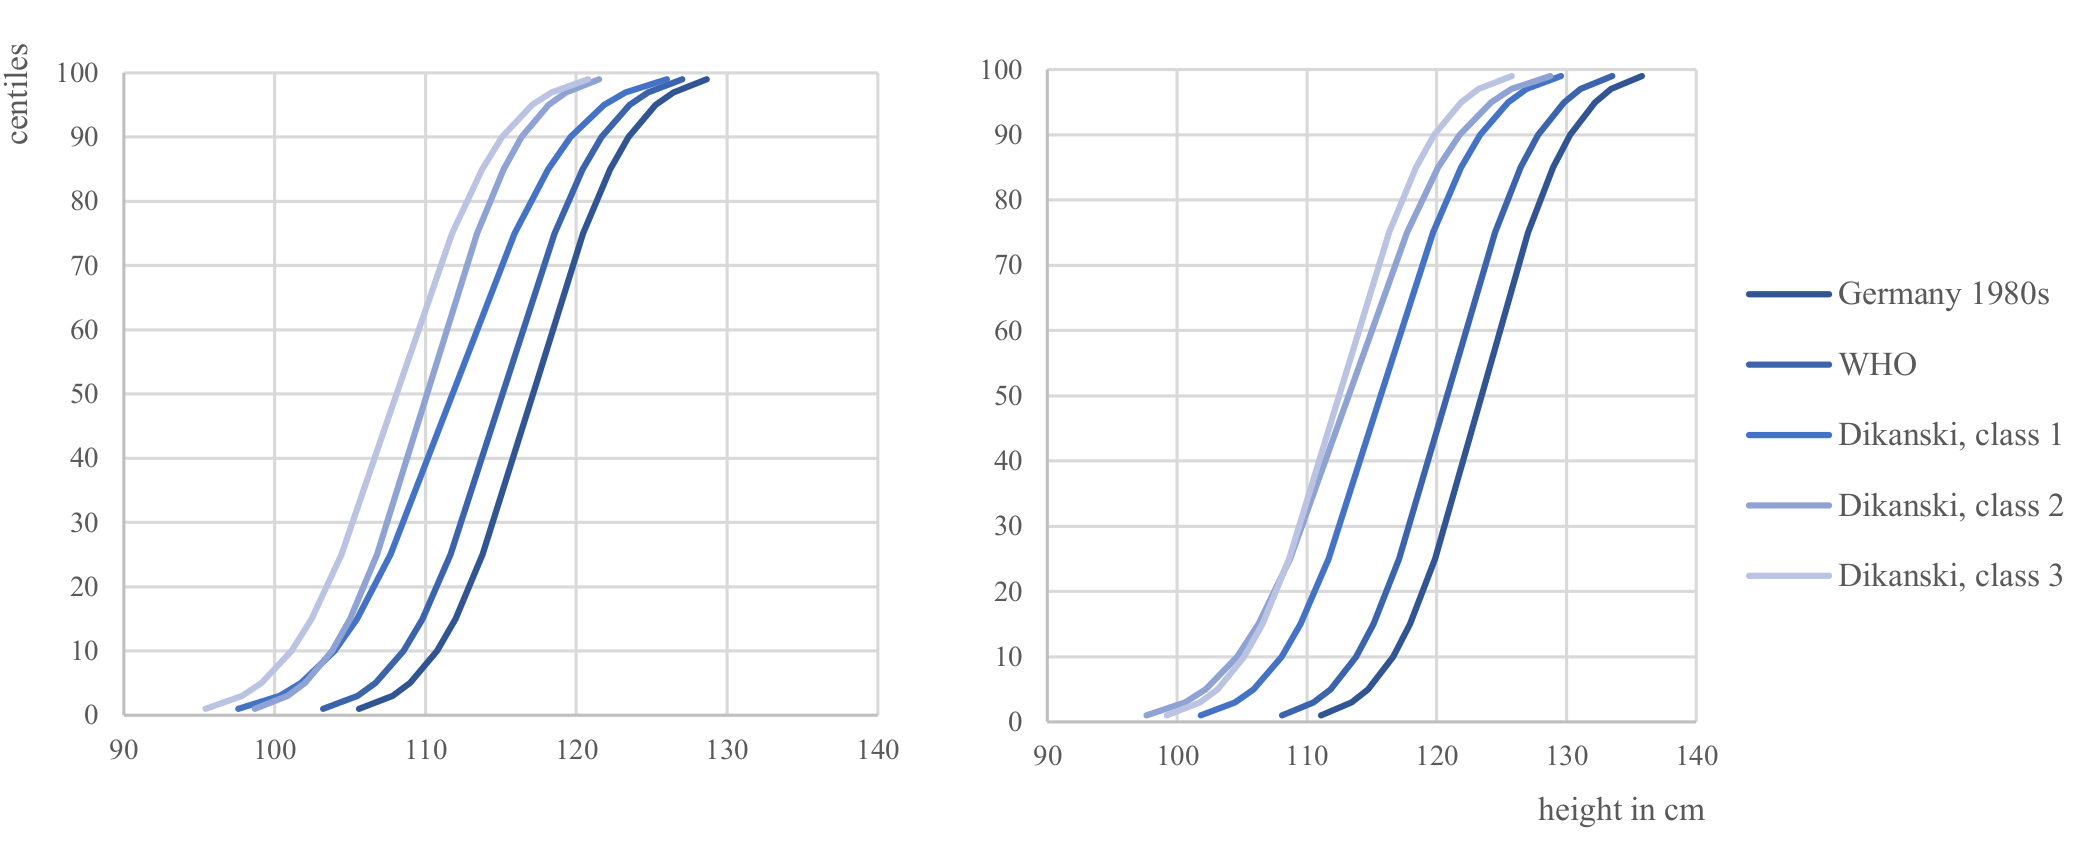
Figure 1 Height comparison between 6- and 7-year-old girls from historical data (Dikanski
1914), WHO reference (2007) and 1980s Germany (Flügel et al. 1986).
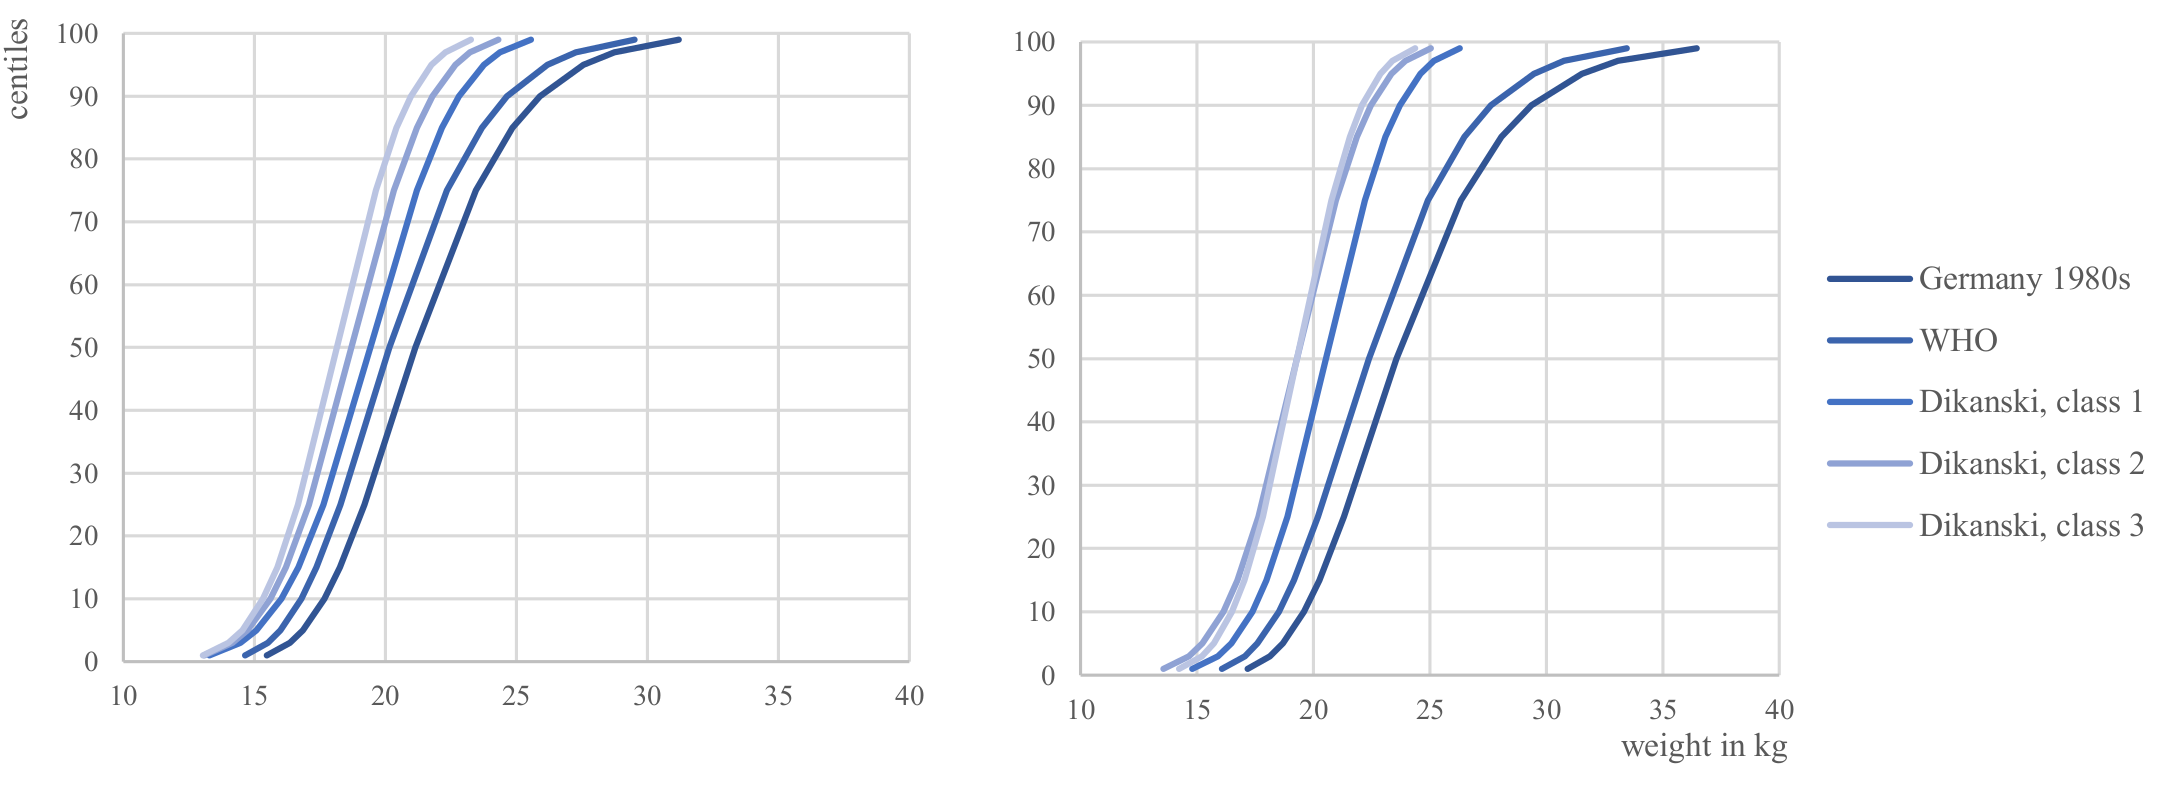
Figure 2 Weight comparison between 6- and 7-year-old girls from historical data (Dikanski
1914), WHO reference (2007) and 1980s Germany (Flügel et al. 1986).
Weight in all three of Dikanski's social classes is normally distributed, while modern
weight is non-normally distributed (Figure 2). The
WHO and the German curves are comparatively more skewed, flatter and deviate to the right,
especially with regard to higher weights. Dikanski's curves are merely shifted to the left
on the X-axis. It shows that, in contrast to modern references, the weight distribution of
all three of Dikanski's classes is not skewed.
These results are emphasized and illustrated by the quantile correlation coefficients
(Table 2). Since height is always normally
distributed, only the quantile correlation coefficients for weight are included in the
table. The lowest correlation is between the data from the 1980s and Dikanski's data since
the difference in weight and curve shape is greatest between these two (highlighted in red).
The figures for the WHO reference and the 1980s are almost identical since these two are
very similar in shape and distribution (highlighted in green). The low figures of the
coefficients also underline the difference between the normally distributed weight in the
historical data and the non-normally distributed weight in the modern references. Since
Dikanski's classes are normally distributed for weight, the correlation between them is
always 1, which, for the sake of clarity, is not included in Table 2.
Table 2 Quantile correlation coefficients.
|
WHO, age 6 |
WHO, age 7 |
80s Germany, age 6 |
80s Germany, age 7 |
| WHO, age 6 |
1 |
0,999 |
0,998 |
0,981 |
| WHO, age 7 |
0,999 |
1 |
0,999 |
0,988 |
| Dikanski’s classes |
0,762 |
0,736 |
0,729 |
0,633 |
| 80s Germany, age 6 |
|
|
1 |
0,991 |
| 80s Germany, age 7 |
|
|
0,991 |
1 |
Discussion
Hypothesis (1), namely that higher social class is positively associated with body height
and weight, can be accepted. This is in line with other results and research (Bogin et al., 2002; Czapla and Liczbińska, 2014; Hermanussen and
Scheffler, 2016; Stulp et al., 2015) and,
again, confirms and emphasizes the influence of social factors on human growth and
development. It also underlines the fact that this is not a recent phenomenon but has been
present for at least a hundred years (Hermanussen,
2016). Hypothesis (2), that affluent people of historical data, in this particular
case 6- and 7-year-old girls, match modern references in weight and height, must be
rejected. The affluent class which included children from doctors and bank officials is
below the body height and weight of the WHO reference or schoolgirls of 1980s Germany. This
shows that even children who grew up under advantageous social circumstances do not reach
the average height of the chosen contemporary references. Hypothesis (3), that weight
distributions are always (i.e. including historical populations) skewed distributions, must
also be rejected. The assumption that the weight distribution needs to be skewed because
individuals may gain fat with almost no upper limit, but cannot lose weight below the
minimum necessary to live is not true for the historical data.
There are merely about 70 years between Dikanski's data and the data from the 1980s in
Germany, so a genetic component can almost be completely ruled out; such a drastic change
over this short period seems very unlikely. The diet, especially considering the richer
population, has changed between 1914 and 1980s Germany, but it seems unlikely that the
discrepancy could be explained through nutrition alone (Hermanussen and Scheffler, 2016), especially since nutrition and growth in height
are not necessarily linked to each other (Hermanussen
et al., 2019). According to the German Federal Ministry of Food and Agriculture
(Bundesministerium für Ernährung und Landwirtschaft,
2018), in the early 1900s meat consumption doubled in cities, where the standard of
living was higher. Among workers, sugar consumption was on the rise, since it was cheap and
could be stored indefinitely. Thanks to the improved infrastructure, larger quantities of
food could be brought to the cities, including fresh fish, vegetables, and grain, which were
eaten in various flour dishes, like pasta and different kinds of mash. In larger cities, the
first delicatessens appeared, selling coffee, rice, and cocoa. In the 1980s, more emphasis
was put on quick, ready-to-eat food, and the traditional eating habits moved towards frozen
food. However, environmental awareness grew between 1979 and 1989, the number of health food
and organic food shops rose from 100 to over 1,000. In the socially higher classes dishes
such as lobster, caviar or truffles were served. By and large, consumer interest in whole
foods and organic foods increased. As the variety and quantity of an individual’s diet is a
major determinant of growth, it is also related to other influences, like one's
socioeconomic status (Bogin, 2021a). This means that
while diet or individual food preferences may have changed between 1914 and the 1980s in
Germany, the nutrients needed for growth were sufficient at both times and it is unlikely
that the discrepancy in height and weight should be explained by diet alone (Hermanussen and Scheffler, 2016). This is also
supported by a study (Hermanussen et al., 2018),
that investigated 19th and 20th century journals from various German pediatricians, which
revealed that historical literature does not see a strong relationship between nutrition,
child growth, and adult height.
Consequently, this means that the social component must play a crucial role here.
Independent of nutrition, taller stature is usually associated with higher socioeconomic
status, and it has been shown that there is a bilateral link between height and social
position (Bogin et al., 2017). Children of the
affluent class are taller than children of 'lower' social classes, which pertains to the
phenomenon of strategic growth adjustment (Hermanussen
et al., 2019; Hermanussen and Scheffler,
2016). Strategic growth adjustments were observed in nonhuman species (Bogin, 2021a; Huchard
et al., 2016), but can also be observed in historical height data (Hermanussen et al., 2018) where social transitions,
like World War I and II, lead to an increase in growth of the lower social strata, seemingly
followed by an adjustment of the upper strata whose individuals even grew taller in response
(Hermanussen et al., 2019). Over the past 130
years, such secular trends, which refer to increases in mean height relative to modern
populations, have been observed in European populations (Hermanussen, 2013; Hochberg, 2011). The
fact that even under the best environmental conditions, the schoolgirls of the historical
affluent class do not reach the average height of modern children may be an expression of
the community effect on height, which denotes the effect of social interaction between
individuals of the same group (Bogin, 2021a; Hermanussen et al., 2021). People of the same community
are similar in height, which means that people who are surrounded by tall people are also
tall, while individuals surrounded by short people are short. Both mentioned phenomena are
linked through size signaling status: tallness is associated with dominance and greater
social power, making the affluent class the tallest, while the ‘lower’ classes are short,
signaling subordination (Bogin, 2021a; Hermanussen and Scheffler, 2016). The children of the
parents from the affluent class were aware of their status, knowing that they belong to the
elite and were most likely treated as such by the lower social strata which in turn might
have contributed to maintaining their height differences. The fact that the schoolgirls of
the historical affluent class, even under good environmental conditions, do not reach the
average height of modern children may be an expression of the aforementioned community
effect.
A further point of interest is the normal distribution of weight in all three classes of
the historical data, which stands in contrast to the modern references. In many current
studies increasing weight and obesity are called a "pandemic phenomenon" (Kostovski et al., 2017). The current ideas of weight
distribution that we consider 'normal' are already an expression of the existing ‘obesity
pandemic’. Our modern references are not 'normal'. Children of the historical affluent
social class who had all the reasons and means to become as obese as modern children did not
have skewed weight distributions. While some research explains the "obesity pandemic" purely
with dietary changes (Baker and Friel, 2014; Delpeuch and Maire, 1997; Popkin, 2001), this does not fully answer the question why in the
historical data all three social classes, and especially the affluent class, were normally
distributed in weight.
Limitations and further study
Unfortunately, due to the nature of historical data, the sample size was relatively small
and it only compared girls of two distinct age groups. While the results show a clear
positive association between body height and weight with social status, it would be
interesting to see if there is a difference when comparing final body height, for example.
Additionally, finding and comparing other historical data from the same period would also
be of interest in this context.
The normal distribution of weight is interesting and brings up a number of questions as
well as starting points for future research.
Conclusion
The results of the present study show that the German historical data from 1914 correspond
to current research and thus support the idea that socioeconomic status, and in this case
especially the position in social hierarchy, has a biologically important effect on human
growth. It also shows that about a hundred years ago, weight was, at least for the data set
used, normally distributed, which is no longer the case in modern references.
Acknowledgements
The statistical analyses of the provided data were performed during the International
Summer School on “Human Growth and Development” in Gülpe, Brandenburg, from the
18th to the 24th of July in 2021. With special thanks to Dr Rebekka
Mumm and both PD Dr Christane Scheffler and Prof Dr Michael Hermanussen, without whom this
work would have not been possible.
References
Baker, P./Friel, S. (2014). Processed foods and the nutrition transition:
evidence from Asia. Obesity reviews : an official journal of the International
Association for the Study of Obesity 15, 564–577. https://doi.org/10.1111/obr.12174.
Bogin, B. (2021a). Social-Economic-Political-Emotional (SEPE) factors
regulate human growth. Human Biology and Public Health 1. https://doi.org/10.52905/hbph.v1.10.
Bogin, B. (2021b). Patterns of Human Growth, 3rd ed. Cambridge University
Press, Cambridge.
Bogin, B./Scheffler, C./Hermanussen, M. (2017). Global effects of income
and income inequality on adult height and sexual dimorphism in height. American journal
of human biology : the official journal of the Human Biology Council 29. https://doi.org/10.1002/ajhb.22980.
Bogin, B./Smith, P./Orden, A.B./Varela Silva, M.I./Loucky, J. (2002).
Rapid change in height and body proportions of Maya American children. American journal
of human biology : the official journal of the Human Biology Council 14, 753–761.
https://doi.org/10.1002/ajhb.10092.
Bundesministerium für Ernährung und Landwirtschaft (2018).
Zeitreise durch die Ernährung: Essen im Wandel [WWW Document]. URL https://de.readkong.com/page/zeitreise-durch-die-ernahrung-essen-im-wandel-1581180.
Choi, J.-E./Shin, D.W. (2021). Quantile correlation coefficient: a new
tail dependence measure. Stat Papers. https://doi.org/10.1007/s00362-021-01268-7.
Czapla, Z./Liczbińska, G. (2014). Height as an indicator of economic
status in the Polish territories under Russian rule at the turn of the 19th to 20th
century. Journal of biosocial science 46, 686–697. https://doi.org/10.1017/S0021932013000503.
de Onis, M./Onyango, A.W./Borghi, E./Siyam, A./Nishida, C./Siekmann, J.
(2007). Development of a WHO growth reference for school-aged children and adolescents.
Bulletin of the World Health Organization 85, 660–667. https://doi.org/10.2471/blt.07.043497.
Delpeuch, F./Maire, B. (1997). Obésité et développement des pays du sud.
Medecine tropicale : revue du Corps de sante colonial 57, 380–388.
Dikanski, M. (1914). Über den Einfluss der sozialen Lage
auf die Körpermaße von Schulkindern. München, Universitäts-Kinderklinik,
München.
Flügel, B./Greil, H./Sommer, K. (1986). Anthropologischer
Atlas. Tribüne, Berlin.
Grupe, G. (2005). Anthropologie: Ein einführendes
Lehrbuch, Springer-Lehrbuch. Springer, Berlin.
Hermanussen, M. (2016). Stunted growth. Eur J Clin Nutr 70, 647–649.
https://doi.org/10.1038/ejcn.2016.47.
Hermanussen, M. (2013). Auxology - Studying Human Growth and Development.,
1st ed. Schweizerbart, Stuttgart.
Hermanussen, M./Bogin, B./Scheffler, C. (2019). The impact of social
identity and social dominance on the regulation of human growth: A viewpoint. Acta
Paediatr 108, 2132–2134. https://doi.org/10.1111/apa.14970.
Hermanussen, M./Bogin, B./Scheffler, C. (2018). Stunting, starvation and
refeeding: a review of forgotten 19th and early 20th century literature. Acta Paediatr
107, 1166–1176. https://doi.org/10.1111/apa.14311.
Hermanussen, M./Scheffler, C. (2016). Stature signals status: The
association of stature, status and perceived dominance - a thought experiment. Anthropol
Anz 73, 265–274. https://doi.org/10.1127/anthranz/2016/0698.
Hermanussen, M./Scheffler, C./Martin, L./Groth, D./Waxmonsky,
J.G./Swanson, J./Nowak-Szczepanska, N./Gomula, A./Apanasewicz, A./Konarski, J.M./Malina,
R.M./Bartkowiak, S./Lebedeva, L./Suchomlinov, A./Konstantinov, V./Blum, W./Limony,
Y./Chakraborty, R./Kirchengast, S./Tutkuviene, J./Jakimaviciene, E.M./Cepuliene,
R./Franken, D./Navazo, B./Moelyo, A.G./Satake, T./Koziel, S. (2021). Growth, Nutrition
and Economy: Proceedings of the 27th Aschauer Soiree, held at Krobielowice, Poland,
November 16th 2019. Human Biology and Public Health 1. https://doi.org/10.52905/hbph.v1.1.
Hochberg, Z. (2011). Developmental plasticity in child growth and
maturation. Frontiers in endocrinology 2, 41. https://doi.org/10.3389/fendo.2011.00041.
Huchard, E./English, S./Bell, M.B.V./Thavarajah, N./Clutton-Brock, T.
(2016). Competitive growth in a cooperative mammal. Nature 533, 532–534. https://doi.org/10.1038/nature17986.
Kostovski, M./Tasic, V./Laban, N./Polenakovic, M./Danilovski, D./Gucev, Z.
(2017). Obesity in Childhood and Adolescence, Genetic Factors. Prilozi (Makedonska
akademija na naukite i umetnostite. Oddelenie za medicinski nauki) 38, 121–133.
https://doi.org/10.2478/prilozi-2018-0013.
Koziel, S./Zaręba, M./Bielicki, T./Scheffler, C./Hermanussen, M. (2019).
Social mobility of the father influences child growth: A three-generation study. Am J
Hum Biol 31, e23270. https://doi.org/10.1002/ajhb.23270.
Lourenco, S.F./Bonny, J.W./Schwartz, B.L. (2015). Children
and Adults Use Physical Size and Numerical Alliances in Third-Party Judgments of
Dominance. Frontiers in psychology 6, 2050. https://doi.org/10.3389/fpsyg.2015.02050.
Niere, O./Spannemann, L./Stenzel, P./Bogin,
B./Hermanussen, M./Scheffler, C. (2020). Plasticity of human growth - a systematic
review on psychosocial factors influencing growth. Anthropol Anz. https://doi.org/10.1127/anthranz/2020/1223.
Popkin, B.M. (2001). Nutrition in transition: the changing global
nutrition challenge. Asia Pacific journal of clinical nutrition 10 Suppl,
S13-8.
Stulp, G./Buunk, A.P./Verhulst, S./Pollet, T.V. (2015). Human height is
positively related to interpersonal dominance in dyadic interactions. PloS one 10,
e0117860. https://doi.org/10.1371/journal.pone.0117860.
Tanner, J.M. (1963). Regulation of growth in size in mammals. Nature 199,
845–850. https://doi.org/10.1038/199845a0.
WHO (2022a). Growth reference data for 5- to 10-year-olds: weight for age
[WWW Document]. URL https://www.who.int/tools/growth-reference-data-for-5to19-years/indicators/weight-for-age-5to10-years.
WHO (2022b). Growth reference data for 5- to 19-year-olds: height for age
[WWW Document]. URL https://www.who.int/tools/growth-reference-data-for-5to19-years/indicators/height-for-age.