The arithmetic dilemma when defining thinness, overweight and obesity in
stunted populations
Michael Hermanussen ✉
✉
Aschauhof 3, 24340 Eckernförde – Altenhof, Germany
University of Potsdam, Bioinformatics, 14476 Potsdam-Golm, Germany
Christiane Scheffler
University of Potsdam, Human Biology, 14469 Potsdam, Germany
Detlef Groth
University of Potsdam, Bioinformatics, 14476 Potsdam-Golm, Germany
DOI: https://doi.org/10.52905/hbph2022.1.21
Abstract
BackgroundCritical cut-off values of BMI-for-age z-scores (BAZ) are used to define “thinness”,
“overweight” and “obesity”, but the validity of these cut-off values needs to be
questioned in populations that are shorter or taller than the reference. We hypothesized
that the prevalence of thinness, overweight, and obesity depends on population height
and performed a random simulation.
MethodsWe created virtual child populations aged 2-10 years with normally distributed height
expressed as height-for-age z-scores (HAZ) and weight expressed as weight-for-age
z-score (WAZ), based on WHO growth standards and references, with a correlation r=0.7
between height and weight. We adjusted weight-for-height and calculated BAZ.
ResultsBAZ depends on height and age. In short children (mean HAZ=-2 to HAZ=-3), the
prevalence of thinness falls to less than 1% in the youngest and rises up to 10% (mean
HAZ=-2) and up to 13% (mean HAZ=-3) at age 10 years. The prevalence of obesity rises to
up to 7% in the shortest and youngest and falls close to zero at age 10. Short young
children and tall older children are more prone to be misclassified as overweight.
ConclusionsThe prevalence of thinness, overweight and obesity depends on height and age. The
coexistence of being short and being overweight – currently referred to as “double
burden of malnutrition” – needs consideration as to what extent this condition is a
health issue or reflects calculation artefacts. The arithmetic dilemma particularly
affects young children in short populations. We suggest abstaining from defining
“thinness”, “overweight”, or “obesity” by BMI z-scores. Different states of under- and
malnutrition should rather be classified by direct or indirect measures of body fat.
Keywords: BMI, stunting, prevalence, thinness, obesity, misclassification, double burden of malnutrition
Conflict of Interest: There are no
conflicts of interest.
Citation: Hermanussen, M. et al. (2022). The arithmetic dilemma when defining thinness, overweight and obesity in
stunted populations. Human Biology and Public Health 1. https://doi.org/10.52905/hbph2022.1.21.
Copyright: This is an open access article distributed under the terms of the Creative Commons Attribution License which permits unrestricted use, distribution, and reproduction in any medium, provided the original author and source are credited.
Received: 11-10-2021 | Accepted: 02-11-2021 | Published: 24-08-2022
Take home message for students
For arithmetic reasons, the prevalence of thinness, overweight and obesity when defined
by z-scores for BMI strongly depends on average population height and age.
Contents
Introduction
Short people tend to be lighter than tall people. The coefficient of correlation within
same age cohorts of children slightly depends on age but for practical reasons may be
considered close to r=0.7 (Mumm and Hermanussen
2021). This applies to both absolute height (cm) and weight (kg) as well as to
height-for-age z-values (HAZ) and weight-for-age z-values (WAZ). Due to this association,
many children in Low and Middle Income Countries (LMIC) are not only short (yielding an
apparently high prevalence of stunting), but also tend to be low in weight (yielding an
apparently high prevalence of underweight) when referred to WHO height and weight for age
standards (WHO 2006) and references (WHO growth reference 2007; WHO Multicentre Growth Reference Study Group 2006). Stunting is
conventionally attributed to poor nutrition, repeated infection, and inadequate psychosocial
stimulation. The prevalence of stunting is often used in public health and medicine, by
governmental and health organizations, and also by the United Nations agencies, as the
common yardstick to assess and monitor child health and development (Zorlu 2011). Meanwhile, over 140 countries employ WHO growth standards
and references.
Being short and light does not automatically imply a low body mass index (BMI, weight
divided by the square of height). The BMI is commonly used as an indicator to define the
nutritional status (CDC 2015). Yet, many stunted
populations around the world are normal in BMI despite increasing prevalence of overweight
and obesity in recent years (NCD Risk Factor Collaboration
2017). The BMI is a ratio and depends on both height and weight. This is trivial
but it needs to be considered as changing either one of the two parameters affects this
ratio. Critical cut-off values of BMI z-scores are used to define “thinness” (BMI-for-age
z-values (BAZ) below -2SD) (Cole and Lobstein 2012),
“overweight” (BAZ above +1 SD) and “obesity” (BAZ above +2 SD) also in children (de Onis and Lobstein 2010). As BMI depends on both
height and weight, it is essential to clarify whether BMI cut-off values also apply for
populations that are on average shorter or taller than the reference they are compared. For
arithmetic reasons, being short or tall may affect the density distribution of the BMI and,
thus, may lead to misclassification of the nutritional status.
We hypothesize that the prevalence of thinness, overweight, and obesity is not independent
of the average height of the population.
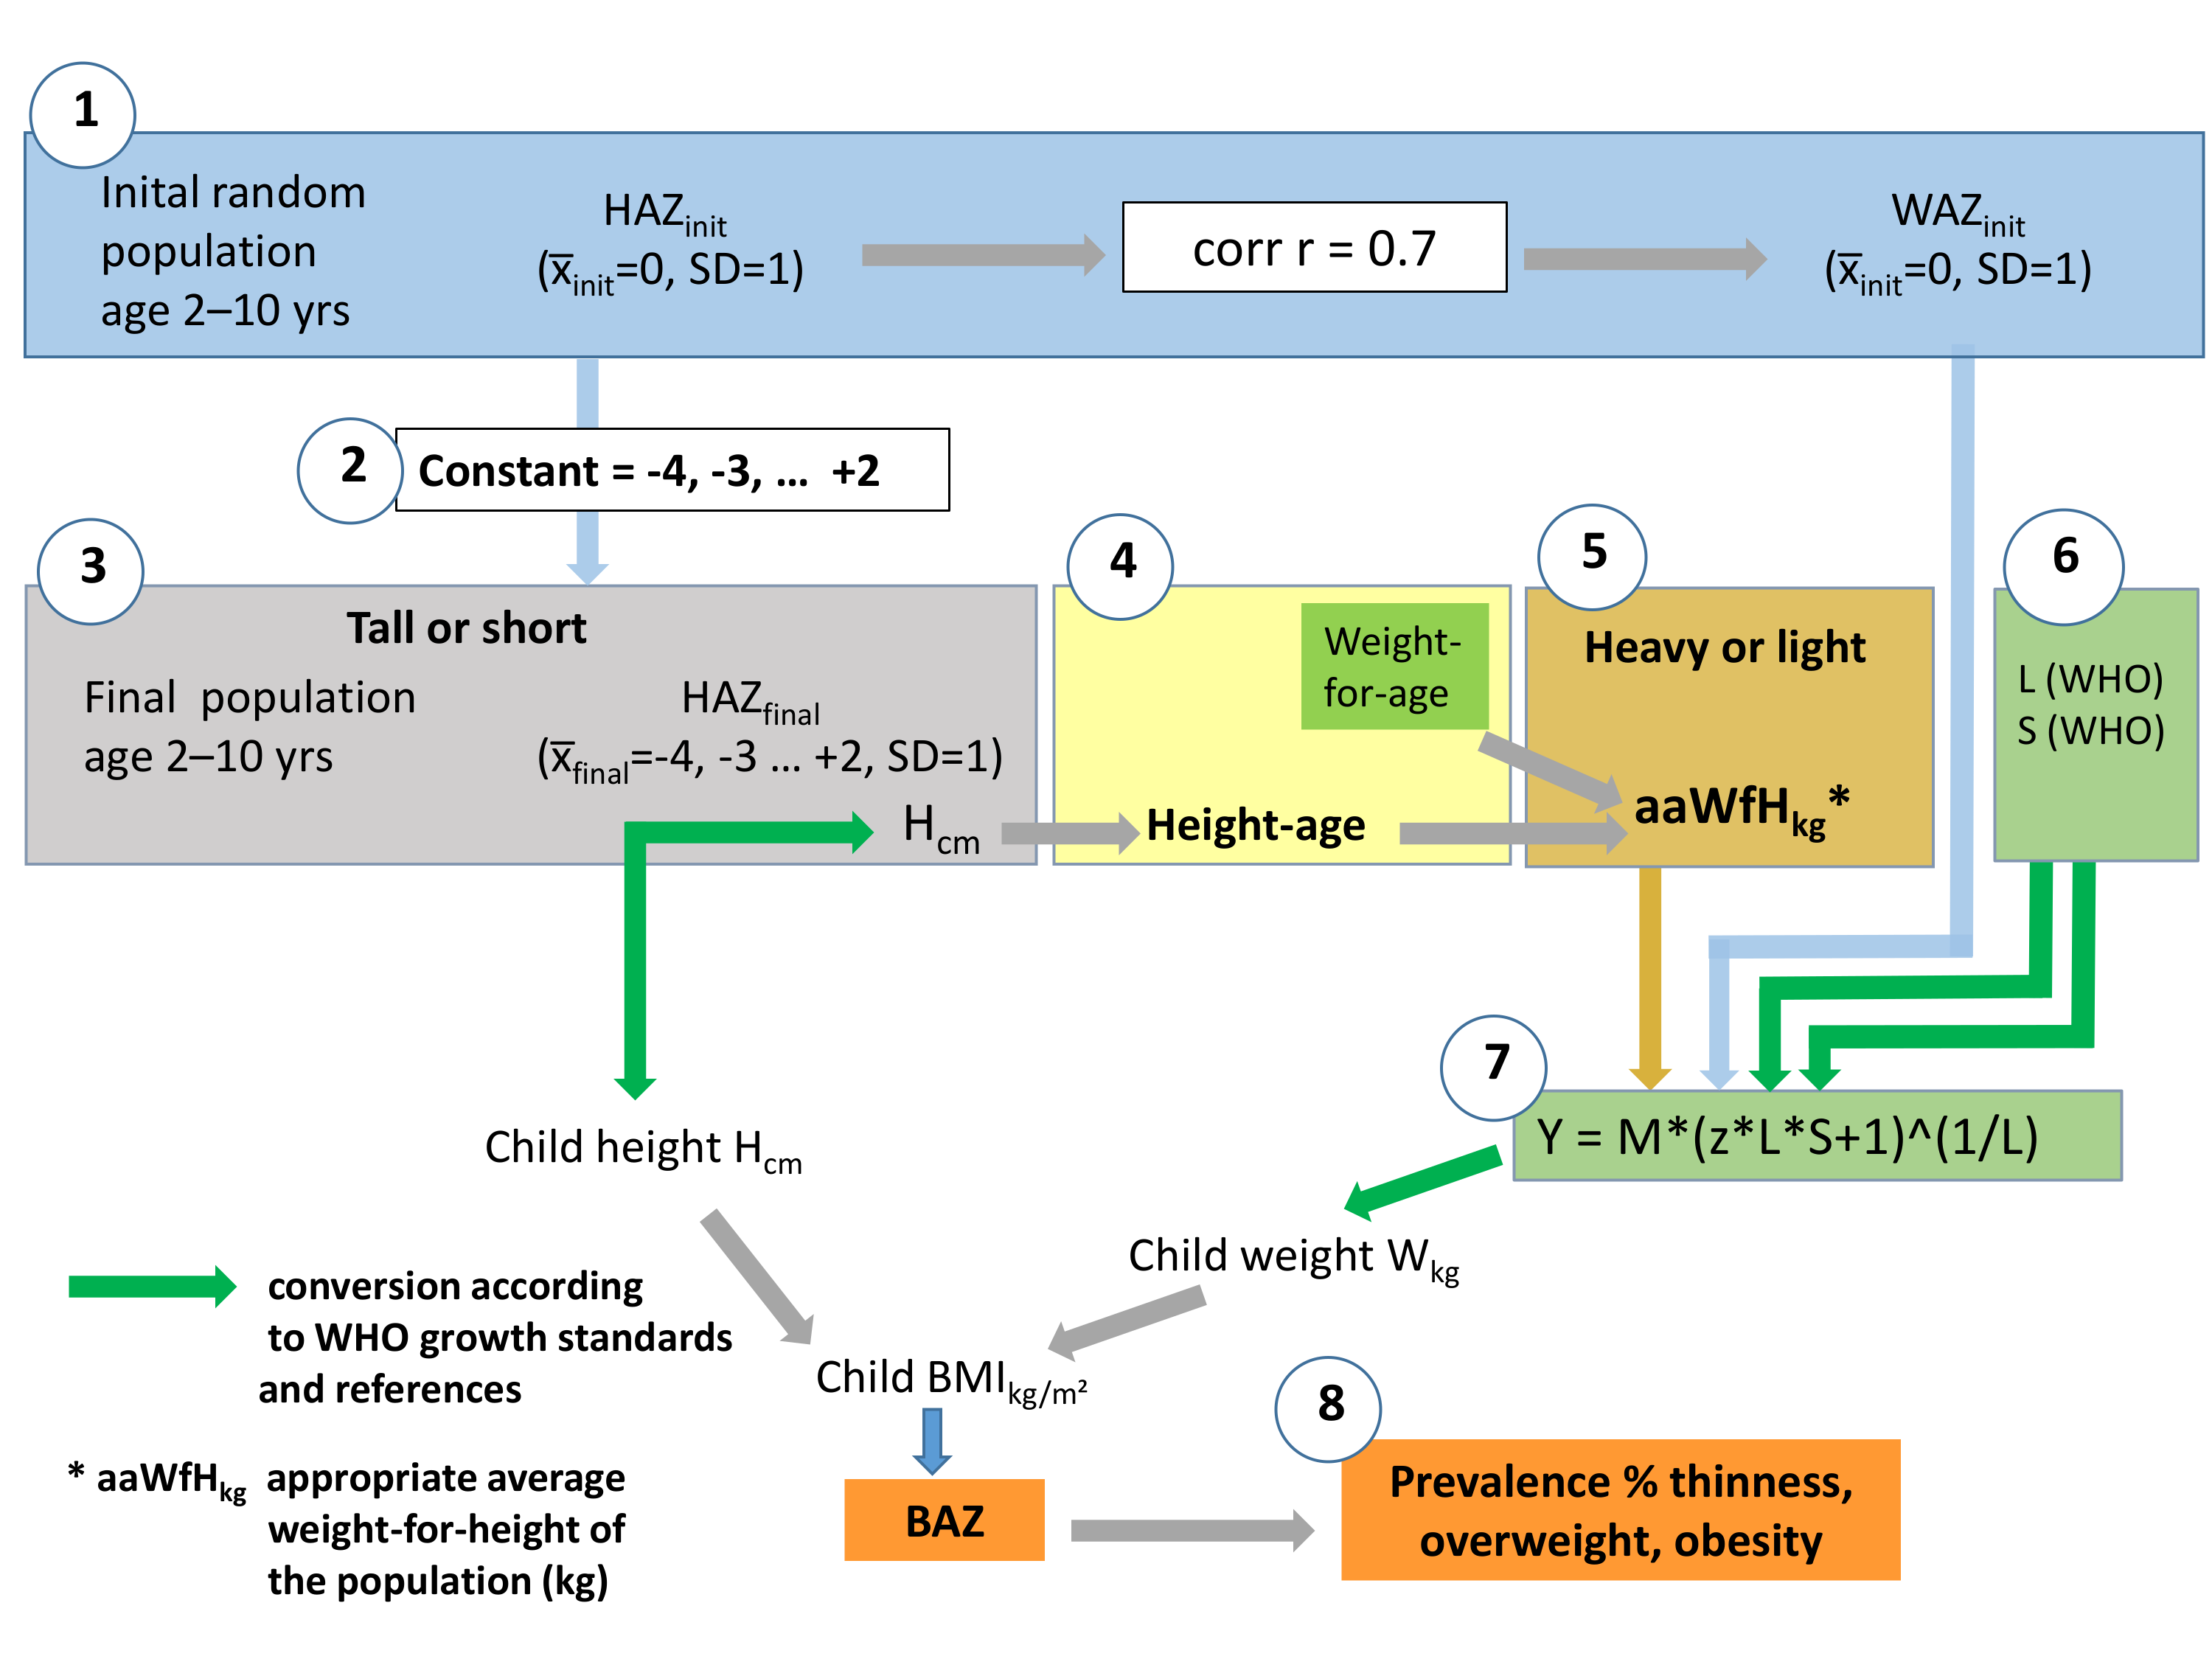
Figure 1 Flowchart of simulation. See description in the text.
Methods
Body height tends to follow a standard normal (Gaussian) distribution in a homogeneous,
well-nourished population. This proposition, advanced by Quetelet in 1835 and established
more systematically by Galton and Pearson half a century later (Tanner 1981), is largely accepted. We follow this notion and created an
initial virtual population of girls and boys aged 2 – 10 years with standard normally
distributed height expressed as height-for-age z-scores (HAZinit) based on WHO growth
standards and references. HAZinit has a standard normal distribution with x̅init=0, and
SD=1. Each child was then assigned a weight-for-age z-score (WAZinit) that was related to
HAZinit with r=0.7 (Mumm and Hermanussen 2021).
WAZinit had a standard normal distribution with x̅init=0 and SD=1, too.
In a second step, the initial population was transferred into the final populations by
adding an integer constant (-4, -3, … +1, +2) to the HAZinit of each child. We considered
this range relevant as it includes the average height of the shortest (Walker et al. 2006) and the tallest human populations (Fredriks et al. 2000). The final populations differed in
mean height, but their density distributions still equaled the initial HAZinit distribution.
One may do so as density distributions of height are quite independent of mean height, with
very similar standard deviations in short and tall populations (Eveleth and Tanner 1990). Shifting the density distribution of height
along the x-axis, thus, neither affects height variation nor the correlation between final
HAZ (HAZfinal) and WAZinit.
Short people tend to be lighter than tall people. Creating populations of different height,
thus, requires weight adjustment. Yet, as weight density distributions are skewed, linearly
shifting z-score distributions of weight will lead to “shrinkage” or to “expansion” of the
z-distributions, depending on whether shifting to the left or to the right.
Weight-for-height tables can solve the problem, but weight-for-height tables are not
available for all ages. Thus, we introduced an auxiliary step and made use of the concept of
height-age. Height-age is that age that corresponds to the child's height when plotted at
the 50th percentile. E.g. if a group of girls is on average 126.6 cm tall, the group is
considered to have a “height-age” of 8 years irrespective of their calendar age. For
8-year-old girls, WHO weight-for-age references give a median weight of 25.0 kg suggesting
that 25.0 kg is the “appropriate average weight-for-height” of a group of 126.6 cm tall
girls.
The simulation (Figure 1) includes:
| 1. | The blue box
indicates the initial virtual population of boys and girls
(cohort size N=10,000), aged 2, 3, 4, … 9, 10 years. Each child was assigned an initial
height-for-age z-score (HAZinit), with x̅init=0 and
SD=1, and a weight-for-age z-score (WAZinit), with
x̅init=0 and SD=1, that correlated with HAZinit with
r=0.7.
At this step, neither height (Hcm) nor weight (Wkg) of these
children has been determined. |
| 2. | A population specific constant (-4, -3, -2 … +1, +2)
was added to HAZinit of
each child, yielding the final populations of children. The final populations were on
average shorter or taller than the initial population, with
x̅final=-4, -3, …. +1, +2. The variance remained the
same with SD=1. |
| 3. | The grey box
indicates the conversion of the individual HAZfinal into height
in cm (Hcm), based on WHO growth standards and references (green arrow). This step
yields mean height (cm) of the final populations. |
| 4. | The yellow box
indicates the concept of height-age. Mean population height is
used to assign the assumed appropriate age for height. |
| 5. | The brown box
indicates the final assignment of an “appropriate average
weight-for-height” in kg via the appropriate height-age. |
| 6. | Orange boxes
indicate variables obtained from WHO growth standards and
references (WHO 2006; WHO growth reference 2007). L, S, and the population specific
“appropriate average weight-for-height” are used to calculate weight in kg (Wkg) for
each child by: |
| 7. | LMS method
as described by Cole’s LMS formula (Cole 1990):
Y = M*(z*L*S+1)^(1/L)
Y individual weight (Wkg)
M appropriate average population
weight-for-height in kg
z WAZinit
L Box-Cox power to remove skewness
(obtained from WHO weight-for-age tables)
S coefficient of variation (obtained
from WHO weight-for-age tables)
This approach guarantees that in the
final populations, individual height and weight still corresponded with the correlation
r=0.7, regardless of average population height. |
| 8. | Brown boxes:
Individual BMI (kg/m²) was calculated from individual height
(Hcm) and weight (Wkg), and converted into BMI-for-age z-scores (BAZ) according to WHO
growth standards and references (WHO 2006;
WHO growth reference 2007). The critical
cut-off values of “thinness” (BAZ below -2 SD), “overweight” (BAZ above +1 SD) and
“obesity” (BAZ above +2 SD) in the final short and tall populations defined the
prevalence of thinness, overweight and obesity. |
Simulation, analysis and graphics were handled with the programming language R (Goodreau et al. 2008; Handcock et al. 2008). R is Free Software under the terms of the Free Software
Foundation’s GNU General Public License in source code from the R Foundation (The R Foundation 2022). For the 3D plots the R package
plot3D was used (Soetaert 2021).
For details see supplementary material.
Results
The density distributions of mean height-for-age z-scores (HAZ), mean weight-for-age
z-scores (WAZ), and mean BMI-for-age z-scores (BAZ) overlap in populations with mean HAZ=0
(Figure 2). The density distributions disintegrate
when HAZ0. Density distributions of WAZ and, to a lesser extent, of
BAZ shift to the left with decreasing HAZ and to the right with increasing HAZ.
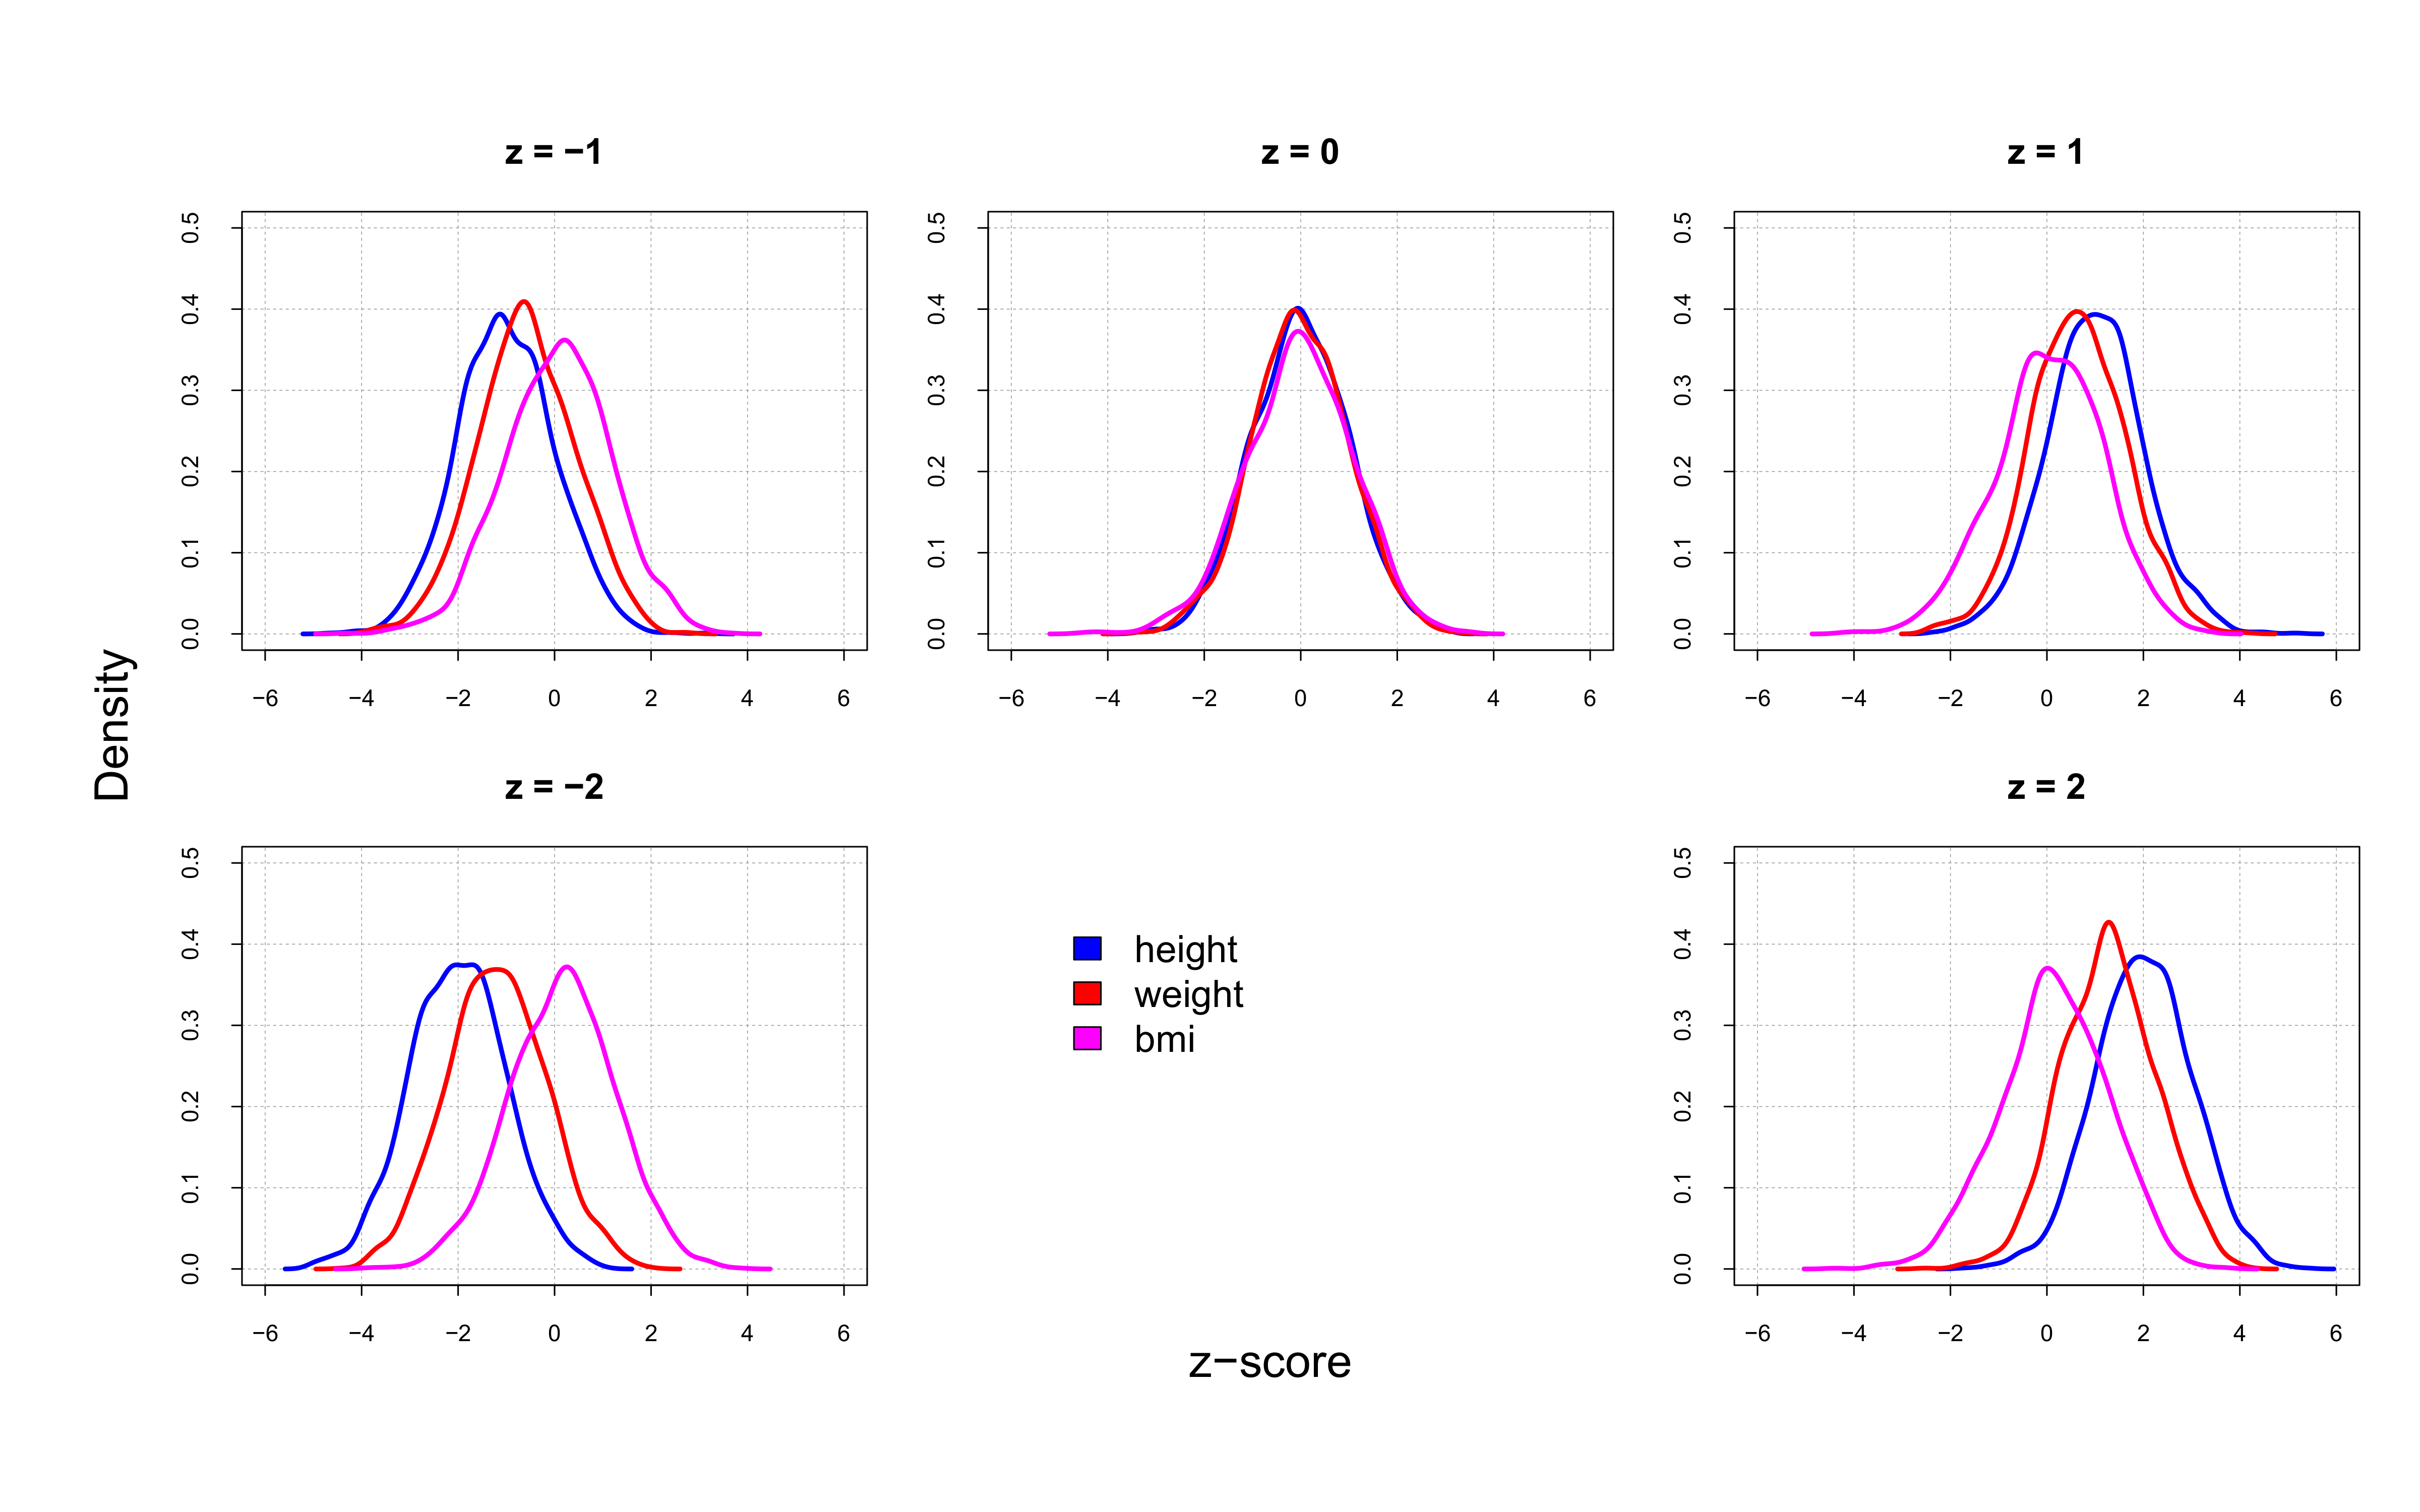
Figure 2 Density distributions of mean height-for-age z-scores (HAZ), mean weight-for-age
z-scores (WAZ), and mean BMI-for-age z-scores (BAZ) in 10,000 simulated 5-year-old boys.
HAZ, WAZ, and BAZ overlap in populations with median HAZ=0. The density distributions
disintegrate when HAZ0.
BAZ depends on HAZ and WAZ. Short and heavy children have higher BAZ than tall and light
children, the association, however, is not linear. The surface graphs (magic carpets)
indicate that children with the same HAZ and WAZ appear increasingly thin when they get
older (Figure 3). This is particularly relevant for tall children.
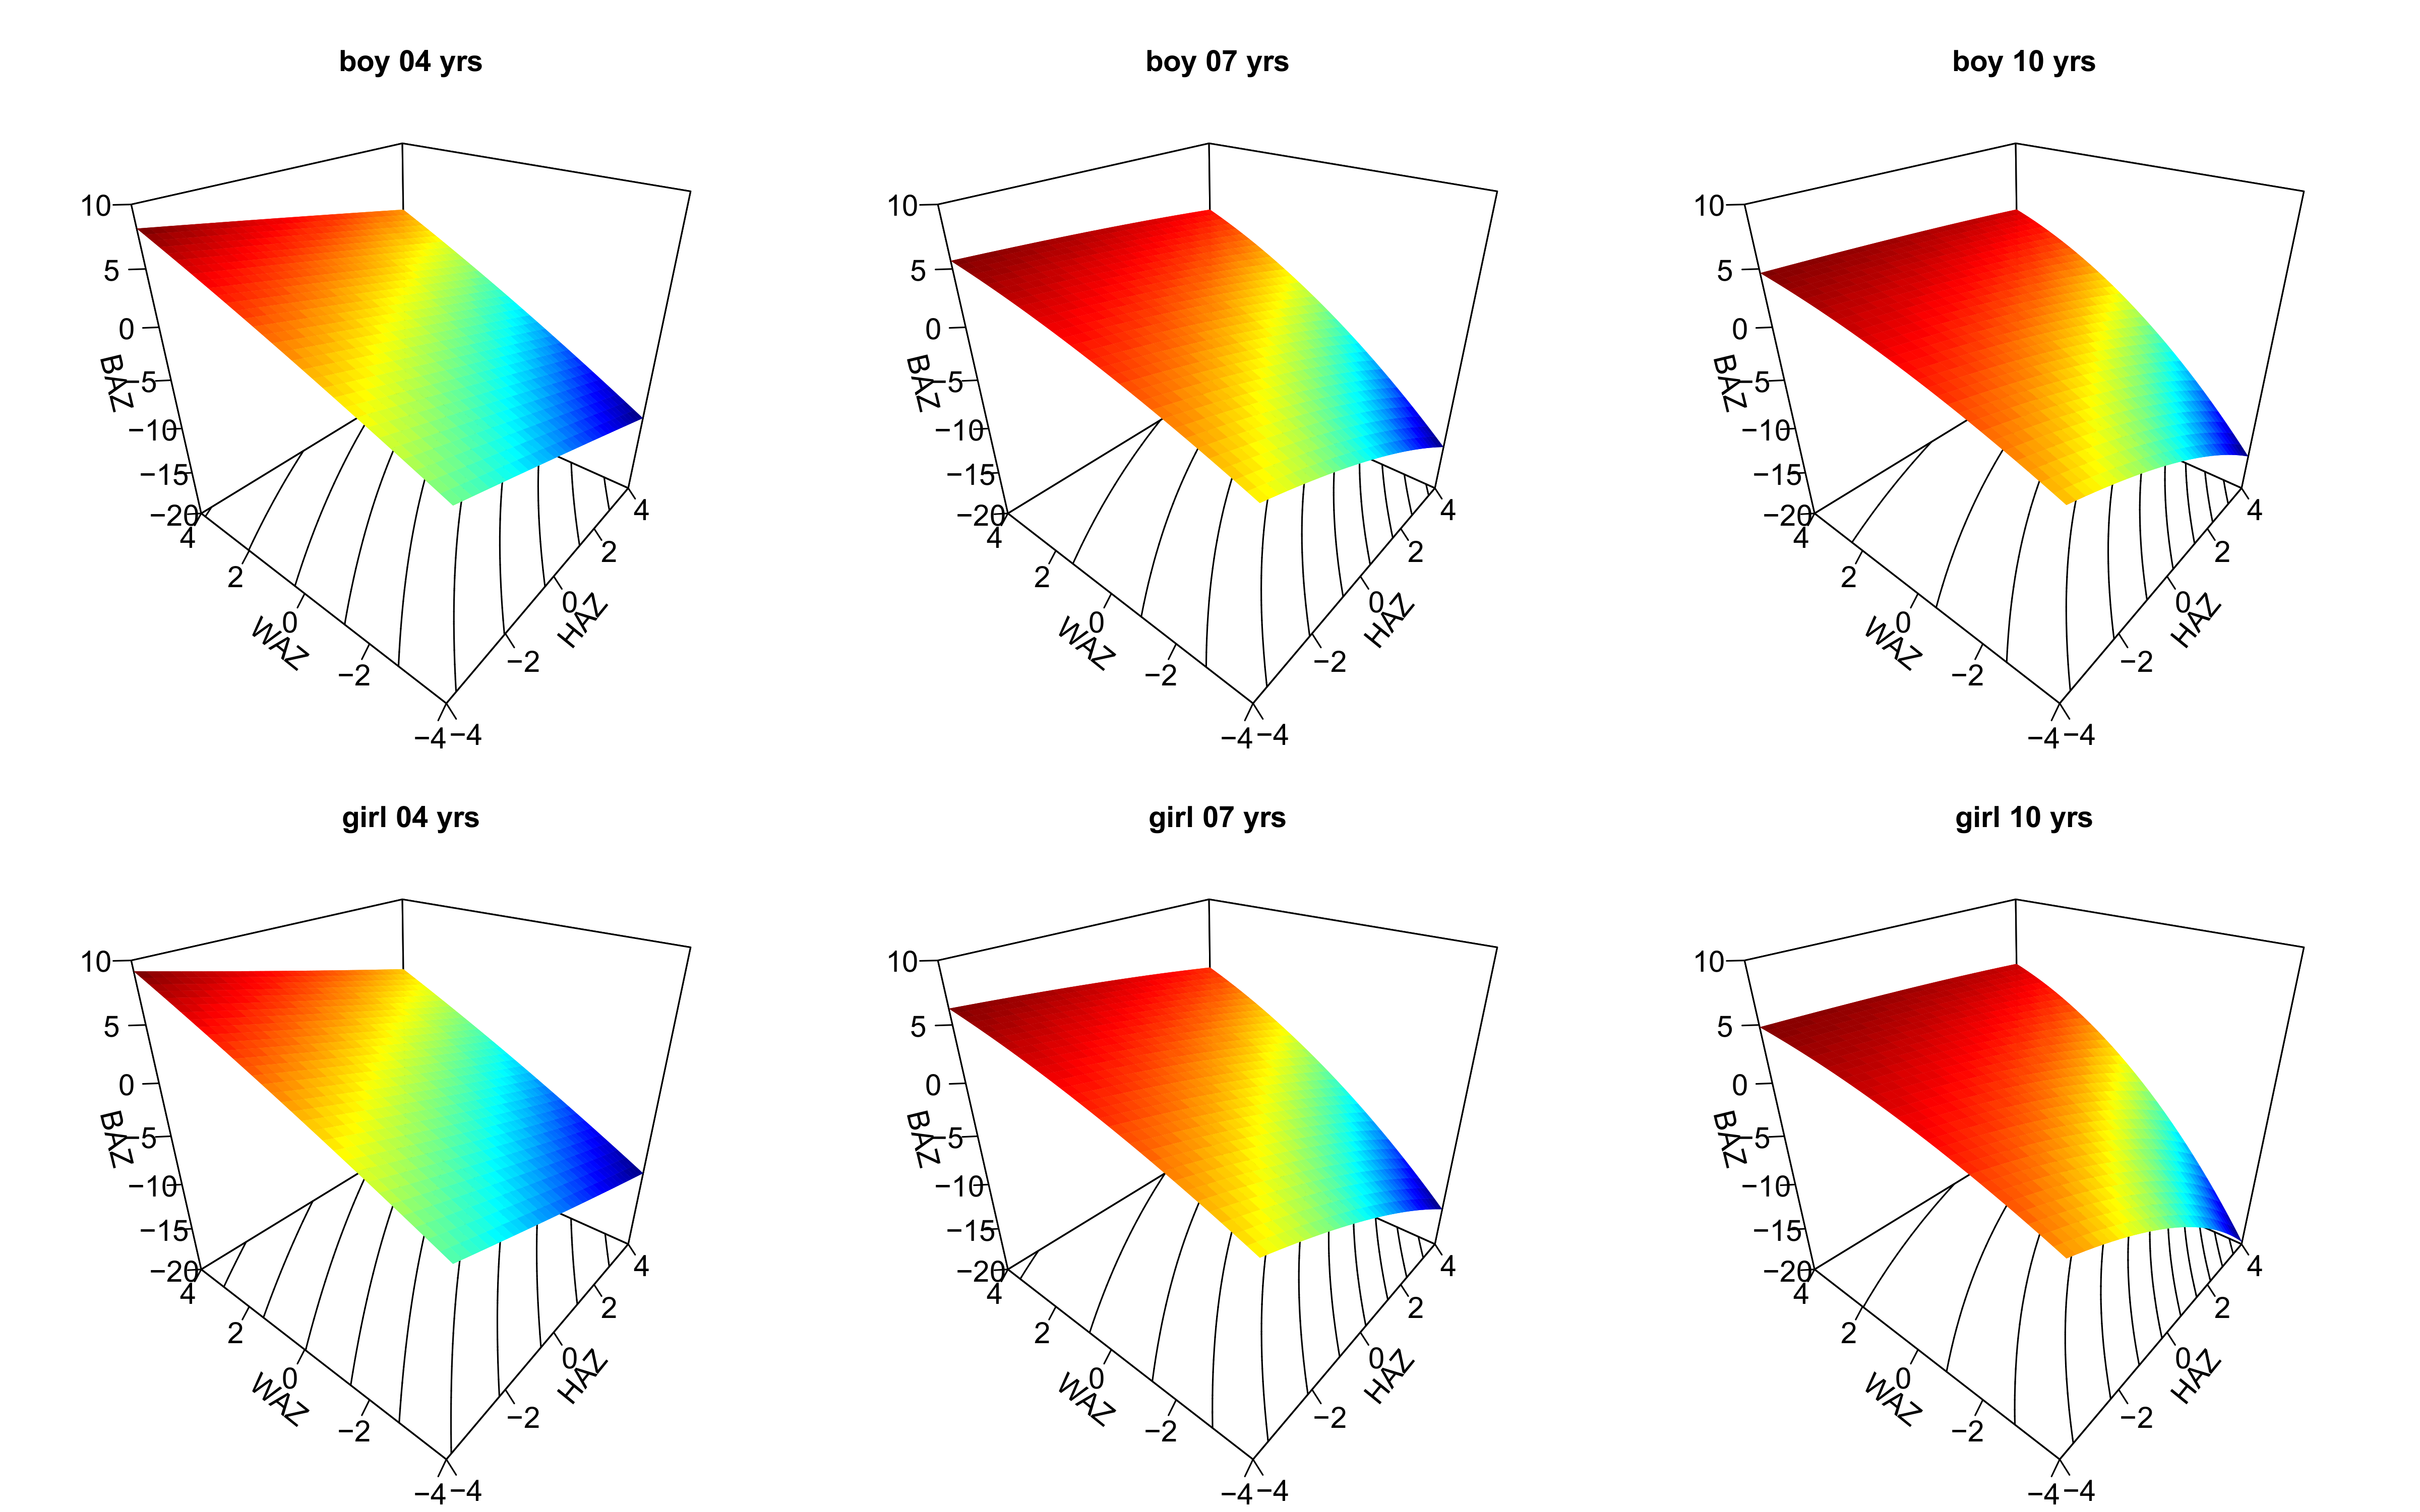
Figure 3 Surface graphs (magic carpets) of BMI-for-age z-scores (BAZ) in simulated child
populations at age 4, 7, and 10 years. BAZ depends on age with highest curvature in both
sexes at age 10 years.
The age dependence of BAZ becomes more apparent when relating BAZ to age and HAZ (Figure
4). In a “normal” population, the prevalence of thinness is expected to be 2.3% (BAZ <
-2), the prevalence of obesity 2.3% (BAZ > +2), and the prevalence of overweight plus
obesity 15.9% (BAZ > +1). This should be true regardless of age and average population
height. The magic carpets (surface graphs) should be horizontal without bumps and twists.
However, this is not the case. Only populations with mean HAZ = 0 (“normal populations”)
show the expected prevalences of thinness, overweight and obesity. Magic carpets get
strongly twisted when HAZ0 (Figure 4).
In short girls (mean HAZ=-2 to HAZ=-3), the prevalence of thinness falls to less than 1% in
the youngest and rises to 10% (mean HAZ=-2) and to 13% (mean HAZ=-3) at age 10 years. Very
similar results were obtained in the boys. On the other hand, the prevalence of obesity
rises to up to 7% in the shortest and youngest and falls close to zero at age 10 years.
Short young children and tall older children are more prone to be misclassified as
overweight than short older children and tall younger children, simply for arithmetic
reasons.
Discussion
Short children are usually lighter than tall children, but the association between height
and weight is not linear. The body mass index (BMI) depends on age and its density
distribution is skewed. To account for sex dependence and skewness, modern references for
BMI provide z-scores for BMI (BMI-for-age z-scores, BAZ) according to Cole's LMS method
(Cole 1990). BAZ are considered an appropriate
tool for assessing the nutritional state. Critical cut-off values for BAZ define “thinness”
(Cole and Lobstein 2012), “overweight” and
“obesity” (de Onis and Lobstein 2010). In a “normal”
population, thinness is expected to have a prevalence of 2.3%, obesity 2.3%, and overweight
plus obesity 15.9%. These cut-off values are used by international health organizations
(UNICEF 2020).
The present study confirms our hypothesis that the prevalence of thinness, overweight, and
obesity is not independent of the average height of the population. This is particularly
relevant in very short populations. Short young children are relatively too often
misclassified as overweight, short older children too often as thin. The present findings
coincide with recent observations published by Ricardo and co-workers (Ricardo et al. 2021) who showed that “the overall prevalence of
overweight declined with age from 6.3% for infants (aged 0–11 months) to 3.0% in 4 years
olds” in children of Low and Middle Income Countries.
The coexistence of being short and being overweight is often observed and currently
referred to as “double burden of malnutrition” (WHO
2016). It is considered a major public health challenge in many developing
countries and has prompted hundreds of publications, including a recent meta-analysis in
595,975 children under five years from 65 LMICs (Akombi
et al. 2019). We do not question that this combination does exists, but claims for
“urgent need to strengthen existing policies on child malnutrition to integrate and scale up
opportunities for innovative approaches which address the double burden of malnutrition in
children under five years in LMICs” (Akombi et al.
2019) need careful reconsideration and differentiation as to what extent the
“double burden of malnutrition” is a health issue and to what extent it reflects calculation
artefacts.
On purpose, we limited the present study to the age range from 2 to 10 years as the rapid
height and weight changes during infancy and puberty might unnecessarily complicate the
simulation. Thus, we cannot form an opinion on statements referring to adolescents such as
those published by Guedes and co-workers (Guedes et al.
2013) who wrote that “the low body weight/thinness for girls raised from 2.7% (7–10
years old) to 5.5% (15–17 years old); the body weight excess (overweight and obesity)
decreased from 30.1 to 16.2% for the same age groups”. Nevertheless, it appears suggestive
to assume that also these results may partially reflect the arithmetic dilemma when using
global references for stunted populations.
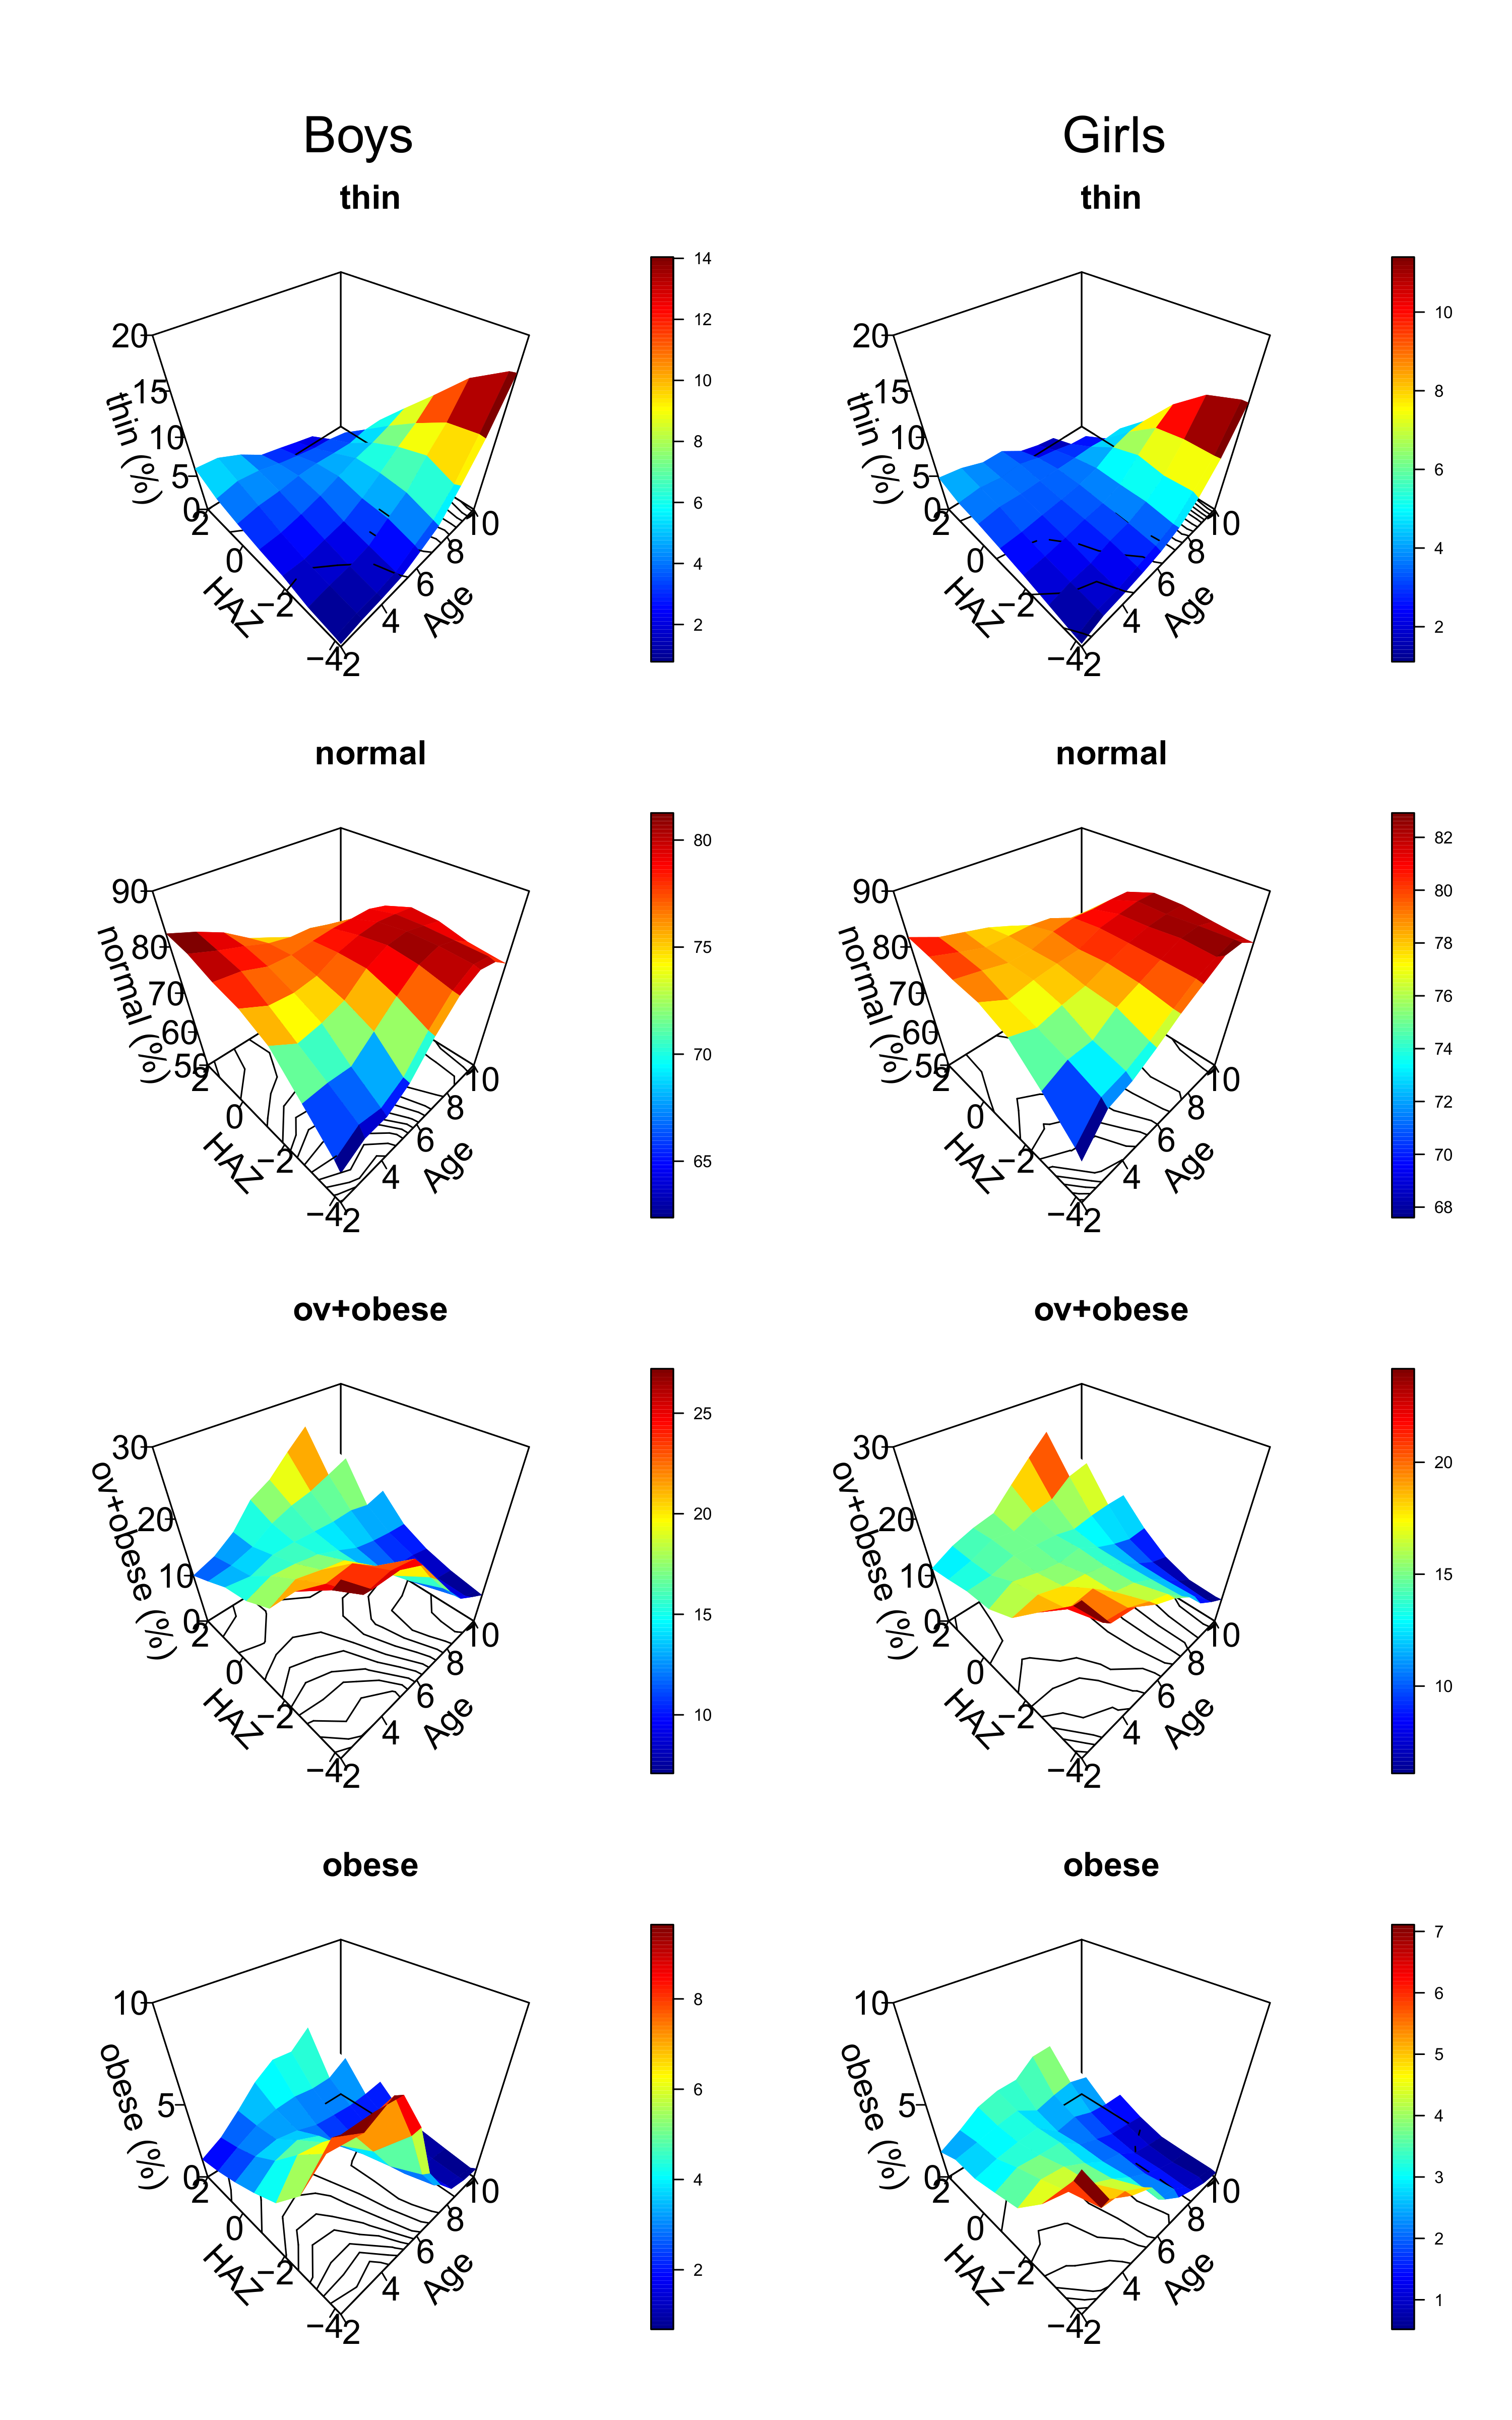
Figure 4 Magic carpets (surface graphs) depicting the prevalence of the normal state,
thinness, overweight+obesity, and obesity alone in simulated tall, normal and short
child populations. Colors indicate percent. The shape of the magic carpets depends on
age and mean population height. Short young and tall older children are more prone to be
misclassified as overweight and obese than short older and tall young
children.
Conclusion
The prevalence of thinness, overweight, and obesity when defined by z-scores for BMI,
depends on average population height and age. The coexistence of being short and being
overweight – currently referred to as “double burden of malnutrition” – is frequently
observed but needs careful consideration as to what extent this condition is a health issue
or reflects calculation artefacts. The arithmetic dilemma particularly affects young
children in short populations. We therefore suggest abstaining from defining “thinness”,
“overweight”, or “obesity” by BMI z-scores. Different states of under- and malnutrition
should rather be classified by direct or indirect measures of body fat, of which mid-upper
arm circumferences (Hai et al. 2020) and other
anthropometric variables and indices (Duggleby et al.
2009) have been suggested.
Acknowledgements
We greatly appreciate the help of Dr. Rebekka Mumm, Potsdam, and Prof. Christian Aßmann,
Bamberg. Parts of this analysis were performed at the International Student Summer School on
“Human Growth and Development”, Gülpe, Brandenburg, Germany, July 18th to
24th. The study was supported by the Auxological Society (Deutsche Gesellschaft
für Auxologie, DGA).
References
Akombi, B. J./Chitekwe, S./Sahle, B. W./Renzaho,
A. M. N. (2019). Estimating the double burden of malnutrition among 595,975 children in
65 low- and middle-income countries: a meta-analysis of demographic and health surveys.
International Journal of Environmental Research and Public Health 16 (16), E2886.
https://doi.org/10.3390/ijerph16162886.
CDC (2015). Growth chart training | DNPAO | CDC.
Available online at https://www.cdc.gov/nccdphp/dnpao/growthcharts/index.htm (accessed
3/21/2022).
Cole, T. J. (1990). The LMS method for
constructing normalized growth standards. European Journal of Clinical Nutrition 44 (1),
45–60.
Cole, T. J./Lobstein, T. (2012). Extended
international (IOTF) body mass index cut-offs for thinness, overweight and obesity.
Pediatric Obesity 7 (4), 284–294. https://doi.org/10.1111/j.2047-6310.2012.00064.x.
de Onis, M./Lobstein, T. (2010). Defining obesity
risk status in the general childhood population: Which cut-offs should we use?
International Journal of Pediatric Obesity 5 (6), 458–460. https://doi.org/10.3109/17477161003615583.
Duggleby, S. L./Jackson, A. A./Godfrey, K.
M./Robinson, S. M./Inskip, H. M. (2009). Cut-off points for anthropometric indices of
adiposity: differential classification in a large population of young women. The British
Journal of Nutrition 101 (3), 424–430. https://doi.org/10.1017/S0007114508012245.
Eveleth, P. B./Tanner, J. M. (1990). Worldwide
variation in human growth. Cambridge, Cambridge University Press.
Fredriks, A. M./van Buuren, S./Burgmeijer, R.
J./Meulmeester, J. F./Beuker, R. J./Brugman, E./Roede, M. J./Verloove-Vanhorick, S.
P./Wit, J. M. (2000). Continuing positive secular growth change in the Netherlands
1955-1997. Pediatric Research 47 (3), 316–323. https://doi.org/10.1203/00006450-200003000-00006.
Goodreau, S. M./Handcock, M. S./Hunter, D.
R./Butts, C. T./Morris, M. (2008). A statnet tutorial. Journal of Statistical Software
24 (1), 1–26. https://doi.org/10.18637/jss.v024.i09.
Guedes, D. P./Almeida, F. N./Neto, J. T. M./Maia,
Maria de Fátima de M./Tolentino, T. M. (2013). Low body weight/thinness, overweight and
obesity of children and adolescents from a Brazilian region of low economic status.
Revista Paulista de Pediatria 31, 437–443. https://doi.org/10.1590/S0103-05822013000400004.
Hai, T. T./Bardosono, S./Wiradnyani, L. A. A./Hop,
L. T./Ngan, H. T. D./Phuong, H. N. (2020). The optimal mid-upper-arm circumference
cutoffs to screen severe acute malnutrition in Vietnamese children. AIMS Public Health 7
(1), 188–196. https://doi.org/10.3934/publichealth.2020016.
Handcock, M. S./Hunter, D. R./Butts, C.
T./Goodreau, S. M./Morris, M. (2008). statnet: Software tools for the representation,
visualization, analysis and simulation of network data. Journal of Statistical Software
24 (1), 1548–7660. https://doi.org/10.18637/jss.v024.i01.
Mumm, R./Hermanussen, M. (2021). A short note on
the BMI and on secular changes in BMI. Human Biology and Public Health 2. https://doi.org/10.52905/hbph.v2.17.
NCD Risk Factor Collaboration (2017). Worldwide
trends in body-mass index, underweight, overweight, and obesity from 1975 to 2016: a
pooled analysis of 2416 population-based measurement studies in 128·9 million children,
adolescents, and adults. Lancet 390 (10113), 2627–2642. https://doi.org/10.1016/S0140-6736(17)32129-3.
Ricardo, L. I. C./Gatica-Domínguez,
G./Crochemore-Silva, I./Neves, P. A. R./dos Santos Vaz, J./Barros, A. J. D./Victora, C.
G. (2021). Age patterns in overweight and wasting prevalence of under 5-year-old
children from low- and middle-income countries. International Journal of Obesity, 1–6.
https://doi.org/10.1038/s41366-021-00911-5.
Soetaert, K. (2021). plot3D: Plotting
multi-dimensional data version 1.4 from CRAN. Available online at https://rdrr.io/cran/plot3D/
(accessed 9/28/2021).
Tanner, J. M. (1981). A history of the study of
human growth. Cambridge, Cambridge University Press.
The R Foundation (2022). The R Foundation.
Available online at https://www.r-project.org/foundation/ (accessed
8/18/2022).
UNICEF (2020). Malnutrition in children. Available
online at https://data.unicef.org/topic/nutrition/malnutrition/ (accessed
10/10/2021).
Walker, R./Gurven, M./Hill, K./Migliano,
A./Chagnon, N./de Souza, R./Djurovic, G./Hames, R./Hurtado, A. M./Kaplan, H./Kramer,
K./Oliver, W. J./Valeggia, C./Yamauchi, T. (2006). Growth rates and life histories in
twenty-two small-scale societies. American Journal of Human Biology 18 (3), 295–311.
https://doi.org/10.1002/ajhb.20510.
WHO (2006). WHO child growth standards:
length/height-for-age, weight-for-age, weight-for-length, weight-for-height and body
mass index-for-age: methods and development. Available online at https://www.who.int/publications/i/item/924154693X (accessed
9/25/2021).
WHO (2016). The double burden of malnutrition:
policy brief. Available online at https://apps.who.int/iris/handle/10665/255413 (accessed
8/19/2022).
WHO growth reference (2007). Growth reference data
for 5-19 years. Available online at https://www.who.int/toolkits/growth-reference-data-for-5to19-years
(accessed 8/19/2022).
WHO Multicentre Growth Reference Study Group
(2006). WHO Child Growth Standards based on length/height, weight and age. Acta
Paediatrica Suppl. 450, 76–85. https://doi.org/10.1111/j.1651-2227.2006.tb02378.x.
Zorlu, G. (2011). New WHO child growth standards
catch on. Bulletin of the World Health Organization 89 (4), 250–251. https://doi.org/10.2471/BLT.11.040411.