Evaluating the role of anthropometric and genetic risk factors in ACL injury susceptibility across an Australian and South African cohort
FirzanaFirfirey
Division of Physiological Sciences, Department of Human Biology, Faculty of Health Sciences, University of Cape Town, South Africa;
Health through Physical Activity, Lifestyle and Sport Research Centre (HPALS), Department of Human Biology, Faculty of Health Sciences, University of Cape Town, South Africa;
International Federation of Sports Medicine (FIMS), Collaborative Centre of Sports Medicine, Department of Human Biology, University of Cape Town, South Africa;
MJ NancyLaguette
Division of Physiological Sciences, Department of Human Biology, Faculty of Health Sciences, University of Cape Town, South Africa;
Health through Physical Activity, Lifestyle and Sport Research Centre (HPALS), Department of Human Biology, Faculty of Health Sciences, University of Cape Town, South Africa;
International Federation of Sports Medicine (FIMS), Collaborative Centre of Sports Medicine, Department of Human Biology, University of Cape Town, South Africa;
MalcolmCollins
Division of Physiological Sciences, Department of Human Biology, Faculty of Health Sciences, University of Cape Town, South Africa;
Health through Physical Activity, Lifestyle and Sport Research Centre (HPALS), Department of Human Biology, Faculty of Health Sciences, University of Cape Town, South Africa;
International Federation of Sports Medicine (FIMS), Collaborative Centre of Sports Medicine, Department of Human Biology, University of Cape Town, South Africa;
MichaelHermanussen
Pediatrician, Eckernförde-Altenhof, Germany;
Detlef Groth
IBB, Bioinformatics, University of Potsdam, Potsdam, Germany;
Scheffler
IBB, Human Biology, University of Potsdam, Potsdam, Germany
Division of Physiological Sciences, Department of Human Biology, Faculty of Health Sciences, University of Cape Town, South Africa;
Health through Physical Activity, Lifestyle and Sport Research Centre (HPALS), Department of Human Biology, Faculty of Health Sciences, University of Cape Town, South Africa;
International Federation of Sports Medicine (FIMS), Collaborative Centre of Sports Medicine, Department of Human Biology, University of Cape Town, South Africa;
BackgroundAnterior cruciate ligament rupture (ACL-R) is a common sports injury influenced by biomechanical, anthropometric, environmental, and genetic factors. Collagen gene polymorphisms have been implicated in ACL-R, with a whole-genome sequencing twin study highlighting COL12A1 rs970547 C>T as a variant of interest. However, the additive impact of the anthropometric traits and COL12A1 on ACL-R susceptibility remains unexplored.
ObjectivesTo investigate the additive effect of anthropometric traits and COL12A1 rs970547 C>T on ACL-R susceptibility in an Australian and South African cohort with the a priori hypothesis that female T/T carriers were at an increased risk.
Sample and MethodsThe study included ACL-R cases (Australia n = 354; South Africa n = 252) and controls (Australia n = 84; South Africa n = 232). COL12A1 rs970547 C>T SNP was genotyped using TaqMan® assays. Anthropometric traits were sex-stratified/standardised. Logistic regression and principal component analyses were assessed.
ResultsNo significant genetic associations were found for COL12A1 rs970547 C>T in the i) individual/combined and ii) male/female cohorts, p greater than 0.05. PCA revealed clustering of anthropometrics in PC1–PC2, with PC3 being driven exclusively by rs970547 in each cohort.
ConclusionNo associations were noted between the COL12A1 rs970547 T/T genotype and ACL-R risk. PCA, however, indicated that rs970547 may hold biological significance in ACL-R susceptibility, highlighting the complex interplay of genetic and anthropometric traits.
Keywords: Genetic polymorphisms, genetic association, anterior cruciate ligament rupture, anthropometric risk factors, principal component analyses in sports science
Conflicts of Interest: The authors declare no conflicts of interest surrounding the research conducted in this study. The funders had no role in the design of the study; in the collection, analyses, or interpretation of data; in the writing of the manuscript; or in the decision to publish the results.
Citation: Firfirey, F. et al. (2025). Evaluating the role of anthropometric and genetic risk factors in ACL injury susceptibility across an Australian and South African cohort. Human Biology and Public Health 2. https://doi.org/10.52905/hbph2025.2.103.
Permissions: The copyright remains with the authors. Copyright year 2025. Unless otherwise indicated, this work is licensed under a Creative Commons License Attribution 4.0 International. This does not apply to quoted content and works based on other permissions.
Consistent with previous findings, this study suggests that genetic or anthropometric factors alone do not fully explain ACL injury risk. More diverse studies with larger cohorts are needed to clarify the genetic basis of ACL injuries, including gene-gene interactions and their interplay with intrinsic and extrinsic risk factors.
Contents
Introduction
The anterior cruciate ligament (ACL) is a key ligament of the knee joint, essential for maintaining stability and controlling internal rotation (Domnick et al. 2016). The ligament originates from the femur (medial area) and inserts into the tibial plateau, and primarily prevents the anterior sliding of the tibia, thereby counteracting knee hyperextension (Domnick et al. 2016). As a major player in knee biomechanics, the ACL can bear up to 80% of the anterior force applied to the knee (Fujie 2016). Compared to other ligaments, the ACL is rather susceptible to acute and chronic injuries, with ruptures being among the most frequent and debilitating injuries in pivoting sports. Affected individuals often experience joint effusion, muscle weakness, pain, instability, and functional impairment (Spindler and Wright 2008; Belozo et al. 2024). The injury is associated with prolonged rehabilitation, reduced athletic performance and an increased risk of developing osteoarthritis (Evans et al. 2025).
The incidence of ACL-R worldwide ranges from 60 to 80 per 100,000 individuals, with significantly higher rates reported amongst elite athletes and younger populations (Sanders et al. 2016). Females, in particular, are reported to be three to six times more likely to sustain the injury compared to their male counterparts (Belozo et al. 2024). In addition, reports show ACL-R reconstruction surgeries represent a significant economic burden, though data from the African continent remain limited (Filbay et al. 2022; Ross et al. 2023; Peterson et al. 2025). The aetiology of ACL-R is multifactorial, involving the complex interactions of biomechanical, environmental and genetic risk factors, with non-contact mechanisms being particularly influenced by anthropometric traits and genetic predispositions (Posch et al. 2023; Sun et al. 2023; Seong et al. 2024; Borzemska et al. 2024; Belkhelladi et al. 2025).
Anthropometric traits such as body weight, height, anatomical alignments, and sex have been widely associated with susceptibility to ACL-R injury (Alsayed et al. 2023; Bowers et al. 2005). Notably, females are at increased risk due to varied hormonal patterns, neuromuscular control, and anatomical factors such as pelvic width and knee valgus angles (Mancino et al. 2024). For example, studies report that valgus knee alignment or excessive femoral anteversion can increase ACL strain during dynamic movements, particularly in individuals with genetic predispositions to weaker ligament structures (Tamura et al. 2017). Governed by height and weight, body mass index (BMI), lower limb alignment, and length, also has the potential to impact ACL-R susceptibility, as specific anatomical configurations can affect load distribution and increase stress on the ligament (Kamatsuki et al. 2024). Moreover, reports indicate anthropometric traits significantly correlate with graft size in ACL-R reconstruction, where smaller graft diameters are linked to a greater likelihood of graft failure (Salman et al. 2024).
Emerging evidence supports that the genetic basis for ACL-R susceptibility, with more than 80 genetic loci implicated in biological pathways relating to ligament rupture, extracellular matrix remodelling and tissue repair (Beckley et al. 2022; Feldmann et al. 2022; Feldmann et al. 2021; Rahim et al. 2022; Ribbans et al. 2022; Dlamini et al. 2023). Both candidate gene and genome-wide approaches have identified key contributors to ligament structure and integrity, particularly within the collagen gene family (Candela et al. 2024). Collagen is the primary structural protein within ligaments; therefore, polymorphisms within genes such as COL1A1, COL3A1, COL5A1, and COL12A1 have been of interest and repeatedly linked to ligament tensile strength and ECM organisation (Candela et al. 2024; September et al. 2007; Kaynak et al. 2017). Notably, COL12A1 encodes the α-1 chain of type XII collagen (Bulbul et al. 2023). This protein is involved in regulating fibrillogenesis and the mechanical properties of the collagen fibril bundles (Candela et al. 2024). It is hypothesised that COL12A1 most likely influences the biomechanical properties of the ligament and dictates ligament flexibility and resilience to injury (Candela et al. 2024; Bulbul et al. 2023). The COL12A1 rs970547 C>T polymorphism was associated with increased ACL-R susceptibility (Posthumus et al. 2010; John et al. 2016; Ahmetov et al. 2022; Ginevičienė and Urnikytė 2022; Zhao et al. 2020). This polymorphism is a non-synonymous single-nucleotide polymorphism (SNP) located in terminal exon 65 (position 3058), resulting in a glycine-to-serine substitution (Ahmetov et al. 2022; Ginevičienė and Urnikytė 2022). Following a whole-genome sequencing approach of two families, each with twin pairs who had sustained an ACL-R, highlighted that all nine ACL-R patients were homozygous for the COL12A1 rs970547 T/T genotype. However, the findings of the previous studies across different cohorts remain inconsistent (Ginevičienė and Urnikytė 2022; John et al. 2016; Massidda et al. 2023; Seong et al. 2024; Candela et al. 2024). Therefore, investigating this specific polymorphism remains important in the context of ACL-R susceptibility.
ACL-R risk is thus both multifactorial and polygenic. However, improving our understanding of ACL-R risk requires moving beyond single-factor models toward a multifactorial framework that considers the interaction of several factors, for example, traits such as anthropometric, genetic, biomechanical, and environmental influences. A review by Bittencourt et al. (Bittencourt et al. 2016) proposed a systems-based approach to injury risk, which highlighted the importance of examining how multiple factors can contribute to injury susceptibility. Similarly, September et al. (September et al. 2007) also highlighted the importance of combining genetic, clinical and biomechanical data in musculoskeletal soft tissue injury research, and the need to validate associations in other populations (September et al. 2007; September et al. 2009). Reports of combined risk factor approaches in ACL-R susceptibility are limited and remain to be explored (Hewett et al. 2010). Evidence from sports genomics suggests that genetic polymorphisms can influence anthropometric traits like height, body mass, and joint alignment, which may in turn influence biomechanical loading and injury risk (Chiquet et al. 2014; Belkhelladi et al. 2025; Ribas et al. 2023; Tucker and Collins 2012; Wang et al. 2014). Building on this framework, we evaluated an a priori hypothesis, suggesting that female COL12A1 rs970547 C>T, T/T carriers are at an increased risk of reporting ACL-R. In addition, we aimed to assess the additive impact of anthropometric and genetic factors in ACL-R injury risk in two distinct (Australia and South Africa) cohorts, and in a combined cohort (Australia+South Africa). The objectives of this study were to evaluate i) anthropometric factors (age, height, weight, and BMI) between control and ACL-R groups for each cohort, and ii) to determine the genotype frequency distribution of the COL12A1 rs970547 C>T polymorphism within each cohort and the combined cohort.
Materials and Methods
Study design
The present study was a case-control study conducted following the STREGA reporting recommendations for reporting genetic association studies (Little et al. 2009).
A total of 287 individuals (Males [M] = 155, Females [F] = 132) aged between 14 and 47 years, surgically diagnosed with ACL ruptures, were recruited from Epworth Hospital, Melbourne, Australia, forming the symptomatic AUS ACL group. Eligible participants had no history of musculoskeletal or connective tissue disorders, chronic illnesses, or non-communicable diseases. Of these, 165 participants reported a non-contact mechanism of injury, meaning the injury occurred without direct external force or physical contact from another player or object, forming the NON-subgroup. Additionally, 84 male control participants, aged 18 – 47 years, were recruited from non-competitive sports backgrounds in Melbourne, forming the asymptomatic AUS CON group. Controls were unrelated, physically active males without a history of ligament or tendon injuries, chronic diseases, or major musculoskeletal issues, including ACL injuries.
South African participant recruitment
As an extension of the study conducted by Posthumus et al. (Posthumus et al. 2010), assessing n = 129 (38 female) ACL-R and n = 216 (83 female) controls, this study included additional samples (n = 123 ACL-R and n = 16 control), which were recruited between January 2012 and May 2016 as per the STREGA recommendations. A total of 252 (M = 185, F = 67) individuals aged between 18 – 60 years, and surgically diagnosed with ACL ruptures were recruited by convenience sampling from Sports Orthopaedic and Sports Medicine clinics in Cape Town, Western Cape, South Africa. Eligible candidates were considered if they were surgically diagnosed with ACL ruptures with no history of musculoskeletal or connective tissue disorders. Candidates also had no history of chronic illness, or non-communicable diseases, self-reported Caucasian ancestry, and were otherwise healthy. Of the 252 ACL cases, 164 participants reported a non-contact mechanism of injury, forming a subgroup for mechanism of injury (NON-subgroup). In addition, 232 control (M = 130, F = 102) asymptomatic participants aged 18–63 years, were also recruited from sports clubs around Cape Town, South Africa. These participants were physically active, unrelated and sex-matched Caucasian participants without any self-reported history of ligament or tendon injuries.
Ethical approval was obtained from the Human Ethics Research Committee at Victoria University (HRE13-223) and the Human Research Ethics Committee at the University of Cape Town (HREC 164/2006 and 622/2015) for this study.
Study outcomes
DNA extraction
Sampling for genomic DNA for the Australian cohort has previously been described (Alvarez-Romero et al. 2021). To summarise, DNA was isolated from venous blood (roughly 4.5ml) using the MagSep Blood gDNA kit (Eppendorf, Germany) with the epMotion M5073 automated pipetting system (Eppendorf, Germany). A sampling of genomic DNA from the South African cohort has also been described elsewhere (Alvarez-Romero et al. 2021). Genomic DNA was isolated from roughly 4.5ml of venous blood using a modified protocol first described by Lahiri and Nurnberger (Lahiri and Nurnberger 1991). All DNA samples were stored at −20°C until further analysis, and freeze-thaw cycles were avoided.
SNP selection and Genotyping
The selection of polymorphism within the candidate gene COL12A1 was driven by the hypothesis that the polymorphisms may have a notable impact on the associated protein product (Ginevičienė and Urnikytė 2022). Genotyping of the Australian and South African cohorts for the COL12A1 rs970547 C>T SNP was performed using TaqMan® SNP Genotyping Assays (Thermofisher Scientific, Applied Biosystems, CA, USA), following the manufacturer’s protocol. Sample reactions were conducted using 96-well plates with each reaction consisted of 4µl of TaqMan® genotype master mix, 0.2µl of TaqMan® specific primer (1X final concentration), 2.8µl of dH2O and 1µl of DNA template ([DNA] 1−10ng) to a final volume 8µl. Standard Polymerase Chain Reaction (PCR) conditions were applied as previously described, following the manufacturer's instructions, (Firfirey et al. 2022). Each reaction plate included three technical replicates and three negative controls to ensure experimental integrity, while genotyping quality control was ensured using a two-person call and check system. The Quant studio 3 Real-time PCR (Thermofisher Scientific, Applied Biosystems, CA, USA) system and ThermoFisher Cloud genotyping analysis Software Version 3.3.0-SR2-build 21 were used to conduct the PCR reaction. Successful genotyping was confirmed when all DNA samples were amplified for the SNP except for a few cases where amplification failed even after two repeated attempts. The study research was conducted at the Health through Physical Activity, Lifestyle and Sport Research Centre (HPALS), within the Division of Physiological Sciences, Department of Human Biology, The University of Cape Town, SA.
Statistical analysis
Sample size and Power Analysis
Sample size calculations (Supplementary Table 1) were performed to determine the required (n) to detect associations between COL12A1 rs970547 C>T and ACL-R risk, under three genetic models (dominant, recessive, and log-additive). Calculations assumed a minor allele frequency (MAF) of 0.288 (as reported by the 1000 Genomes Project), 80% statistical power, and a significance level of 0.05. For an odds ratio (OR) of 1.5, the required sample sizes were: n = 368 (dominant), n = 1392 (recessive), and n = 248 (log-additive). For an OR of 2.0, required sample sizes were n = 134 (dominant), n = 504 (recessive), and n = 90 (log-additive). At an OR of 2.5, sufficient power was achieved with n = 78 (dominant), n = 305 (recessive), and n = 55 (log-additive). In addition, post hoc power analyses indicated that the available sample sizes in both the Australian (N = 434) and South African (N = 484) cohorts provided > 90% power to detect associations under dominant and log-additive models for ORs ranging from 2.0 to 2.5. For the recessive model, > 70% power was achieved at an OR of 2.5.
Distribution and Group Comparisons
The Shapiro–Wilk test was used to assess the normality of quantitative data (age [yrs], height [cm], weight [kg], and BMI [kg/m²]) within each of the cohorts. Normality testing was performed separately for each cohort and subgroup (Control [CON], ACL-R injury [ACL-R], and Non-contact injury [NON]). Most variables within the subgroups yielded p-values that were < 0.05, indicating non-normal distributions. Non-parametric testing was therefore applied for group comparisons.
Quantitative data (age [yrs], height [cm], weight [kg], and BMI [kg/m²]) were first analysed separately for males and females (sex-stratified). Subsequent analyses also included sex-standardisation by calculating z-scores to account for residual variability. Quantitative data were compared using the Wilcoxon Rank-Sum test or the Kruskal–Wallis test, with corresponding effect sizes expressed as the correlation coefficient (r) and epsilon squared (ε²), respectively. Qualitative categorical variables were analysed using Pearson’s chi-square test or Fisher’s exact test (for expected cell counts < 10), with effect sizes reported as Cohen’s w. Quantitative results are expressed as mean ± standard deviation (m ± sd) or median (interquartile range, [IQR]), and qualitative data as percentages (n count). Effect sizes were interpreted according to established thresholds: small (r almost equals 0.10, w almost equals 0.10, epsilon squared less than 0.01), medium (r almost equals 0.30, w almost equals 0.30, epsilon squared almost equals 0.04 en dash 0.16), and large/strong (r greater than or equals 0.50, w greater than or equals 0.50, epsilon squared greater than or equals 0.16).
Anthropometric traits
To account for sex-related variability, anthropometric measures (age, height, weight, BMI) were i) sex-stratified and ii) sex-standardised within groups by Control (CON) and ACL-R, as well as by genotype (C/C, C/T and T/T) groups. Comparative analyses of sex-stratified and standardised data for each cohort were conducted using Wilcoxon rank-sum tests, with the respective effect size (r). Furthermore, Bonferroni correction was applied to adjust the significance threshold to account for multiple comparisons.
Genotype Analyses
Initial analyses were performed to compare genotype frequency distributions between the (i) Australian and South African control groups, (ii) Australian and South African ACL-R groups, and (iii) combined (Australian + South African) controls versus combined (Australian + South African) ACL-R cases. Comparisons were also performed to compare the genotype frequencies of the Australian and South African cohorts with those of the global reference populations obtained from the 1000 Genomes Project.
Multivariate Analyses
Logistic regression analysis was performed using the "SNPassoc" (v2.0.2) package. Genotype/allele frequency distribution patterns were evaluated between the control, ACL-R and the NON-subgroups within each cohort, with data adjusted for sex. Genotype frequency distribution patterns were also evaluated for all male and all female groups in the South African and combined (Australia + South Africa) cohorts. Odds ratios [OR] and confidence intervals at 95% [95% CI] were recorded. Hardy-Weinberg equilibrium (HWE) probabilities were assessed using the "genetics" (v1.3.8.1.3) packages (González et al. 2007). Given the focused evaluation of the a priori hypothesis using a single SNP, we did not correct for multiple testing. Principal Component Analysis (PCA) was performed to explore multivariate patterns using the “stats” and “ggplots”, “grid” packages. To account for sex imbalance, PCA was conducted on sex-stratified z-scores of age, height, weight, and BMI, as well as the COL12A1 rs970547 C>T SNP using the prcomp() function in R.
Software
Sample size and study power calculation were performed using the QUANTO V1.2.3 program.
All statistical analyses were conducted using the R language and programming environment (http://www.r-project.org), R Studio V1.3.1056 running R V4.0.4. Statistical significance was accepted at p less than 0.05.
Results
Participants anthropometric traits
The Shapiro-Wilk test revealed significant deviations from normality for most variables across the Australian and South African cohorts (Supplementary Table 2). In the Australian cohort, all variables demonstrated non-normal distribution patterns (p<0.05), except for the height and weight control groups. Similarly, in the South African cohort (Supplementary Table 2), all variables demonstrated non-normally distributed patterns within all groups except for the CON and NON-subgroups in height and weight, respectively, p < 0.05 (Supplementary Table 2).
Anthropometric trait distribution across control, ACL-R and NON-subgroups
Australia: group comparisons when stratified by sex (Supplementary Table 3), showed Australian males were significantly younger in the ACL-R (25.4 [18.6 – 29.3], p less than 0.001, adjusted p less than 0.001, r equals 0.32) and the NON-subgroups (26.4 [19.9 – 29.1], p less than 0.001, adjusted p less than 0.001, r equals 0.31) compared to the CON (30.6 [25.0 – 38.2]) group. No significant group differences were noted for height, weight and BMI after correction, p greater than 0.05. Australian females could not be compared between groups due to the absence of female controls.
Comparison after sex-standardised analyses (Supplementary Table 4) showed that age remained significantly different between the ACL-R (p less than 0.001, adjusted p less than 0.001, r equals en dash 0.22) and the NON-subgroups (p less than 0.001, adjusted p less than 0.001, r equals 0.25) compared to the CON group. Whereas the observed differences in unadjusted height, weight, and BMI were no longer significant after Bonferroni correction (adjusted p > 0.05), with small effect sizes < 0.15 noted. This could indicate that sex imbalances may partially drive the differences between CON and ACL-R groups.
South Africa: group comparisons when stratified by sex (Supplementary Table 3) reinforced that the differences observed were sex-driven. South African ACL-R (22.0 [18.0 – 30.0], p equals 0.001, adjusted p equals 0.004, r equals 0.20) and the NON-subgroup (23.0 [19.0 – 31.0], p equals 0.012, adjusted p equals 0.048, r equals 0.16) males were significantly younger than CON (24.0 [22.0 – 33.0]). ACL-R (adjusted p less than or equals 0.004, r equals 0.22) and the NON-subgroup (adjusted p less than or equals 0.004, r less than or equals 0.23) males also had greater weight and BMI compared to the CON group. No significant differences were further observed, while no significant differences were detected for height. No significant differences were further observed, adjusted p greater than 0.05.
Group comparisons using sex-standardised scores (Supplementary Table 4), showed age remained significantly different between the CON, ACL-R (p less than 0.001, adjusted p less than 0.001, r equals en dash 0.18) and the NON-subgroups (p equals 0.003, adjusted p equals 0.014, r equals 0.15), although effect sizes were small. BMI also differed significantly between the CON and ACL-R (p equals 0.002, adjusted p equals 0.007 comma r equals 0.14) groups. No significant group differences were detected, and overall effect sizes remained small left parenthesis less than 0.2) across variables.
Anthropometric trait distribution across COL12A1 rs970547 C>T genotype groups
Australia: summarised in Supplementary Table 5, no significant differences in distribution patterns were observed across the rs970547 C>T genotypes (C/C, C/T, and T/T) for age (p equals 0.466, adjusted p equals 0.476), height (p equals 0.426, adjusted p equals 0.330), weight (p equals 0.656, adjusted p equals 0.641), or BMI (p equals 0.546, adjusted p equals 0.548). Median (IQR) values for age were 22.7 (17.5 – 26.3) in C/C, 26.8 (19.0 – 32.0) in C/T, and 25.9 (19.2 – 30.9) in T/T carriers. Height, weight and BMI showed similar distribution patterns across all three genotypes, p greater than 0.05. Sex distribution did not differ across genotypes (p = 0.950) either, and effect sizes were negligible left parenthesis less than or equals 0.02), suggesting no significant influence between genotype and sex in this cohort. Comparison of sex-stratified (Figure 8) and sex-standardised (Supplementary Table 6) distribution patterns of anthropometric traits, showed no significant differences across the C/C, C/T and T/T genotypes either, p greater than 0.05, epsilon 2 less than or equals 0.013.
South Africa: no significant differences (Supplementary Table 5) in distribution patterns for age (p equals 0.575, adjusted p equals 0.500), height (p equals 0.710, adjusted p equals 0.456), weight (p equals 0.493, adjusted p equals 0.185), or BMI (p equals 0.348, adjusted p equals 0.195) were observed across the rs970547 C>T genotypes. Median (IQR) ages were 24.5 (19.5 – 31.5) in C/C, 24.0 (22.0 – 33.5) in C/T, and 23.0 (21.0 – 34.0) in T/T carriers. Height, weight, and BMI distributions were similar between genotypes, p greater than 0.05. Similarly, sex distribution did not differ across genotypes either (> 0.05) and effect sizes were once more negligible (less than or equals 0.05). In sex-stratified (Figure 9) comparisons, South African males showed a trend towards differences in BMI (p = 0.042) distribution across the C/C, C/T and T/T genotypes, with small effect size (epsilon squared equals 0.008). In the sex-standardised comparisons, no significant genotype-related differences across anthropometric traits were further noted, p greater than 0.05, epsilon 2 less than or equals 0.003.
Genetic Traits
COL12A1 rs970547 C>T genotype and allele frequency distribution patterns of the Australian and South African cohorts
Figure 1 Genotype Frequency Distribution of COL12A1 rs970547 C>T (T/T vs. C/T + C/C) across the Australian (AUS) and South African (SA) cohorts. Bar plots depict the percentage distribution of the T/T (grey) and combined C/T + C/C (white) genotypes between the i) Australian and South African controls (CON), ii) Australian and South African ACL-R groups and iii) Combined (Australian and South African) controls (CON) and ACL-R groups.
Comparative analysis of the genotype distribution patterns shown in Figure 1 showed more T/T genotype carriers in the South African ACL-R (64.7%) group compared to the Australian ACL-R (53.2%) group, p equals 0.011. No further significant associations were noted in the genotype distributions (CT and CC) between these two cohorts, p less than 0.05.
Figure 2 Genotype Frequency Distribution of COL12A1 rs970547 C>T(T/T vs. C/T + C/C) between the Australian, South African, and the 1000 Genomes Project Global Population: Comparison by Cohort. Bar plot illustrating the distribution of the rs970547 T/T (grey), and C/T+C/C (white) genotypes in the Australian and South African cohorts compared to the Global populations from the 1000 Genomes Project. Including the five reference subpopulation groups: African: AFR, American: AMR, European: EUR, East Asian: EAS, South Asian: SAS. P-values represent the comparison between Australia and South Africa, and the 1000 Genomes Project Global Populations.
Genotype frequency distribution patterns across cohorts are shown in Figure 2. Comparison between the study cohorts revealed that T/T genotype carriers were marginally less frequent in the Australian cohort compared to the South African cohort, p = 0.040. Still, there were more T/T genotype carriers in the Australian (54.5%) cohort (CON + ACL-R), compared to the African (46.4%), East Asian (46.8%) and South Asian (46.8%) reference populations, highlighting a significant ancestral divergence for this allele, p less than 0.05. In South Africa (61.9%), there were also more T/T genotype carriers compared to the Global (51.4%), African (46.4%), American (60.2%), East Asian (46.8%), and South Asian (46.8%) populations (p less than 0.05). Reinforcing an ancestral divergence of the T allele in the South African cohort relative to these populations. No significant associations were further noted, p greater than 0.05.
The a priori hypothesis: COL12A1 rs970547 C>T, TT genotype is associated with ACL-R risk
No significant association was observed between COL12A1 rs970547 C>T, and ACL-R risk in either of the Australian and South African cohorts. In the Australian cohort (Supplementary Table 6), the T/T, C/T, and C/C genotypes frequency distribution patterns were comparable across the CON, ACL-R (p equals 0.218, sex-adjusted p equals 0.151), and the NON-subgroups (p equals 0.504, sex-adjusted p equals 0.152). Similarly, there were no differences in the allele frequency distributions between any of the groups, p greater than 0.05. No differences were noted in the genotype or allele frequencies between any of the cohorts (Supplementary Table 6), p greater than 0.05.
Figure 3 Genotype frequency distributions of the COL12A1 rs970547 C>T polymorphism between control and ACL-R cases for male and female groups within the South African and the combined Australian and South African cohorts. Depicted are the T/T, C/T, C/C and C allele frequencies within the CON (black), ACL-R (grey) and NON-subgroups (white) for A) Australian Males, B) South African Males, C) South African Females, D) Combined (Australia and South Africa) Males and E) Combined (Australia and South Africa) Females. P-values represent the following comparisons between the controls (CON) vs a) ACL-R, and b) NON-subgroup, and the C Allele control vs c) ACL-R, and d) NON-subgroup.
Shown in Figure 3, no differences were noted when only males or only female participants were compared for Australia, South Africa or the combined (Australia and South Africa) cohorts, p greater than 0.05. No logistic regression analyses were performed for the Australian female cohort, as a corresponding control group was not present.
All groups (Supplementary Table 7) were in HWE for the COL12A1 rs970547 C>T SNP, except for the South African NON-subgroup, HWE (p equals 0.030).
Principal Component analyses
Sex-standardised PCA included the anthropometric traits, age, height, weight, BMI and the COL12A1 rs970547 C>T SNP and were evaluated for the Australian and South African cohorts. Analyses revealed five components, of which the first three components accounted for the total (83.4% and 83.3%) variability observed, respectively (Supplementary Table 8).
Figure 4 Principal Component Analysis (PCA) biplot presenting PC1 and PC2 based on sex-standardised anthropometric variables (Age, Height, Weight, BMI) and genotype (COL12A1 rs970547 C>T) for the Australian cohort. Arrows indicate variable loadings, showing the direction and magnitude of each variable’s contribution to the principal components. Shown are individuals stratified by sex, males in red diamonds, and females in blue triangles. PC1 and PC2 explain 41.7% and 21.6% of the total variance for this cohort, respectively.
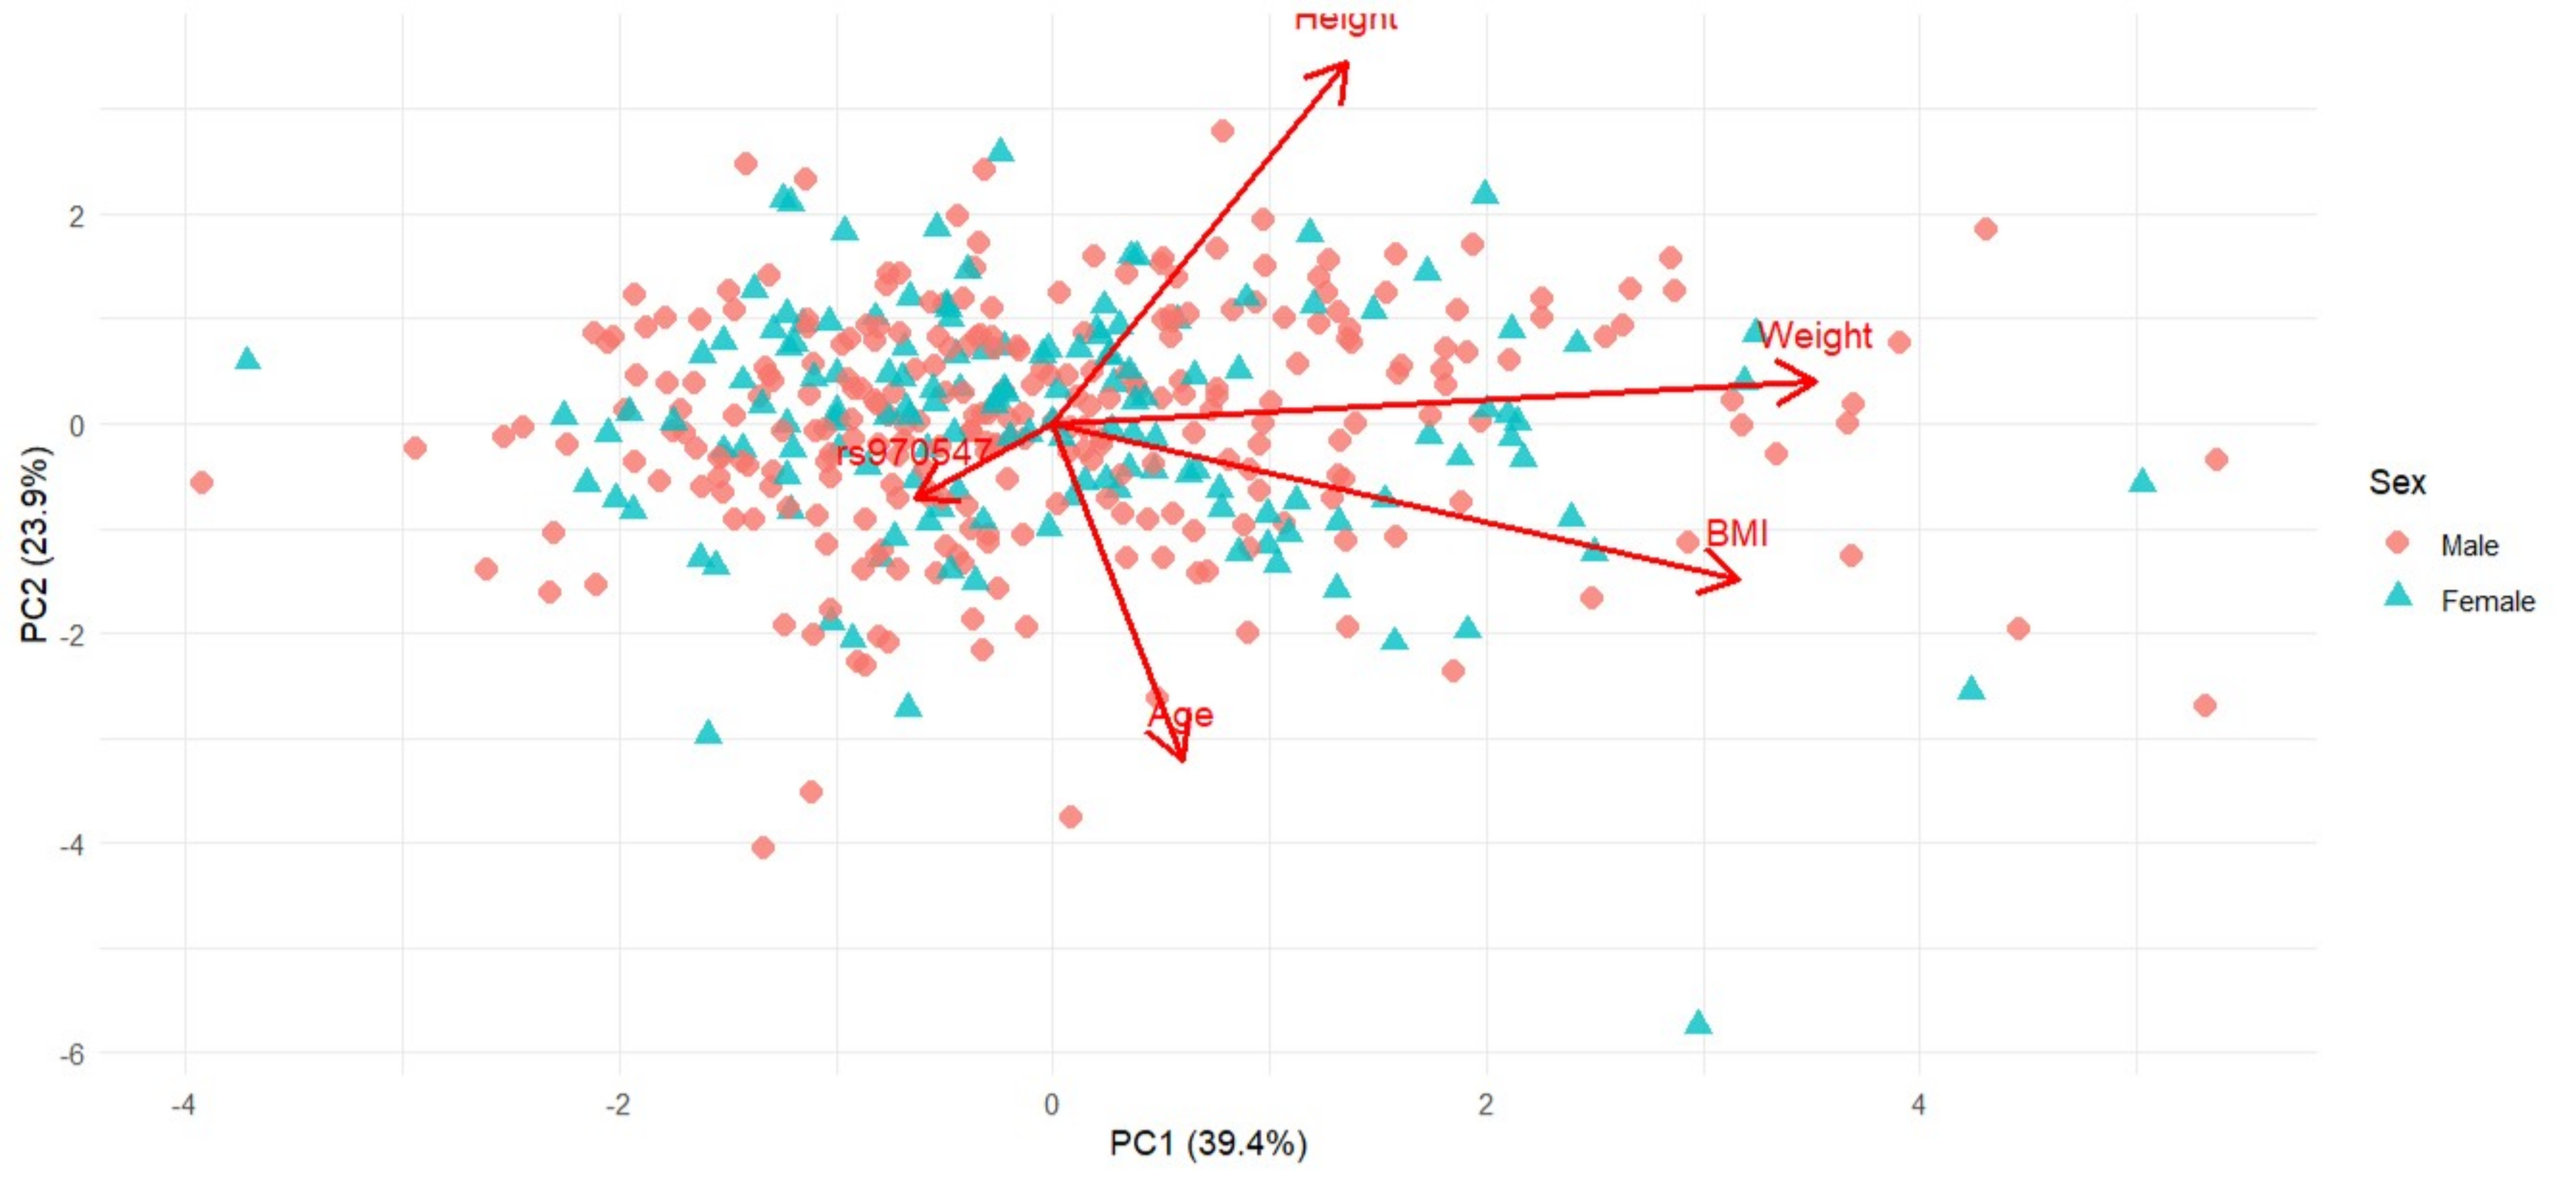
PC1, which accounted for 41.7% and 39.5% of the total variability in the Australian and South African cohorts, respectively, was mostly influenced by anthropometric traits. For Australia (Figure 4), this PC was negatively influenced by weight (loading = -0.684) and BMI (loading = -0.610), with the negative direction implying that higher PC scores are associated with lower weight or BMI. In contrast, South Africa (Figure 6) was positively influenced by weight (loading = 0.704) and BMI (loading = 0.633), indicating that higher PC1 scores are associated with greater weight or BMI.
PC2, which explained 21.6% and 23.9% of the variability, was influenced by height (loading = -0.693 and 0.689) and age (loading = 0.646 and -0.640), which reflected opposite trends in these traits for each of the Australian and South African cohorts, respectively. This suggests that the Australian participants were taller and younger, whereas the South African participants were shorter and older. No genetic effect on height was observed for the Australian and South African cohorts, and therefore, we hypothesised that differences were likely influenced by environmental factors not captured in this study.
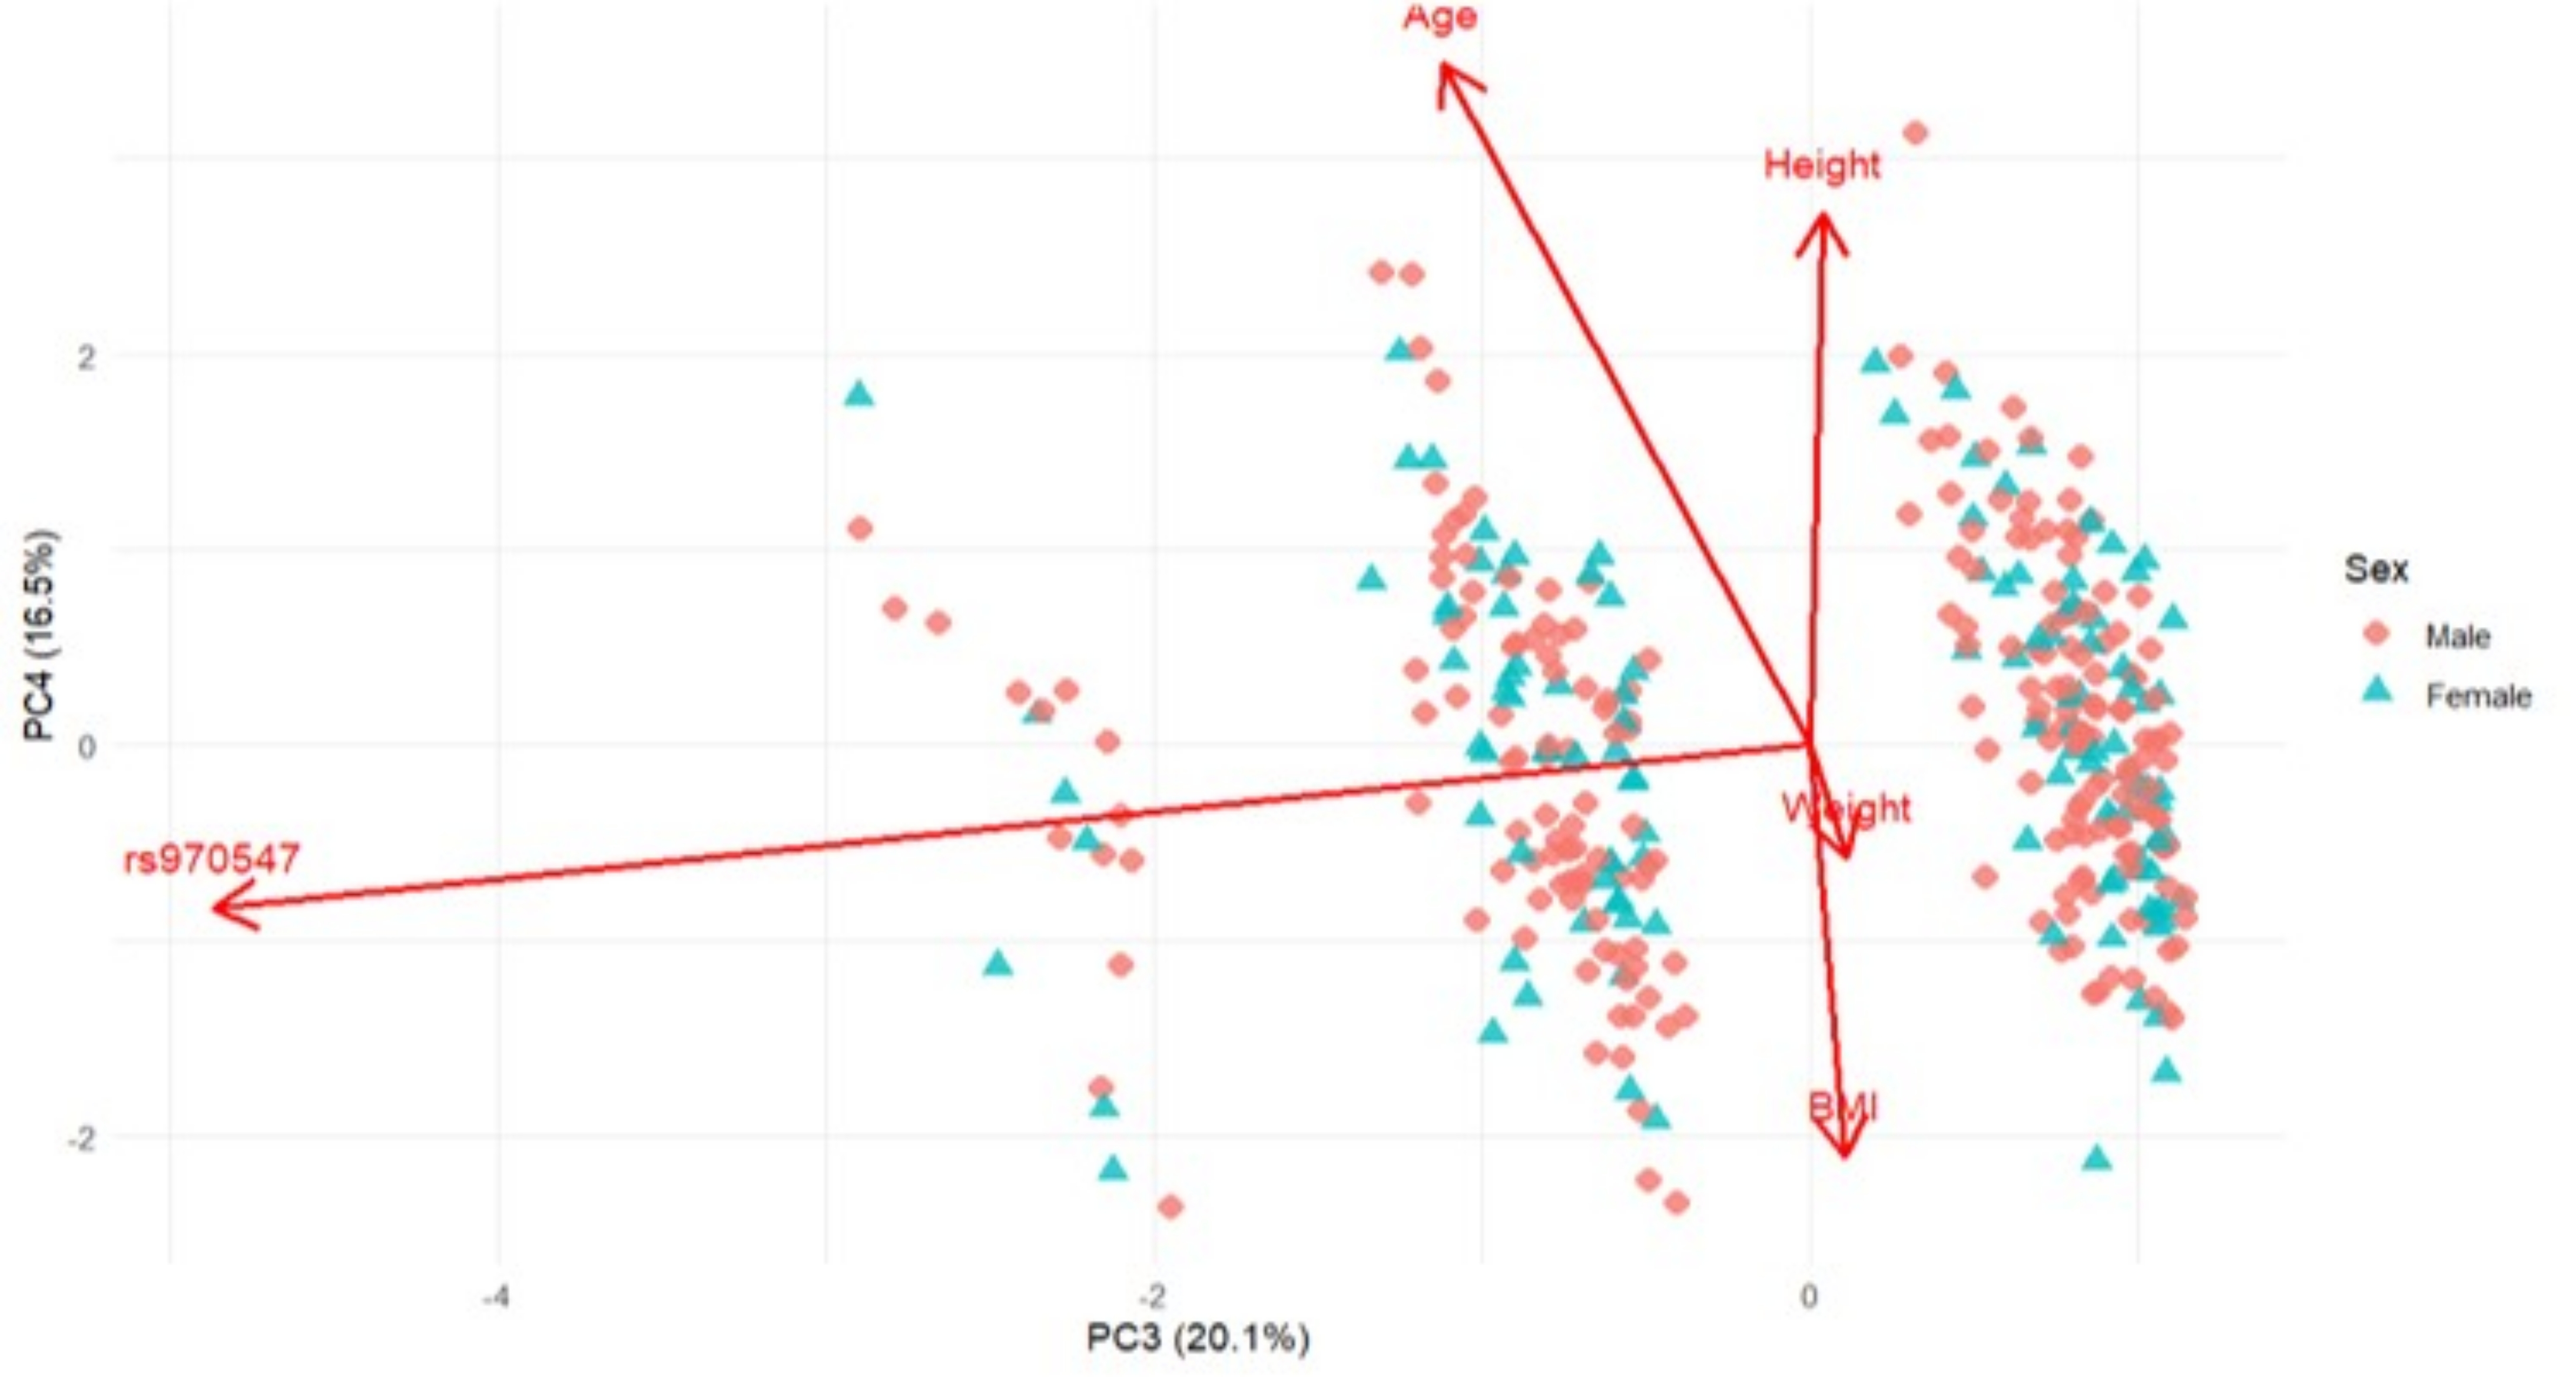
Figure 5 Principal Component Analysis (PCA) biplot presenting PC3 and PC4 based on sex-standardised anthropometric variables (Age, Height, Weight, BMI) and genotype (COL12A1 rs970547 C>T) for the Australian cohort. Arrows indicate variable loadings, showing the direction and magnitude of each variable’s contribution to the principal components. Shown are individuals stratified by sex, males in red diamonds, and females in blue triangles. PC3 and PC4 explain 20.1% and 16.5% of the total variance, respectively.
Figure 6 Principal Component Analysis (PCA) biplot presenting PC1 and PC2 based on sex-standardised anthropometric variables (Age, Height, Weight, BMI) and genotype (COL12A1 rs970547 C>T)in the South African cohort. Arrows indicate variable loadings, showing the direction and magnitude of the contribution of each variable to the principal components. Shown are individuals stratified by sex, males in red diamonds, and females in blue triangles. PC1 and PC2 explain 39.4% and 23.9% of the total variance for the South African cohort, respectively.
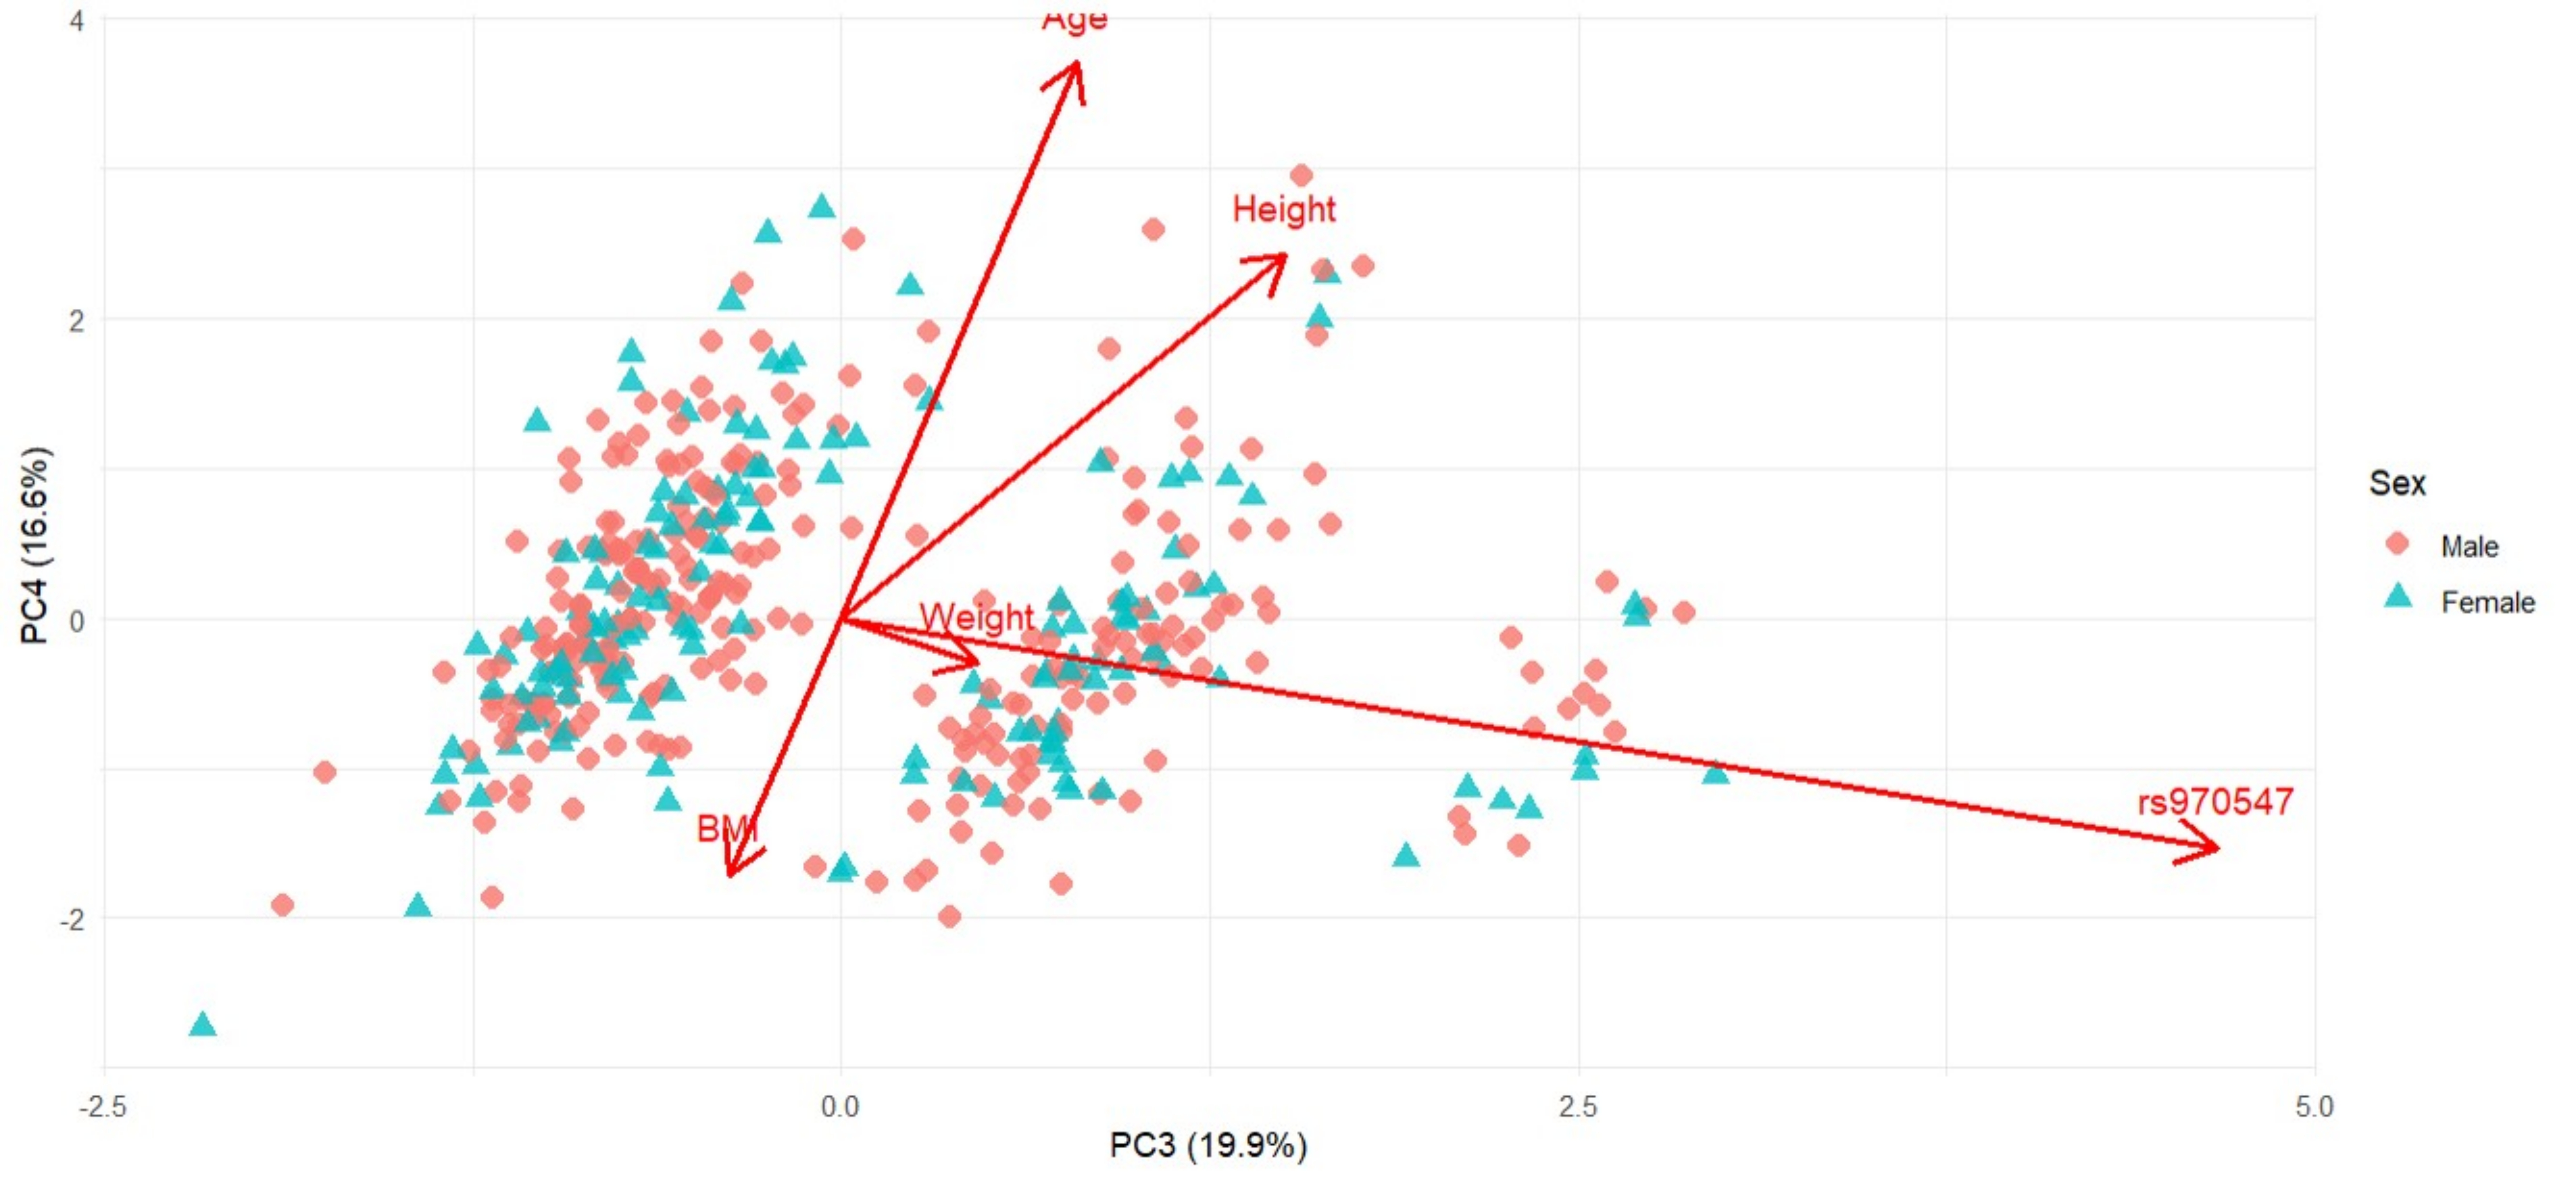
PC3, on the other hand (20.1% and 23.9%) was exclusively driven by the COL12A1 rs970547 C>T genotype with strong but opposing loadings for each cohort seen in Figure 5 (Australia: -0.974) and Figure 7 (South Africa: 0.933). This finding suggests that while genotypes do not associate directly with anthropometric traits in a linear fashion, it does introduce an independent axis of variability. This separation implies genotype-defined clustering and possibly that the gene-environment influence is different in the two cohorts. The absence of significant loadings from anthropometric traits on this component further emphasised that the genetic variation captured by PC3 is distinct from physical traits such as body size or age.
Figure 7 Principal Component Analysis (PCA) biplot presenting PC3 and PC4 based on sex-standardised anthropometric variables (Age, Height, Weight, BMI) and genotype (COL12A1 rs970547 C>T) for the South African cohort. Arrows indicate variable loadings, showing the direction and magnitude of each variable’s contribution to the principal components. Shown are individuals stratified by sex, males in red diamonds, and females in blue triangles. PC1 and PC2 explain 19.9% and 16.6% of the total variance, respectively.
Discussion
Overview of Key Findings
This study investigated the combined role of anthropometric traits and the COL12A1 rs970547 C>T polymorphism with ACL-R risk within an Australian and South African cohort. After correcting for cohort substructure, sex-standardised comparisons of anthropometric traits between ACL-injured and control groups revealed no significant differences, except for age. However, after adjusting for age, the genotype effects remained non-significant, and logistic regression analyses did not show any significant associations with ACL-R risk. While no significant associations were noted between the COL12A1 rs970547 C>T polymorphism and anthropometric traits, principal component analysis (PCA) conducted on sex-standardised data revealed distinct clustering patterns, suggesting that a multivariate framework may capture underlying cumulative effects of the anthropometric and genetic traits. The results of this study did not support the a priori hypothesis that the T/T genotype would be associated with ACL-R risk in the cohorts. Furthermore, these findings highlighted the complex polygenic nature of ACL-R injury susceptibility and, in particular, the influence of gene-environmental considerations on risk.
Cohort Heterogeneity
Initial analyses revealed a non-normal distribution of age, height, weight, BMI, and sex across most of the groups (CON, ACL-R, and NON-subgroups), and therefore, non-parametric group comparisons were applied. Median (IQR) statistics demonstrated significant differences in these anthropometric traits across CON, ACL-R and the NON-subgroups, within Australia and South Africa. However, the absence of female controls in the Australian cohort introduced a significant sex imbalance, which added inadequacies to the cohort comparisons. It is well established that males and females differ in anthropometric traits, in particular, height, weight, BMI, and muscle composition, differences that are most pronounced in athletics and sports-orientation populations (Carter-Thuillier et al. 2019). To address the imbalance, anthropometric traits were therefore standardised using z-scores, after which age remained a significant factor within both the Australian and South African cohorts. Consistent with previous findings, which suggested that younger athletes are at increased risk for ACL-R injuries largely due to high-volume training programs, which increase the likelihood of sustaining injury, a secondary event, as well as impaired recovery (Wiggins et al. 2016). It is also important to note that South African ACL-R male participants weighed more than their control counterparts, which is consistent with the literature (Nakase et al. 2020). This discrepancy reflects the sex-oriented anatomical differences within the mixed-gender groups, but could also be influenced by height differences, as ACL-R participants were shorter, which could account for their lower weight/BMI.
Genetic Heterogeneity of the Australian and South African Cohorts
Exploration of the relationship between anthropometric traits and the COL12A1 rs970547 C>T polymorphism within the Australian and South African cohorts revealed no significant differences. The finding proposes that COL12A1 does not influence height, weight or BMI, which aligns with the gene’s primary role, which is in ligament strength and resilience, rather than the physical characteristics such as body size (Izu and Birk 2023).
The genotype and allele frequency distribution analyses for the COL12A1 rs970547 C>T polymorphism revealed no significant differences among the CON, ACL-R, and the NON-subgroups in either the Australian or South African cohorts. Moreover, the lack of association remained after sex-adjustments and when only males or only females were compared. The findings, therefore, did not support the a priori hypothesis that the T/T genotype was associated with an increased ACL-R risk in either population, nor do they align with the findings of previous studies (Posthumus et al. 2010; Zhao et al. 2020; Ginevičienė and Urnikytė 2022). It is, however, important to note that there were differences in the (i) ancestral backgrounds, (ii) the physical activity exposure levels, iii) the study sample sizes and (iii) the sex distribution of the participants between our cohorts and the previous published studies (Posthumus et al. 2010; Zhao et al. 2020; Ginevičienė and Urnikytė 2022). For example, these studies were conducted in male-dominated groups of both elite and non-elite athletes, with Chinese and Lithuanian ancestry (Ginevičienė and Urnikytė 2022; Zhao et al. 2020). In comparison to the previous work presented by Posthumus et al. (Posthumus et al. 2010), our dataset included additional samples, and this highlights why sample size is important. It is also important to evaluate genetic loci in diverse populations when attempting to identify biologically relevant susceptibility loci (September et al. 2009; September et al. 2011). Susceptibility is non-linear and is driven by the net effect between several genetic and non-genetic factors, each having a different effect size potentially (Bittencourt et al. 2016). It is therefore reasonable to propose that recruitment strategies can also differ across studies and therefore, can introduce unknown biases (Neupane et al. 2012). Not understanding the effects of these subtle nuances in study designs can compound the ability to compare genetic association findings across the studies exploring complex phenotypes such as ACL-R which highlights the importance of well-powered designs.
It remains interesting to note, that there were more TT carriers in both the Australian and South African cohorts compared to the global populations. It was also noted that the C allele is the ancestral allele, but the T allele is the most frequently observed across the global populations (Ensemble.org). Furthermore, the whole genome sequencing analyses presented by Feldmann et al. (Feldmann et al. 2022) also highlighted the segregation of the TT genotype in all nine cases of the two families who presented with twins who had ruptured their ACL. Collectively, these observations point towards a potential biological significance of this SNP on ACL risk susceptibility.
Dimensional Reduction and Trait-Linked Genotypic Patterns
The PCA revealed some interesting findings with the anthropometric traits, specifically weight, BMI, height and age being the primary contributors to variance within the first and second components. This aligns with previous research indicating that these traits can influence loading patterns and the biomechanical properties of ligaments and tendons (Bowers et al. 2005; Etzel et al. 2024). In particular, the evidence suggests that the combination of greater weight/BMI, increased knee compressive force, and greater lateral posterior tibial slope may therefore compound ACL strain and hereby increase ACL-R injury (Evans et al. 2011; Bojicic et al. 2017; Kızılgöz et al. 2019). Furthermore, emerging data reports that older males who have reached their adult height may face an increased mechanical risk linked to a tendency towards riskier landing profiles, further contributing to ACL-R risk (Steffensmeier et al. 2020).
It is noteworthy that the third principal component was exclusively driven by the COL12A1 rs970547 C>T polymorphism, contributing to variance in opposing directions between the Australian and South African cohorts. The unique genotype–phenotype clustering observed between the cohorts suggests the presence of an underlying population structure and potential ancestral divergence. This aligns with studies showing that certain SNPs act as population-structure informative markers, which may indicate differences in haplotypes, linkage disequilibrium, or gene–environment interactions (Paschou et al. 2007). Such opposing loadings indicate that the SNP’s effect is context-dependent and can vary across populations. Importantly, the PCA captured these patterns without prior knowledge of ancestry, highlighting that rs970547 may contribute to ACL-R risk differently in each cohort and underscoring the need to account for ancestry in genetic association analyses (Tian et al. 2008). These results support our study by showing that anthropometric traits and the COL12A1 rs970547 polymorphism each contribute to differences between the cohorts. This emphasises that genetic effects can depend on context and that multivariate analyses can assist in understanding the combined effects of the traits being measured on ACL-R risk.
Although no independent association was observed for COL12A1, current perspectives on polygenic traits and complex disorders suggest that multiple genetic contributors act in concert (Bittencourt et al. 2016). Moreover, evidence supporting the role of COL12A1 rs970547 is reflected in the bioinformatic exploration of rs970547 and its potential to impact protein function, as predicted from the in silico algorithms (e.g. SIFT) which classify the variant as possibly damaging or deleterious to protein structure or activity (ensembl.org). It is therefore plausible that the role of COL12A1 may become more apparent when examined in combination with other key loci, such as COL5A1 and COL1A1, within a broader polygenic or pathway-based framework (Ahmetov et al. 2022; Kaynak et al. 2017; Rahim et al. 2022). We also recognise that biomechanical, hormonal, and neuromuscular factors are important mediators of gene–environment interactions in ACL-R injury susceptibility. Future work should therefore also document all potential risk factors (population-specific, biological and environmental) towards identifying emerging patterns of interactions between determinants of injury risk (Bittencourt et al. 2016). These recognition patterns have the potential to shape strategies to reduce risk and inform therapeutic interventions.
Limitations and Future Directions
Despite these findings, several limitations of the study should be considered. The primary limitation of this study was the relatively small sample size, particularly within certain genotype groups, which may have reduced statistical power to detect associations between the COL12A1 rs970547 C>T polymorphism and anthropometric characteristics. Additionally, the study only considered one genetic variant within COL12A1 as part of an a priori hypothesis, and there may be other genetic factors within this gene influencing ACL-R injury susceptibility. For this reason, no correction was applied for multiple testing. We accounted for sex differences between groups because the Australian cohort was biased towards males; however, the imbalance may still obscure sex-specific effects of COL12A1 and other contributing variables. In addition, given the well-established anatomical, hormonal, and neuromuscular differences between males and females with ACL-R injury risk, future studies must implement sex-stratified analytical models and ensure more balanced sex representation. Such approaches will help uncover potentially masked genetic associations, particularly when the effect sizes are small. We emphasised this point in light of mounting evidence supporting sex-specific genetic and biomechanical contributions to ACL-R susceptibility, which reinforces the biological rationale for stratified genetic investigations (Wiggins et al. 2016; Mancino et al. 2024; Chia et al. 2022). Differences in anthropometric features between the two populations were also noted, likely reflecting expected random variation, especially in small cohorts. Furthermore, the study did not consider the role of physical activity or sports participation in shaping anthropometric characteristics, both of which can significantly influence ACL-R injury risk (Chia et al. 2022). Future studies should examine larger cohorts with a broader range of genetic markers and explore their interactions with environmental and lifestyle factors. Incorporating these factors into future research will provide a more comprehensive understanding of how genetics and lifestyle contribute to injury outcomes.
Conclusion
In conclusion, consistent with previous findings, this study found no significant association between COL12A1 rs970547 and ACL-R injury in Australian and South African cohorts, suggesting that genetic or anthropometric factors alone are insufficient to explain ACL-R risk. However, the distinct separation of the genetic factor from anthropometric traits in the PCA highlights the complex, multidimensional nature of injury susceptibility. These findings emphasise the importance of multivariate analyses and polygenic frameworks in future studies aiming to elucidate the genetic architecture of ACL-R risk across diverse populations.
Funding
This work was supported through funding by the South African Medical Research Council through its Division of Research Capacity Development under the Mid-Career Scientist Programme, from funding received from the South African National Treasury. The opinions and conclusions summarized in the study are those of the author/s and does not necessarily reflect the opinions of the funders. The authors have no other relevant affiliations or financial involvement with any organization or entity with a financial interest in or financial conflict with the subject matter or materials discussed in the manuscript apart from those disclosed. Participating at the summer school was funded by KoUP and SA-MRC.
Appendix
Supplementary Figures
Figure 8 Box plots showing anthropometric distribution across the COL12A1 rs970547 C/C, C/T, and T/T genotypes stratified by sex for the Australian cohort. Shown is the interquartile range (IQR: Q1–Q3) with the median line for A) Age yrs), B) Height (cm), C ) Weight (kg) and D) BMI. Kruskal-Wallis tests were applied (p-value) with significance accepted at p < 0.05 (as seen in bold). Effect sizes were calculated for group comparisons and interpreted as epsilon squared (epsilon squared) for non-parametric tests, where epsilon squared smaller than 0.01 is negligible, 0.01–0.04 weak, 0.04–0.16 moderate, 0.16–0.36 relatively strong, and > 0.36 very strong.
Figure 9 Box plots showing anthropometric distribution across the COL12A1 rs970547 C/C, C/T, and T/T genotypes stratified by sex for the South African cohort. Shown is the interquartile range (IQR: Q1–Q3) with the median line for A) Age yrs), B) Height (cm), C ) Weight (kg) and D) BMI. Kruskal-Wallis tests were applied (p-value) with significance accepted at p < 0.05 (as seen in bold). Effect sizes were calculated for group comparisons and interpreted as epsilon squared (epsilon squared) for non-parametric tests, where epsilon squared smaller than 0.01 is negligible, 0.01–0.04 weak, 0.04–0.16 moderate, 0.16–0.36 relatively strong, and > 0.36 very strong.
Supplementary Tables
Table 1 Sample size and power calculations for the detection of genotype-phenotype associations in ACL-R risk across Australian and South African cohorts
Odd Ratio
0,5
1
1,5
2
2,5
Models
Sample size (N) Required at 80% power
Dominant
133
*
386
134
78
Recessive
450
*
1392
504
305
Log additive
86
*
248
90
55
Power (%)
Australia n = 287 ACL-R
Dominant
98.1
*
67.7
98.4
100
cases (1 control per case)
Recessive
49.0
*
29.1
71.4
93.2
Log additive
99.8
*
88.9
100
100
South Africa n = 249 ACL-R
Dominant
97
*
61.5
96.9
99.9
cases (1 control per case)
Recessive
54.9
*
22
50.4
71.7
Log additive
99.8
*
80.2
99.7
100
*OR of 1.00: does not compute
Table 2 Summary of normality testing for anthropometric data: Shapiro-Wilk test statistics for age, height, weight and BMI in the Australian and South African cohorts between control (CON) and anterior cruciate ligament rupture (ACL-R) and NON-subgroups (NON)
Australia
CON (n = 84)
ACL-R (n = 287)
NON (n = 165)
Age (yrs)
0.002
<0.001
<0.001
Height (cm)
0.065
0.048
0.012
Weight (kg)
0.116
<0.001
0.001
BMI (kg/m2)
0.012
<0.001
<0.001
South Africa
CON (n = 232)
ACL-R (n = 252)
NON (n = 164)
Age (yrs)
<0.001
<0.001
<0.001
Height (cm)
0.478
0.001
0.007
Weight (kg)
<0.001
0.031
0.057
BMI (kg/m2)
<0.001
<0.001
<0.001
Table 3 Comparative analyses of anthropometric traits between control (CON) and anterior cruciate ligament rupture (ACL-R) and NON-subgroups, stratified by sex, for i) Australia (AUS), ii) South Africa (SA), and iii) the combined (AUS+SA) cohorts
CON
ACL-R
p
Adjusted p*
r
NON-subgroup
p
Adjusted p*
r
Australian Males
n = 84
n = 155
n = 81
Age (yrs)
30.6 (25.0 – 38.2)
25.4 (18.6 – 29.3)
<0.001
<0.001
0.32
26.4 (19.9 – 29.1)
<0.001
<0.001
0.31
Height (cm)
179.0 (175.0 – 184.0)
182.0 (177.0 –186.0)
0.049
0.196
0.13
182.0 (178.0 – 187.0)
0.017
0.068
0.19
Weight (kg)
80.1 (73.2 – 90.2)
83.0 (76.0 – 90.6)
0.101
0.404
0.11
84.0 (78.0 – 92.5)
0.042
0.168
0.16
BMI (kg/m2)
24.6 (23.0 – 27.3)
25.1 (23.5 – 27.6)
0.292
1.000
0.07
25.5 (23.7 – 28.0)
0.171
0.684
0.11
Australian Females
n = 0
n = 132
n = 84
Age (yrs)
23.1 (17.6 – 30.6)
23.4 (18.0 – 31.0)
Height (cm)
167.0 (163.0 – 172.0)
168.0 (163.0 – 172.0)
Weight (kg)
67.5 (61.2 – 75.8)
69.0 (61.6 – 75.8)
BMI (kg/m2)
23.9 (22.3 – 26.3)
23.9 (22.6 – 26.3)
South African Males
n = 130
n = 185
n = 116
Age (yrs)
24.0 (22.0 – 33.0)
22.0 (18.0 – 30.0)
0.001
0.004
0.20
23.0 (19.0 – 31.0)
0.012
0.048
0.16
Height (cm)
180.0 (175.0 – 186.0)
182.0 (177.0 – 186.0)
0.210
0.840
0.07
181.0 (178.0 – 186.0)
0.166
0.664
0.09
Weight (kg)
78.2 (73.0 – 87.2)
84.5 (78.0 – 93.0)
<0.001
<0.001
0.22
85.0 (78.0 – 92.0)
0.001
0.004
0.22
BMI (kg/m2)
24.3 (22.9 – 26.0)
25.9 (23.9 – 28.3)
<0.001
<0.001
0.23
25.9 (23.8 – 27.8)
0.001
0.004
0.21
South African Females
n = 102
n = 67
n = 48
Age (yrs)
26.0 (23.0 – 35.0)
24.0 (18.0 – 38.0)
0.028
0.112
0.17
24.0 (18.5 – 39.5)
0.079
0.316
0.15
Height (cm)
166.0 (163.0 – 171.0)
166.0 (162.0 – 170.0)
0.984
1.000
0.00
166.0 (162.0 – 170.0)
0.770
1.000
0.02
Weight (kg)
62.0 (57.0 – 68.7)
61.5 (56.7 – 69.0)
0.883
1.000
0.01
60.0 (56.0 – 68.0)
0.420
1.000
0.07
BMI (kg/m2)
22.3 (21.0 – 24.0)
22.1 (20.5 – 24.3)
0.982
1.000
0.00
22.0 (20.2 – 24.4)
0.590
1.000
0.05
Data presented as Median (IQR) or mean ± standard deviation or frequency % (n), where n is the total male and female participants per group. P-values are unadjusted, and values in bold indicate significance (p < 0.05). Tests used for comparative analysis include Wilcoxon rank-sum/Mann-Whitney U test (independent sample t-test), and the Wilcoxon R statistic representing the sum of the ranks of the differences between paired observations in the Wilcoxon signed-rank test. Non-parametric effect size, thresholds for r are as follows: r > 0.3 is medium, and r > 0.5 is large
Table 4 Comparative analyses of sex-standardised anthropometric traits between control (CON) and anterior cruciate ligament rupture (ACL-R) and NON-subgroups within the Australian and South African cohorts
Variable
W-Stata
p-valueb
Adjusted pb
rc
Australia-CON vs ACL-R
Age (yrs)
7889.5
<0.001
<0.001
-0.22
Height (cm)
13578.5
0.069
0.277
0.09
Weight (kg)
13224.5
0.160
0.639
0.07
BMI (kg/m2)
12758.0
0.387
1.000
0.04
Australia-CON vs NON
Age (yrs)
8937.5
<0.001
<0.001
0.25
Height (cm)
5606.5
0.017
0.066
-0.15
Weight (kg)
5843.5
0.051
0.203
-0.12
BMI (kg/m2)
6243.0
0.228
0.912
-0.08
South Africa-CON vs ACL-R
Age (yrs)
20 093.5
<0.001
<0.001
-0.18
Height (cm)
27 161.5
0.316
1.000
0.05
Weight (kg)
29 458.0
0.004
0.014
0.13
BMI (kg/m2)
28 624.5
0.002
0.007
0.14
South Africa -CON vs NON
Age (yrs)
21 166.0
0.003
0.014
0.15
Height (cm)
16 737.0
0.316
1.000
-0.05
Weight (kg)
15 320.0
0.032
0.128
-0.11
BMI (kg/m2)
14 575.5
0.025
0.101
-0.11
a W-stat: Wilcoxon rank-sum statistic.
b W p / W p adj: Corresponding (W) unadjusted and Bonferroni-adjusted p-values.
c r (effect size): non-parametric effect size, where r > 0.3 is medium, and r > 0.5 is large.
Table 5 Genotype frequency distribution patterns of the COL12A1 rs970547 C>T Single Nucleotide Polymorphism, in the Australian and South African cohorts across different anthropometric traits
AUS
C/C
C/T
T/T
p-value
Sex-standardised p
Bonferroni
epsilon squared slash w
95% CI
Age (yrs)
22.7 (17.5 – 26.3)
26.8 (19.0 – 32.0)
25.9 (19.2 – 30.9)
0.466
0.476
1.000
0.00
Height (cm)
179.0 (174.0 – 186.0)
175.0 (170.0 – 183.0)
177.0 (170.0 – 182.0)
0.426
0.330
1.000
0.00
Weight (kg)
82.4 (68.3 – 85.8)
77.8 (67.6 – 85.8)
77.7 (69.3 – 87.0)
0.656
0.641
1.000
0.00
BMI (kg/m2)
24.2 (22.6 – 27.4)
24.2 (22.8 – 27.2)
25.0 (23.0 – 27.2)
0.546
0.548
1.000
0.00
Males
4.1 (14)
25.2 (87)
35.7 (123)
0.950
0.02
0.0 / 1.00
Females
2.0 (7)
14.2 (49)
18.8 (65)
SA
C/C
C/T
T/T
p-value
epsilon squared slash w
95% CI
Age (yrs)
24.5 (19.5 – 31.5)
24.0 (22.0 – 33.5)
23.0 (21.0 – 34.0)
0.575
0.557
1.000
0.00
Height (cm)
176.0 (169.0 – 182.0)
175.0 (168.0 – 184.0)
177.0 (169.0 – 183.0)
0.710
0.534
1.000
0.00
Weight (kg)
73.0 (68.3 – 82.3)
75.0 (66.0 – 85.0)
77.0 (65.0 – 87.0)
0.493
0.267
1.000
0.001
BMI (kg/m2)
23.4 (21.7 – 26.3)
23.8 (22.3 – 26.5)
24.4 (22.2 – 26.8)
0.348
0.169
0.674
0.003
Males
2.9 (14)
22.1 (106)
40.0 (192)
0.546
0.05
0.00 / 1.00
Females
2.3 (11)
10.8 (52)
21.9 (105)
Data are presented as Median (IQR), mean ± standard deviation, or frequency % (n), where n is the number of male and female participants per genotype group. P-values are unadjusted (Kruskal–Wallis test for non-parametric group comparisons), with an additional column reporting sex-adjusted p-values from linear regression models to address potential confounding. Values in bold indicate significance (p less than 0.05). Effect sizes were calculated for group comparisons and interpreted as:(i) Cohen’s w for chi-square tests, where w > 0.3 indicates a medium effect and w > 0.5 a large effect (with 95% confidence intervals); and (ii) epsilon squared (epsilon squared) for non-parametric tests, where epsilon squared less than 0.01 is negligible, 0.01–0.04 weak, 0.04–0.16 moderate, 0.16–0.36 relatively strong, and > 0.36 very strong.
Table 6 Genotype and minor allele frequency distributions of the COL12A1 rs970547 C>T polymorphism between control (CON) and anterior cruciate ligament rupture (ACL-R) participants within the Australian and South African cohorts
CON
ACL-R
p-value
Adjusted p*
OR (95% CI)
NON
p-value
Adjusted p*
OR (95% CI)
AUS
n = 82
n = 263
(Age / Sex)
n = 148
(Age / Sex)
T/T
58.5 (48)
53.2 (140)
0.218
0.183 / 0.151
1 (0 – 0)
55.4 (82)
0.649
0.504 / 0.152
1 (0 – 0)
C/T
39.0 (32)
39.5 (104)
0.90 (0.54 – 1.50)
39.9 (59)
1.08 (0.62 – 1.89)
C/C
2.4 (2)
7.2 (19)
0.31 (0.07 – 1.37)
4.7 (7)
2.05 (0.41 – 10.26)
C allele
22.0 (36)
27.0 (142)
0.235
24.7 (73)
0.589
HWE
0.334
0.887
0.507
SA
n = 231
n = 249
n = 163
T/T
58.9 (136)
64.7 (161)
0.187
0.121 / 0.128
1 (0 – 0)
65.6 (107)
0.077
0.652 / 0.062
1 (0 – 0)
C/T
36.8 (85)
29.3 (73)
1.38 (0.94 – 2.03)
27 (44)
0.66 (0.42 – 1.03)
C/C
4.3 (10)
6 (15)
0.79 (0.34 – 1.81)
7.4 (12)
1.53 (0.63 – 3.66)
C allele
22.7 (105)
20.7 (103)
0.490
20.9 (68)
1.000
HWE
0.575
0.119
0.030
*Age and Sex-adjusted p-value
Table 7 Hardy Weinberg Equilibrium (HWE) scores for COL12A1 rs970547 C>T in the Australian and South African cohorts
Cohort
Combined
CON
ACL-R
NON-Subgroup
Australia
0.794
0.334
0.887
0.507
South Africa
0.502
0.575
0.119
0.030
Australia and South Africa
0.779
0.258
0.250
0.333
Table 8 Sex-standardised principal component analysis of variables within the collective Australian and South African cohorts (controls and cases)
Importance of Variance
PC1
PC2
PC3
PC4
PC5
PC1
PC2
PC3
PC4
PC5
Australia
South Africa
Eigenvalue
2.077
1.079
1.000
0.825
0.005
1.968
1.192
0.993
0.828
0.007
Standard deviation
1.441
1.039
1.000
0.908
0.068
1.403
1.092
0.997
0.91
0.086
% of Variance
41.7
21.6
20.1
16.6
0.1
39.5
23.9
19.9
16.6
0.2
Cumulative %
41.7
63.3
83.4
99.9
100
39.5
63.3
83.3
99.9
100
Component Matrix
Age (yrs)
-0.214
0.646
-0.224
0.698
-0.005
0.120
-0.64
0.16
0.742
0.001
Height (cm)
-0.336
-0.693
0.008
0.543
0.334
0.272
0.689
0.301
0.486
0.353
Weight (kg)
-0.684
-0.101
0.022
-0.115
-0.713
0.704
0.082
0.092
-0.061
-0.697
BMI (kg/m2)
-0.610
0.264
0.021
-0.421
0.617
0.633
-0.295
-0.075
-0.342
0.624
COL12A1rs970547 C>T
0.018
-0.151
-0.974
-0.167
0.001
-0.126
-0.144
0.933
-0.306
0.005
Bold numbers indicate high (positive and negative) loadings
Acknowledgements
The author would like to thank Prof. Barry Bogin for his counselling and guidance during our time at the 7th International Summer School, University of Potsdam (Gülpe, Germany). The authors would also like to extend thanks to all the other participants at the workshop.
References
Ahmetov, I. I./Hall, E. C. R./Semenova, E. A./Pranckevičienė, E./Ginevičienė, V. (2022). Advances in sports genomics. Advances in Clinical Chemistry 107, 215–263. https://doi.org/10.1016/bs.acc.2021.07.004.
Alsayed, H. N./Alkhateeb, M. A./Aldossary, A. A./Houbani, K. M./Aljamaan, Y. M./Alrashidi, Y. A. (2023). Risk of anterior cruciate ligament injury in population with elevated body mass index. Medicinski Glasnik 20 (1), 83–87. https://doi.org/10.17392/1517-22.
Alvarez-Romero, J./Laguette, M.-J. N./Seale, K./Jacques, M./Voisin, S./Hiam, D./Feller, J. A./Tirosh, O./Miyamoto-Mikami, E./Kumagai, H./Kikuchi, N./Kamiya, N./Fuku, N./Collins, M./September, A. V./Eynon, N. (2021). Genetic variants within the COL5A1 gene are associated with ligament injuries in physically active populations from Australia, South Africa, and Japan. European Journal of Sport Science 23 (2), 284–293. https://doi.org/10.1080/17461391.2021.2011426.
Beckley, S./Dey, R./Stinton, S./van der Merwe, W./Branch, T./September, A. V./Posthumus, M./Collins, M. (2022). Investigating the association between COL1A1 and COL3A1 gene variants and knee joint laxity and ligament measurements. Clinical Biomechanics 100, 105822. https://doi.org/10.1016/j.clinbiomech.2022.105822.
Belkhelladi, M./Cierson, T./Martineau, P. A. (2025). Biomechanical Risk Factors for Increased Anterior Cruciate Ligament Loading and Injury: A Systematic Review. Orthopaedic Journal of Sports Medicine 13 (2). https://doi.org/10.1177/23259671241312681.
Belozo, F. L./Belozo, R. S. M. N./Lopes, C. R./Yamada, A. K./Silva, V. R. R. (2024). Anterior cruciate ligament: A brief narrative review of main risk factors for injury and re-injury. Journal of Bodywork and Movement Therapies 38, 92–99. https://doi.org/10.1016/j.jbmt.2024.01.022.
Bittencourt, N. F. N./Meeuwisse, W. H./Mendonça, L. D./Nettel-Aguirre, A./Ocarino, J. M./Fonseca, S. T. (2016). Complex systems approach for sports injuries: moving from risk factor identification to injury pattern recognition-narrative review and new concept. British Journal of Sports Medicine 50 (21), 1309–1314. https://doi.org/10.1136/bjsports-2015-095850.
Bojicic, K. M./Beaulieu, M. L./Imaizumi Krieger, D. Y./Ashton-Miller, J. A./Wojtys, E. M. (2017). Association Between Lateral Posterior Tibial Slope, Body Mass Index, and ACL Injury Risk. Orthopaedic Journal of Sports Medicine 5 (2). https://doi.org/10.1177/2325967116688664.
Borzemska, B./Cięszczyk, P./Żekanowski, C. (2024). The Genetic Basis of Non-Contact Soft Tissue Injuries-Are There Practical Applications of Genetic Knowledge? Cells 13 (22). https://doi.org/10.3390/cells13221828.
Bowers, A. L./Spindler, K. P./McCarty, E. C./Arrigain, S. (2005). Height, weight, and BMI predict intra-articular injuries observed during ACL reconstruction: evaluation of 456 cases from a prospective ACL database. Clinical Journal of Sport Medicine 15 (1), 9–13. https://doi.org/10.1097/00042752-200501000-00003.
Bulbul, A./Ari, E./Apaydin, N./Ipekoglu, G. (2023). The Impact of Genetic Polymorphisms on Anterior Cruciate Ligament Injuries in Athletes: A Meta-Analytical Approach. Biology 12 (12). https://doi.org/10.3390/biology12121526.
Candela, V./Longo, U. G./Berton, A./Salvatore, G./Forriol, F./Sire, A. de/Denaro, V. (2024). Genome-Wide Association Screens for Anterior Cruciate Ligament Tears. Journal of Clinical Medicine 13 (8). https://doi.org/10.3390/jcm13082330.
Carter-Thuillier, B./Ramírez-Campillo, R./Serra-Olivares, J./Gallardo, F./Cresp, M./Ojeda Nahuelcura, R./Álvarez, C./Martínez, C./Cañas-Jamett, R. (2019). Anthropometric Characteristics of Female and Male Athletes Bear A Different Effect on Fitness. Asian Journal of Sports Medicine 10 (2). https://doi.org/10.5812/asjsm.66164.
Chia, L./Oliveira Silva, D. de/Whalan, M./McKay, M. J./Sullivan, J./Fuller, C. W./Pappas, E. (2022). Non-contact Anterior Cruciate Ligament Injury Epidemiology in Team-Ball Sports: A Systematic Review with Meta-analysis by Sex, Age, Sport, Participation Level, and Exposure Type. Sports Medicine 52 (10), 2447–2467. https://doi.org/10.1007/s40279-022-01697-w.
Chiquet, M./Birk, D. E./Bönnemann, C. G./Koch, M. (2014). Collagen XII: Protecting bone and muscle integrity by organizing collagen fibrils. The International Journal of Biochemistry & Cell Biology 53, 51–54. https://doi.org/10.1016/j.biocel.2014.04.020.
Dlamini, S. B./Saunders, C. J./Laguette, M.-J. N./Gibbon, A./Gamieldien, J./Collins, M./September, A. V. (2023). Application of an in silico approach identifies a genetic locus within ITGB2, and its interactions with HSPG2 and FGF9, to be associated with anterior cruciate ligament rupture risk. European Journal of Sport Science 23 (10), 2098–2108. https://doi.org/10.1080/17461391.2023.2171906.
Domnick, C./Raschke, M. J./Herbort, M. (2016). Biomechanics of the anterior cruciate ligament: Physiology, rupture and reconstruction techniques. World Journal of Orthopedics 7 (2), 82–93. https://doi.org/10.5312/wjo.v7.i2.82.
Etzel, C. M./Meghani, O./Owens, B. D./Kocher, M. S./Field, A. E. (2024). Predictors of Anterior Cruciate Ligament Tears in Adolescents and Young Adults. Orthopaedic Journal of Sports Medicine 12 (9). https://doi.org/10.1177/23259671241272699.
Evans, J./Mabrouk, A./Nielson, J. l. (2025). Anterior Cruciate Ligament Knee Injury. Treasure Island (FL).
Evans, K. N./Kilcoyne, K. G./Dickens, J. F./Rue, J.-P./Giuliani, J./Gwinn, D./Wilckens, J. H. (2011). Predisposing risk factors for non-contact ACL injuries in military subjects. Knee Surgery, Sports Traumatology, Arthroscopy 20 (8), 1554–1559. https://doi.org/10.1007/s00167-011-1755-y.
Feldmann, D. C./Rahim, M./Suijkerbuijk, M. A. M./Laguette, M.-J. N./Cieszczyk, P./Ficek, K./Huminska-Lisowska, K./Häger, C. K./Stattin, E./Nilsson, K. G./Alvarez-Rumero, J./Eynon, N./Feller, J./Tirosh, O./Posthumus, M./Chimusa, E. R./Collins, M./September, A. V. (2021). Investigation of multiple populations highlight VEGFA polymorphisms to modulate anterior cruciate ligament injury. Journal of Orthopaedic Research 40 (7), 1604–1612. https://doi.org/10.1002/jor.25192.
Feldmann, D./Bope, C. D./Patricios, J./Chimusa, E. R./Collins, M./September, A. V. (2022). A whole genome sequencing approach to anterior cruciate ligament rupture-a twin study in two unrelated families. Public Library of Science One 17 (10), e0274354. https://doi.org/10.1371/journal.pone.0274354.
Filbay, S. R./Skou, S. T./Bullock, G. S./Le, C. Y./Räisänen, A. M./Toomey, C./Ezzat, A. M./Hayden, A./Culvenor, A. G./Whittaker, J. L./Roos, E. M./Crossley, K. M./Juhl, C. B./Emery, C. (2022). Long-term quality of life, work limitation, physical activity, economic cost and disease burden following ACL and meniscal injury: a systematic review and meta-analysis for the OPTIKNEE consensus. British Journal of Sports Medicine 56 (24), 1465–1474. https://doi.org/10.1136/bjsports-2022-105626.
Firfirey, F./September, A. V./Shamley, D. (2022). ABCB1 and OPRM1 single-nucleotide polymorphisms collectively modulate chronic shoulder pain and dysfunction in South African breast cancer survivors. Pharmacogenomics 23 (9), 513–530. https://doi.org/10.2217/pgs-2022-0020.
Fujie, H. (2016). Mechanical Properties and Biomechanical Function of the ACL. In: Mitsuo Ochi/Konsei Shino/Kazunori Yasuda et al. (Eds.). ACL Injury and Its Treatment. Tokyo, Springer Japan, 69–77.
González, J. R./Armengol, L./Solé, X./Guinó, E./Mercader, J. M./Estivill, X./Moreno, V. (2007). SNPassoc: an R package to perform whole genome association studies. Bioinformatics 23 (5), 644–645. https://doi.org/10.1093/bioinformatics/btm025.
Hewett, T. E./Lynch, T. R./Myer, G. D./Ford, K. R./Gwin, R. C./Heidt, R. S. (2010). Multiple risk factors related to familial predisposition to anterior cruciate ligament injury: fraternal twin sisters with anterior cruciate ligament ruptures. British Journal of Sports Medicine 44 (12), 848–855. https://doi.org/10.1136/bjsm.2008.055798.
Izu, Y./Birk, D. E. (2023). Collagen XII mediated cellular and extracellular mechanisms in development, regeneration, and disease. Frontiers in Cell and Developmental Biology 11. https://doi.org/10.3389/fcell.2023.1129000.
John, R./Prabhakar, S./Dhillon, M. S./Anand, A./Minhas, G. (2016). Association of ACL tears and single nucleotide polymorphisms in the collagen 12 A1 gene in the Indian population - a preliminary case-control study. Muscles, Ligaments and Tendons Journal 6 (2), 253–257. https://doi.org/10.11138/mltj/2016.6.2.253.
Kamatsuki, Y./Qvale, M. S./Steffen, K./Wangensteen, A./Krosshaug, T. (2024). Anatomic Risk Factors for Initial and Secondary Noncontact Anterior Cruciate Ligament Injury: A Prospective Cohort Study in 880 Female Elite Handball and Soccer Players. The American Journal of Sports Medicine 53 (1), 123–131. https://doi.org/10.1177/03635465241292755.
Kaynak, M./Nijman, F./van Meurs, J./Reijman, M./Meuffels, D. E. (2017). Genetic Variants and Anterior Cruciate Ligament Rupture: A Systematic Review. Sports Medicine 47, 1637–1650. https://doi.org/10.1007/s40279-017-0678-2.
Kızılgöz, V./Sivrioğlu, A. K./Aydın, H./Ulusoy, G. R./Çetin, T./Tuncer, K. (2019). The Combined Effect of Body Mass Index and Tibial Slope Angles on Anterior Cruciate Ligament Injury Risk in Male Knees: A Case-Control Study. Clinical Medicine Insights. Arthritis and Musculoskeletal Disorders 12, 1-8. https://doi.org/10.1177/1179544119867922.
Lahiri, D. K./Nurnberger, J. I. (1991). A rapid non-enzymatic method for the preparation of HMW DNA from blood for RFLP studies. Nucleic Acids Research 19 (19), 5444. https://doi.org/10.1093/nar/19.19.5444.
Little, J./Higgins, J. P. T./Ioannidis, J. P. A./Moher, D./Gagnon, F./Elm, E. von/Khoury, M. J./Cohen, B./Davey-Smith, G./Grimshaw, J./Scheet, P./Gwinn, M./Williamson, R. E./Zou, G. Y./Hutchings, K./Johnson, C. Y./Tait, V./Wiens, M./Golding, J./van Duijn, C./McLaughlin, J./Paterson, A./Wells, G./Fortier, I./Freedman, M./Zecevic, M./King, R./Infante-Rivard, C./Stewart, A./Birkett, N. (2009). STrengthening the REporting of Genetic Association Studies (STREGA)--an extension of the STROBE statement. Genetic Epidemiology 33 (7), 581–598. https://doi.org/10.1002/gepi.20410.
Mancino, F./Kayani, B./Gabr, A./Fontalis, A./Plastow, R./Haddad, F. S. (2024). Anterior cruciate ligament injuries in female athletes: risk factors and strategies for prevention. Bone & Joint Open 5 (2), 94–100. https://doi.org/10.1302/2633-1462.52.BJO-2023-0166.
Massidda, M./Flore, L./Scorcu, M./Monteleone, G./Tiloca, A./Salvi, M./Tocco, F./Calò, C. M. (2023). Collagen Gene Variants and Anterior Cruciate Ligament Rupture in Italian Athletes: A Preliminary Report. Genes 14 (7). https://doi.org/10.3390/genes14071418.
Nakase, J./Kitaoka, K./Shima, Y./Oshima, T./Sakurai, G./Tsuchiya, H. (2020). Risk factors for noncontact anterior cruciate ligament injury in female high school basketball and handball players: A prospective 3-year cohort study. Asia-Pacific Journal of Sports Medicine, Arthroscopy, Rehabilitation and Technology 22, 34–38. https://doi.org/10.1016/j.asmart.2020.06.002.
Neupane, B./Loeb, M./Anand, S. S./Beyene, J. (2012). Meta-analysis of genetic association studies under heterogeneity. European Journal of Human Genetics 20 (11), 1174–1181. https://doi.org/10.1038/ejhg.2012.75.
Paschou, P./Ziv, E./Burchard, E. G./Choudhry, S./Rodriguez-Cintron, W./Mahoney, M. W./Drineas, P. (2007). PCA-correlated SNPs for structure identification in worldwide human populations. Public Library of Science Genetics 3 (9), 1672–1686. https://doi.org/10.1371/journal.pgen.0030160.
Peterson, C./Li, T./Norcross, M. (2025). Return on investment of anterior cruciate ligament injury prevention programs in the United States. Journal of Athletic Training. https://doi.org/10.4085/1062-6050-0507.24.
Posch, M./Ruedl, G./Greier, K./Faulhaber, M./Tecklenburg, K./Schranz, A./Schliernzauer, B./Burtscher, M. (2023). Impact of Environmental Factors on the ACL Injury Risk in Recreational Alpine Skiing. International Journal of Sports Medicine 44 (13), 1003–1008. https://doi.org/10.1055/a-2134-3908.
Posthumus, M./September, A. V./O'Cuinneagain, D./van der Merwe, W./Schwellnus, M. P./Collins, M. (2010). The association between the COL12A1 gene and anterior cruciate ligament ruptures. British Journal of Sports Medicine 44 (16), 1160–1165. https://doi.org/10.1136/bjsm.2009.060756.
Rahim, M./Gibbon, A./Hobbs, H./van der Merwe, W./Posthumus, M./Collins, M./September, A. V. (2014). The association of genes involved in the angiogenesis-associated signaling pathway with risk of anterior cruciate ligament rupture. Journal of Orthopaedic Research 32 (12), 1612–1618. https://doi.org/10.1002/jor.22705.
Rahim, M./Lacerda, M./Collins, M./Posthumus, M./September, A. V. (2022). Risk modelling further implicates the angiogenesis pathway in anterior cruciate ligament ruptures. European Journal of Sport Science 22 (4), 650–657. https://doi.org/10.1080/17461391.2021.1884750.
Ribas, M. R./Schneider, F. K./Ribas, D. I. R./Lass, A. D./Badicu, G./Bassan, J. C. (2023). Genetic Polymorphisms and Their Impact on Body Composition and Performance of Brazilians in a 105 Km Mountain Ultramarathon. European Journal of Investigation in Health, Psychology and Education 13 (9), 1751–1761. https://doi.org/10.3390/ejihpe13090127.
Ribbans, W. J./September, A. V./Collins, M. (2022). Tendon and Ligament Genetics: How Do They Contribute to Disease and Injury? A Narrative Review. Life 12 (5). https://doi.org/10.3390/life12050663.
Ross, A. G./Agresta, B./McKay, M./Pappas, E./Cheng, T./Peek, K. (2023). Financial burden of anterior cruciate ligament reconstructions in football (soccer) players: an Australian cost of injury study. Injury Prevention: Journal of the International Society for Child and Adolescent Injury Prevention 29 (6), 474–481. https://doi.org/10.1136/ip-2023-044885.
Salman, L. A./Moghamis, I. S./Hatnouly, A. T./Khatkar, H./Alebbini, M. M./Al-Ani, A./Hameed, S./AlAteeq Aldosari, M. (2024). Correlation between anthropometric measurements and graft size in anterior cruciate ligament reconstruction: a systematic review and meta-analysis. European Journal of Orthopaedic Surgery & Traumatology 34 (1), 97–112. https://doi.org/10.1007/s00590-023-03712-w.
Sanders, T. L./Maradit Kremers, H./Bryan, A. J./Larson, D. R./Dahm, D. L./Levy, B. A./Stuart, M. J./Krych, A. J. (2016). Incidence of Anterior Cruciate Ligament Tears and Reconstruction: A 21-Year Population-Based Study. The American Journal of Sports Medicine 44 (6), 1502–1507. https://doi.org/10.1177/0363546516629944.
Seong, K.-H./Kim, K.-J./Park, H.-J./Lee, B.-H./Chang, E./Park, D.-H. (2024). Collagen Gene Variants and Anterior Cruciate Ligament Rupture in the Korean Population. Exercise Science 33 (4), 409–414. https://doi.org/10.15857/ksep.2024.00542.
September, A. V./Cook, J./Handley, C. J./van der Merwe, L./Schwellnus, M. P./Collins, M. (2009). Variants within the COL5A1 gene are associated with Achilles tendinopathy in two populations. British Journal of Sports Medicine 43 (5), 357–365. https://doi.org/10.1136/bjsm.2008.048793.
September, A. V./Nell, E.-M./Connell, K. O./Cook, J./Handley, C. J./Schwellnus, M. P./Collins, M. (2011). Investigations of genes encoding proteins within the inflammatory pathway provides insight into the genetic susceptibility of achilles tendinopathy. British Journal of Sports Medicine 45 (4), 340. https://doi.org/10.1136/bjsm.2011.084038.86.
September, A. V./Schwellnus, M. P./Collins, M. (2007). Tendon and ligament injuries: the genetic component. British Journal of Sports Medicine 41 (4), 241-246. https://doi.org/10.1136/bjsm.2006.033035.
Spindler, K. P./Wright, R. W. (2008). Clinical practice. Anterior cruciate ligament tear. The New England Journal of Medicine 359 (20), 2135–2142. https://doi.org/10.1056/NEJMcp0804745.
Steffensmeier, A. M./Lamont, S. M./Metoyer, G./DiPaolo, Z./Froehle, A. W. (2020). Relationship Between Age at Adult Height and Knee Mechanics During a Drop Vertical Jump in Men. Orthopaedic Journal of Sports Medicine 8 (8). https://doi.org/10.1177/2325967120944912.
Sun, Z./Cięszczyk, P./Humińska-Lisowska, K./Michałowska-Sawczyn, M./Yue, S. (2023). Genetic Determinants of the Anterior Cruciate Ligament Rupture in Sport: An Up-to-Date Systematic Review. Journal of Human Kinetics 87, 105–117. https://doi.org/10.5114/jhk/163073.
Tamura, A./Akasaka, K./Otsudo, T./Shiozawa, J./Toda, Y./Yamada, K. (2017). Dynamic knee valgus alignment influences impact attenuation in the lower extremity during the deceleration phase of a single-leg landing. Public Library of Science One 12 (6), e0179810. https://doi.org/10.1371/journal.pone.0179810.
Tian, C./Gregersen, P. K./Seldin, M. F. (2008). Accounting for ancestry: population substructure and genome-wide association studies. Human Molecular Genetics 17 (R2). https://doi.org/10.1093/hmg/ddn268.
Tucker, R./Collins, M. (2012). What makes champions? A review of the relative contribution of genes and training to sporting success. British Journal of Sports Medicine 46 (8), 555–561. https://doi.org/10.1136/bjsports-2011-090548.
Wang, J./Lü, D./Mao, D./Long, M. (2014). Mechanomics: an emerging field between biology and biomechanics. Protein & Cell 5 (7), 518–531. https://doi.org/10.1007/s13238-014-0057-9.
Wiggins, A. J./Grandhi, R. K./Schneider, D. K./Stanfield, D./Webster, K. E./Myer, G. D. (2016). Risk of Secondary Injury in Younger Athletes After Anterior Cruciate Ligament Reconstruction: A Systematic Review and Meta-analysis. The American Journal of Sports Medicine 44 (7), 1861–1876. https://doi.org/10.1177/0363546515621554.
Zhao, D./Zhang, Q./Lu, Q./Hong, C./Luo, T./Duan, Q./Shu, S./Lv, J./Zhao, W. (2020). Correlations Between the Genetic Variations in the COL1A1, COL5A1, COL12A1, and β-fibrinogen Genes and Anterior Cruciate Ligament Injury in Chinese Patients. Journal of Athletic Training 55 (5), 515–521. https://doi.org/10.4085/1062-6050-335-18.