Growth, Nutrition and Economy
Proceedings of the 27th Aschauer Soiree, Held at Krobielowice, Poland,
November 16th 2019
Michael Hermanussen ✉
✉
Aschauhof 3, 24340 Eckernförde – Altenhof, Germany.
Christiane Scheffler
University of Potsdam, Human Biology, 14469 Potsdam, Germany.
University of Potsdam, Human Biology, 14469 Potsdam, Germany.
University of Potsdam, Institute of Biochemistry and Biology, 14476
Potsdam-Golm, Germany.
Child and Adolescent Psychiatry, Penn State College of Medicine, Hershey, PA
17033, USA.
Department of Pediatrics, University of California, Irvine, CA 92617,
USA.
Natalia Nowak-Szczepanska
Department of Anthropology, Hirszfeld Institute of Immunology and
Experimental Therapy, Polish Academy of Sciences, 50-449 Wroclaw, Poland.
Aleksandra Gomula
Department of Anthropology, Hirszfeld Institute of Immunology and
Experimental Therapy, Polish Academy of Sciences, 50-449 Wroclaw, Poland.
Anna Apanasewicz
Department of Anthropology, Hirszfeld Institute of Immunology and
Experimental Therapy, Polish Academy of Sciences, 50-449 Wroclaw, Poland.
Jan M. Konarski
Poznań University of Physical Education, Department of Theory of Sport,
Poznań, Poland.
Robert M. Malina
Department of Kinesiology and Health Education, University of Texas at
Austin, TX 78712, USA.
Sylwia Bartkowiak
Poznań University of Physical Education, Department of Theory of Sport,
Poznań, Poland.
Lidia Lebedeva
Public Opinion Foundation, Moscow, Russia.
Department of Anatomy, Histology and Anthropology, Institute of Biomedical
Science, Faculty of Medicine, Vilnius University, Vilnius, Lithuania.
Vsevolod Konstantinov
Department of General Psychology, Penza State University, Penza,
Russia.
61250 Usingen, Germany.
Yehuda Limony
Beer-Sheva 8481647 Israel.
Raja Chakraborty
Dinabandhu Mahavidyalaya, Bongaon, West Bengal, India 743235.
Sylvia Kirchengast
University of Vienna/Institute for Anthropology, 1090 Vienna, Austria.
Department of Anatomy, Histology and Anthropology, Institute of Biomedical
Science, Faculty of Medicine, Vilnius University, Vilnius, Lithuania.
Egle Marija Jakimaviciene
Department of Anatomy, Histology and Anthropology, Institute of Biomedical
Science, Faculty of Medicine, Vilnius University, Vilnius, Lithuania.
Department of Anatomy, Histology and Anthropology, Institute of Biomedical
Science, Faculty of Medicine, Vilnius University, Vilnius, Lithuania.
Economic and Social History Department, University of Groningen, 9712 EK
Groningen, The Netherlands.
Bárbara Navazo
Laboratorio de Investigaciones en Ontogenia y Adaptación (LINOA). Facultad
de Ciencias Naturales y Museo, Universidad Nacional de La Plata, Argentina.
Annang G. Moelyo
Moewardi Hospital, Jalan Kolonel Soetarto 132, Surakarta, Jawa Tengah,
Indonesia.
National Institute of Health and Nutrition & Otsuma Women's University,
522-6, Mabashi, Matsudo, Chiba 271-0051, Japan.
Slawomir Koziel
Department of Anthropology, Hirszfeld Institute of Immunology and
Experimental Therapy, Polish Academy of Sciences, 50-449 Wroclaw, Poland.
DOI: https://doi.org/10.52905/hbph.v1.1
Abstract
Twenty-three scientists met at Krobielowice, Poland to discuss the role of growth,
nutrition and economy on body size. Contrasting prevailing concepts, re-analyses of
studies in Indonesian and Guatemalan school children with high prevalence of stunting
failed to provide evidence for an association between nutritional status and body height.
Direct effects of parental education on growth that were not transmitted via nutrition
were shown in Indian datasets using network analysis and novel statistical methods (St.
Nicolas House Analysis) that translate correlation matrices into network graphs. Data on
Polish children suggest significant impact of socioeconomic sensitivity on child growth,
with no effect of maternal money satisfaction. Height and maturation tempo affect the
position of a child among its peers. Correlations also exist between mood disorders and
height. Secular changes in height and weight varied across decades independent of
population size. Historic and recent Russian data showed that height of persons whose
fathers performed manual work were on average four cm shorter than persons whose fathers
were high-degree specialists. Body height, menarcheal age, and body proportions are
sensitive to socioeconomic variables. Additional topics included delayed motherhood and
its associations with newborn size; geographic and socioeconomic indicators related to low
birth weight, prematurity and stillbirth rate; data on anthropometric history of Brazil,
1850-1950; the impact of central nervous system stimulants on the growth of children with
attention-deficit/hyperactivity disorder; and pituitary development and growth hormone
secretion. Final discussions debated on reverse causality
interfering between social position, and adolescent growth and developmental tempo.
Keywords: nutrition, stunting, socioeconomy, education, secular changes, pubertal timing
Conflict of Interest: There are no
conflicts of interest.
Citation: Hermanussen, M et al. (2021), Growth, Nutrition and Economy, Human Biology and Public Health 1. https://doi.org/10.52905/hbph.v1.1.
Copyright: This is an open access article distributed under the terms of the Creative Commons Attribution License which permits unrestricted use, distribution, and reproduction in any medium, provided the original author and source are credited.
Received: 18-08-2020 | Accepted: 01-10-2020 | Published: 22-06-2021
Contents
Christiane Scheffler re-analyzed body height in two populations of Indonesian and Guatemalan
school children with high prevalence of stunting using breakpoint analysis. This method
segregates two segments of a linear regression, and can be used to quantify an abrupt change
of the response function of a varying influential factor. The breakpoint can be interpreted as
a critical threshold value beyond or below which a particular effect occurs
(Muggeo 2017). She hypothesized that at least in
subgroups of exceptionally thin children of these stunted populations, an association between
nutritional status and body height might exist. Thinness was defined by body mass index
standard deviation score (BMI_SDS) <-2 (WHO reference), by mid-upper arm circumference
(MUAC) <18 cm (corresponds to 10th centile of an US population (Addo et al. 2017)), and mean skinfold thickness (two skinfolds, SF) <7
mm (corresponds to 10th centile of a German population (Schilitz 2001). Scheffler failed to detect meaningful breakpoints in BMI, MUAC, and
SF, in the stunted populations of Indonesian and Guatemalan school children, replicating
previous evidence that stunting is not a synonym for malnutrition (Scheffler et al. 2020).
Michael Hermanussen presented a novel non-parametric statistical method that translates
multiple linear correlation matrices into network graphs based on ranking correlation
coefficients. In view of a popular child game, we propose to name this method St. Nicolas
House Analysis (Groth et al. 2019). The performance of
St. Nicolas House Analysis and other network reconstruction methods was tested in randomly
created virtual scale-free networks, networks consisting of bands or hubs. He exemplified the
performance of St. Nicolas House Analysis on extensive interacting variables and hugely
complicated matrices of factors in (1) anthropometric data from an anthropometric survey in
908 Indonesian boys and 808 Indonesian girls, in (2) genomic data obtained from 20 different
Austronesian populations, and in (3) ultrasound measures from routine pregnancy examinations.
St. Nicolas House Analysis visualized network graphs that (1) mirrored the associations
between child anthropometry and highlighted that the effect of parental education on child
height is a direct one, and not mediated via anthropometric variables of nutritional status;
that (2) reflected gene drifts during the Austronesian migration; and (3) correctly assigned
early and late fetal measurements. It is concluded that the performance of St. Nicolas House
Analysis is at least equivalent if not better for generating network graphs than currently
used network reconstruction methods in random generated scale-free networks, and networks
consisting of chains and nodes. Under particular circumstances St. Nicolas House Analysis is
able to also reflect causality within network graphs.
Lidia Martin studied the effect of parental educational status on child growth in seven
Indian datasets, from West Bengal (10-17 years, 547 girls and 523 boys), Kolkata 1982 (7-16
years, 825 boys), Sunderban 2009 (1-5 years, 324 boys and 351 girls), Kolkata 1999 and
2005-2011 (7-12 years, 760 boy and girls), Sikkim 2015 (2-18 years, 544 boys and girls),
Sunderban 2015, 2016 (3-5 years, 326 boys and 330 girls), Southern part of West Bengal 2018
(1-5 years, 556 boys and girls) (Martin et al. 2020)
using the St. Nicolas House Analysis (Groth et al.
2019).The datasets included information on z-scores for body height
and weight, variables that indicate nutritional status (SF, MUAC, and BMI), and socioeconomic
variables including household income and parental education. St. Nicolas House Analysis
detected association chains between parental education and body height that were not mediated
via nutritional status. Parental education did not influence BMI. Paternal educational status
was primarily linked to family income rather than directly to body height. Martin also failed
to provide evidence for direct relations between socioeconomic variables and indicators of
nutritional status. Martin concluded that effects of parental and particularly maternal
education on height are direct effects and not transmitted via nutrition. The effect of
household income appeared to be secondary and conducted via parental education.
Detlef Groth discussed challenges and approaches of network inference from given correlation
matrices. Although correlation may not result from direct causation, the underlying direct or
indirect associations between variables can be used to uncover the network structure. Groth
discussed advantages and disadvantages of current methods used to explore and to infer such
networks, like linear regression or partial correlation. The major problem of those methods if
they are used by researchers with a non-computation background seems to be the wide range of
possible parameters. Those parameters need to be supplied by the investigator and the
researchers often have problems deciding which way to go. Furthermore, there is the danger
that the researchers are biased by their hypothesis and often chose parameters which fit their
hypothesis best and not those which might be adequate for the analysis. The presenter focused
thereafter on an alternative approach which uses a non-parametric algorithm by sorting the
correlation values for each variable separately. Thereafter, forward and reversely compatible
sequences of decreasing correlation values, association chains between different
factors/variables, can be uncovered. This, quite recently published approach (Groth et al. 2019), proved to be very valuable to find
such chains in not highly connected networks. The method’s main advantage is simplicity and
that it does not require any parameters to be used. At the end a simple toy example as well as
possibilities to improve this analysis, for instance by silencing indirect associations using
network deconvolution (Feizi et al. 2013) were
presented. The author showed herein a defined network with synthetic data representative for
it, and how the algorithm can fully recover the network structure. The approach promised to be
an easy to use valuable tool in the hand of anthropologists, nutritionists and other
scientists to explore relationships between the variables of interest.
James Waxmonsky and James Swanson examined the impact of central nervous system (CNS)
stimulants on the growth of children with attention-deficit/hyperactivity disorder (ADHD) and
assessed the efficacy and feasibility of weight recovery interventions on growth. 230 children
ages 5-12 with ADHD with no history of chronic CNS stimulant usage were randomly assigned to
receive daily CNS stimulants (78%, primarily OROS-MPH) or behavioral treatment (22%) for 30
months. After 6 months, children evidencing a decline in BMI of >.5
z-scores were randomized to one of three weight recovery treatments (WRTs):
monthly monitoring of height/weight (MON) plus continued daily medication, drug holidays (DH)
with medication limited to school days, or daily caloric supplementation (CS) with a 150-kcal
supplement plus daily medication. Before WRT assignment, medication was associated with
significant reductions in standardized weight and height (p’s<.01).
Adherence to CS and DH during WRT was high, with significant increases in daily caloric intake
and decreases in weekly medication exposure (p‘s<.05). Across all WRT
participants (n=71), weight velocity increased significantly after WRT randomization
((β2)=0.271, SE=0.027, p<0.001). When analyzed by what
parents did (versus what they were assigned to), CS (p<0.01) and DH
(p<0.05) increased weight velocity more than MON. No increase in height
velocity was seen after randomization to any WRT. Over the entire study, WRT participants
declined in standardized weight (-0.44 z-units) and height
(-0.20 z-units). The authors concluded that drug holidays, caloric
supplementation and increased monitoring all led to increased weight velocity in children
taking CNS stimulants, but none led to increased height velocity. It may be speculated that
the lack of increase in height velocity was due to the CNS stimulant.
Natalia Nowak-Szczepanska, Aleksandra Gomula, and Anna Apanasewicz assessed the socioeconomic
sensitivity of selected anthropometric parameters in Polish children at two different social
levels and two different stages of development: a) at family-level – where contemporary infant
growth parameters were analyzed referring to the mother’s money satisfaction; b) at
population-level – where growth of school children between 1966 and 2012 was assessed in
relation to changes in GDP (gross domestic product) per capita. For infants
(N=38 boys and N=41 girls, exclusively breastfed), body length, body weight, BMI and head
circumference were measured longitudinally at birth, fifth month and twelfth month of age,
controlling confounding factors. Maternal money satisfaction was subjectively assessed on a
7-point scale and divided into two categories: low and high. There were no significant
differences in any of the analyzed anthropometric parameters between infants from low
versus high maternal money satisfaction groups. In contrast, at
population-level, biological parameters (BMI=body mass index, mid-upper arm circumference, age
at menarche, height) of school children (7-18 years of age, total N= approx.
70 000) measured in 1966, 1978, 1988 and 2012 were associated with changes in GDP per
capita. However, the socioeconomic sensitivity varied depending on the trait being
analyzed. The most sensitive and coinciding with GDP per capita were
mid-upper arm circumference and menarcheal age, while patterns of changes in height and BMI
differed in some periods compared to GDP per capita. The authors concluded
that different results on the effect of socioeconomic factors on biological parameters between
infants and school children might be related to the different sensitivity of particular
developmental periods. On the other hand, the subjective scale of a socioeconomic situation
may have some limitations. However, the lack of biological differences in contemporary data on
infants from different groups of maternal money satisfaction might also be caused by a
significant improvement of living conditions in Poland in recent years, implying that
socioeconomic factors have lost their differentiating effects.
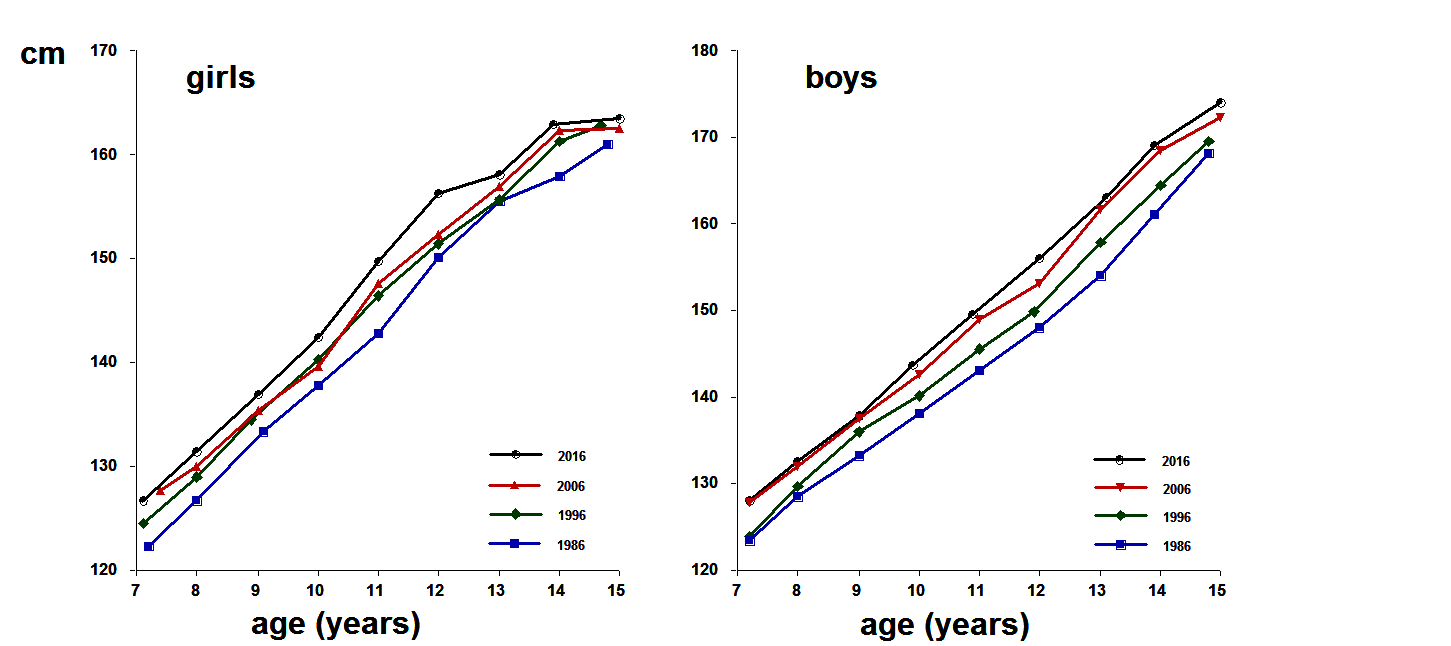
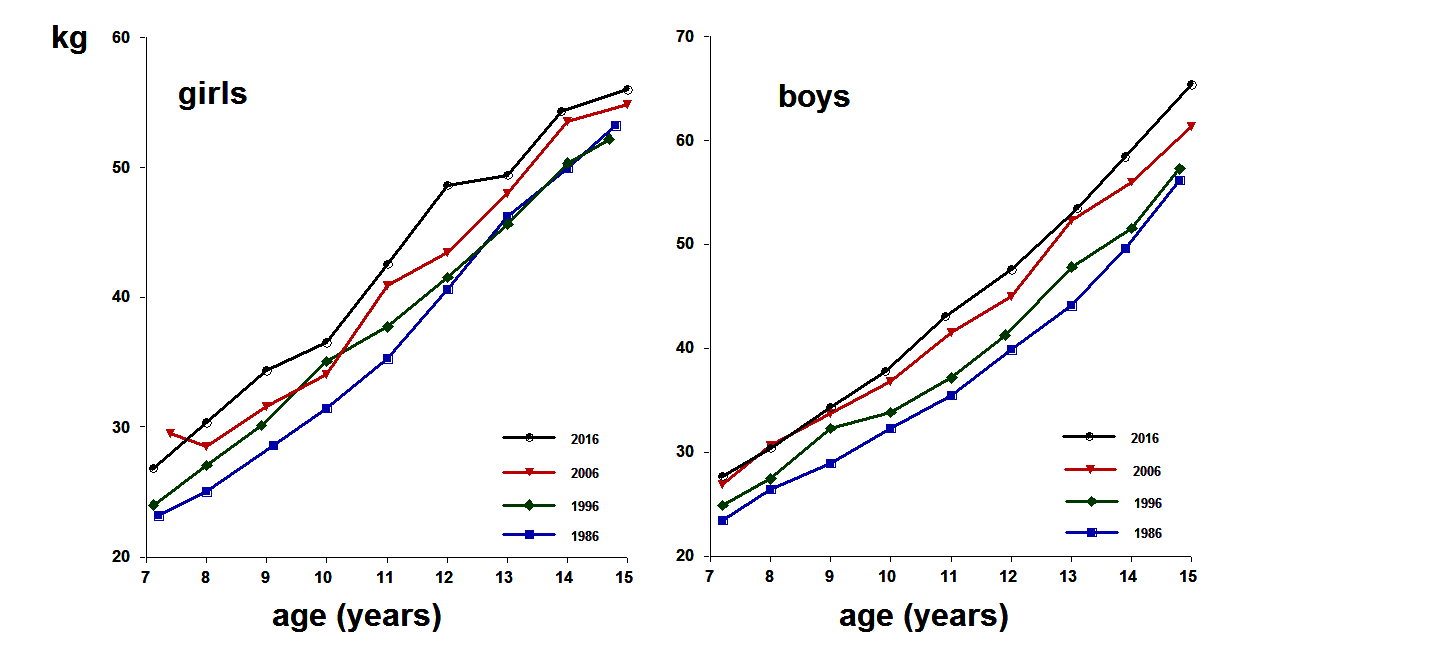
Figure 1 Jan M. Konarski studied in cooperation with Robert M. Malina and others whether
secular changes in height and weight among rural Polish school youth were related to
population growth, and compared changes in heights and weights of school children 7–15
years of age in ten rural communities.
The ten communities were divided into two groups, five with significant increases in
population between 1986 and 2016 (63% to 203%, Major growth) and five with little increase or
even population losses (+20% to -30%, Little/No growth). The sample was partitioned into three
age groups: 7-9, 10-12, and 13-15 years. Sex-specific MANCOVA with age and age2 as
covariates were used for comparisons of secular change between communities with Major and
Little/No growth in each age group; pairwise post hoc comparisons between specific pairs of
surveys, adjusted for multiple comparisons (Bonferroni), were evaluated. Secular changes in
height and weight between 1986 and 2006 did not consistently differ among boys and girls from
villages with Major growth compared to villages with Little/No growth. Estimated secular
change across sequential decennial surveys (1986-1996, 1996-2006, 2006-2016) did not differ
consistently differ between the two groups, except for larger gains in both height and weight
between 2006 and 2016 among boys 10-12 and 13-15 years from communities with Little/No growth.
A similar trend was found in height among girls 7-9 and 13-15 years from communities with
Little/No growth. Konarski concluded that secular changes in height and weight do not depend
on increases in population.
Sylwia Bartowiak presented secular change in height and weight of rural school children 7–15
years of age in the Greater Poland Voivodeship (West-central Poland) between 1986 and 2016.
Data were obtained from growth surveys (height, weight, physical fitness) in ten rural
communities conducted in 1986, 1996, 2006 and 2016, with 1417 boys and 1326 girls in 1986; 979
boys and 947 girls in 1996; 871 boys and 843 girls in 2006; and 1189 boys and 1105 girls in
2016. The sample was partitioned into three age groups (1) 7-9 years – middle childhood in
both sexes; (2) 10-12 years – transition into puberty and mid-puberty (most girls, many boys);
and (3) 13-15 years – late adolescence (girls), interval of the growth spurt (boys).
Sex-specific MANCOVA with age and age2 as covariates were used for comparisons in
each of the three age groups; pairwise post hoc comparisons between specific pairs of surveys,
adjusted for multiple comparisons (Bonferroni), were evaluated. Between 1986 and 2016,
significant secular increases in height and weight were noted, but varied across the decades
(Figures 1).
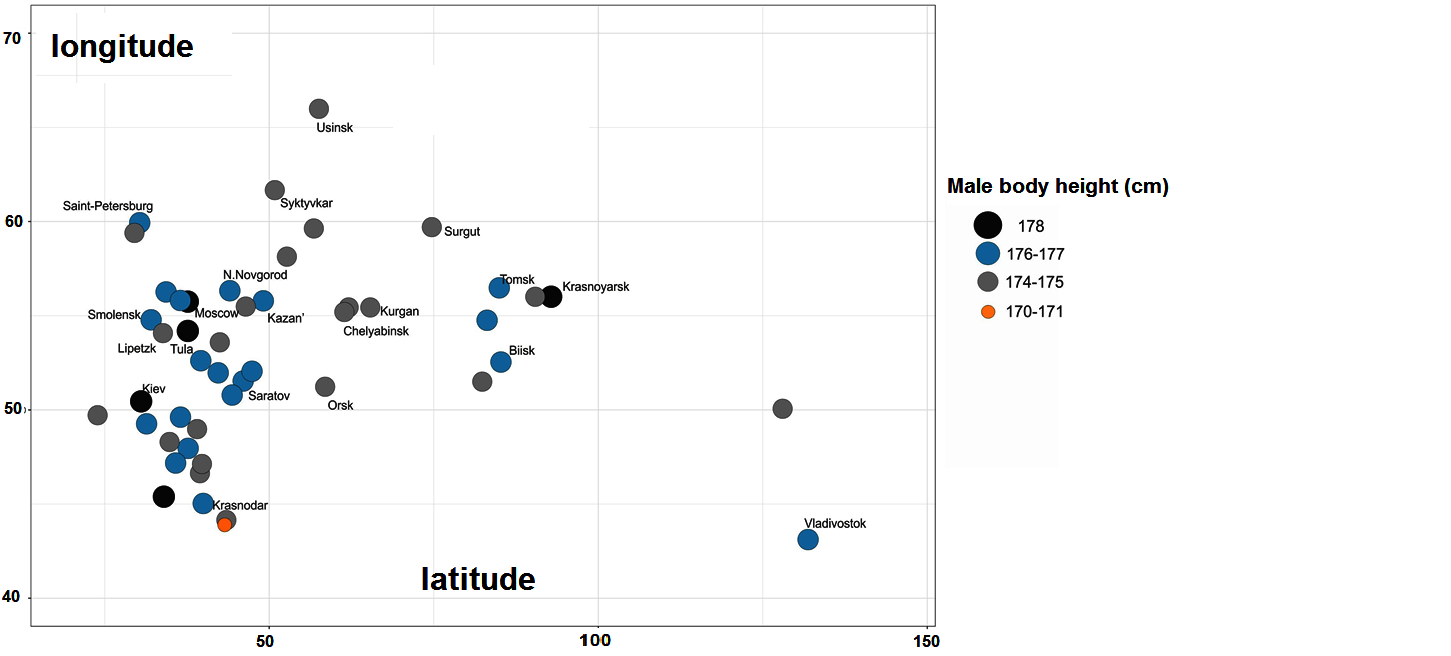
Figure 2 Lidia Lebedeva discussed geographical differences of body height between continents,
macro regions, and different countries with particular emphasis on the Russian situation
(Lebedeva 2019), based on an aggregated
individual dataset of the Russia Longitudinal Monitoring Survey, Higher School of
Economics (RLMS HSE) of the years 1994-2016, with 316,600 responses of 22-65 years old
adult persons.
She showed that nationality matters with Russians being on average some 2-5 cm taller than
territorial persons living in the same area. People living in cities with more than one
million inhabitants are on average some 2-3 cm taller than rural people of the same district.
Parental education also matters. Persons whose fathers had primary or unfinished secondary
education were on average 174 cm tall, people whose fathers had academic education reached on
average 178 cm. Height of persons whose fathers performed manual work were on average 4 cm
shorter than persons whose fathers were high-degree specialists.
Reports on associations between depression and height are scarce and controversial. As short
stature has been considered a causal risk factor for depression (Speed et al. 2019), Andrej Suchomlinov and Vsevolod Konstantinov
presented the association between depression, height and BMI in the adolescent and adult
populations of Penza city and oblast, Russia, with 554 participants aged 16-89 years. The
presence and severity of depression was evaluated using Beck’s Depression Inventory (BDI-II)
(Beck et al. 1996). The participants of the study
self-reported their height (cm) and weight (kg). In adults, thinness was defined as BMI value
below 18.5 kg/m2; overweight – above 25 kg/m2 and obesity – above 30
kg/m2. In adolescents, thinness, overweight and obesity were defined according to
IOTF cut-off values (Cole and Lobstein 2012). The
authors found a negative correlation between height and depression score (ρ=-0.1322, p=0.002)
that was visible in the combined sample, but not for men and women tested separately. No
significant correlations were obtained between height and depression score in both employed
and retired participants; only in students, a significant negative correlation was found
(ρ=-0.3307, p=0.002). Negative correlations between height and depression score were also
shown in participants with normal BMI (ρ=-0.2228, p<0.001); no significant
correlations between height and depression score were found in underweight, overweight or
obese individuals. No significant correlation was obtained between BMI and depression score.
In conclusion, the authors found significant correlations between depression and short stature
in young men, depression and short stature in participants with normal body mass index, and
depression and age in overweight participants. Young women (16-23 years) and elderly men
(60-89 years) presented the highest and very similar depression scores; special attention
should be paid to the aforementioned groups due to their higher risks of depressive disorders.
Pituitary development and GH secretion are orchestrated by multiple genes including
GH1, GHRHR, GLI2,
HESX1, LHX3, LHX4, PROP1,
POU1F1, and SOX3. Werner Blum aimed to assess their
mutation frequency and clinical relevance in children with severe GH deficiency (GHD). The
Genetics and Neuroendocrinology of Short Stature International Study (GeNeSIS; NCT01088412)
was a prospective, open-label, observational research program for children receiving GH
treatment, conducted in 30 countries between 1999 and 2015. The study included a sub-study to
investigate mutations in the genes listed above. PCR products from genomic blood cell DNA were
analyzed by Sanger sequencing. DNA variants were classified as pathogenic according to the
recommendations of the American College of Medical Genetics and Genomics. Demographic,
auxologic, and endocrine data at baseline and during GH treatment were documented and related
to the genotyping results. In 92 of 917 tested patients (10%) 33 mutations were found, 17
previously undescribed (52%). The highest mutation rates were found in PROP1
(N=49) and GH1 (N=26). Mutation carriers were significantly younger, shorter,
and more slowly growing than non-carriers. In general, their peak values in GH stimulation
tests were very low; however, in 15/77 (20%) patients with GH1,
PROP1, and SOX3 mutations they were only moderately diminished
(3-6µg/L). Seven of 74 patients (9.5%) had a baseline height SDS >-2 in the low normal
range, 6 with a PROP1 mutation and 1 with a GH1 mutation
(IGHD type II). Five of 27 patients (19%) had a baseline IGF-I SDS >-2 in the low normal
range, 2 with a PROP1 mutation and 1 with a GH1 mutation
(IGHD type II) and 2 with a GHRHR mutation. Height SDS in patients with
GH1 deletion (IGHD type IA) was massively diminished in contrast to
patients with GHRHR mutation (IGHD IB) or GH1 mutation due
to exon 3 skipping (IGHD II). Two patients with a GH1 mutation (IGHD type II)
developed TSH deficiency. DNA testing for mutations in children with severe GHD shows a
positive finding in approximately 10% of the cases. Phenotypes of mutation carriers can
massively vary depending on the genotype. GHD in patients with a PROP1
mutation develops during early childhood until adolescence which may explain the wide
variation of the phenotypes. The most frequent GH1 mutations, all
heterozygous and negative dominant, cause exon 3 skipping due to mutations of weak splice
donor or acceptor sites or splice enhancers in exon 3 or in the neighboring introns. The
product of such mutated genes is a 17.5 k GH variant which appears to be toxic to
somatotrophic cells causing finally GHD and possibly deficiencies of other pituitary hormones
due to innocent bystander effects. Depending on the specific mutation, stimulated GH and
growth impairment were found to be significantly different with splice enhancer mutations
being less devastating than mutations of the splice donor or acceptor sites. Overall these
findings call for caution with respect to defining clear-cut red lines for making the
diagnosis GHD and justify DNA testing as an important component in the diagnostic work-up of
patients with GHD.
There is a correlation between the age of onset of puberty and the “height gap” in childhood.
“Height gap” was defined as the difference between the standardized height of the child and
the standardized target height. In their previous study (Limony et al. 2019), Yehuda Limony and coworkers analyzed growth data of boys and
girls from Poland (Wroclaw) and Israel (Beer-Sheva). The adjusted R2 between the
independent parameters “height gap” and BMI percentile and the dependent parameter age of
onset of puberty were: Wroclaw girls 0.25, Wroclaw boys 0.13, Israeli girls 0.69 and Israeli
boys 0.50. Given the results' difference between the Polish and the Israeli groups, Yehuda
Limony presented an observational retrospective study on growth during puberty in 210 girls
and 210 boys that were randomly selected from 401 girls and 512 boys of the Cracow growth
study. Data were analyzed by the ICP longitudinal model of growth (Karlberg 1989) to determine the age of onset of puberty. Anthropometric
measurements were analyzed by multivariable linear regression with the onset age of the
pubertal growth spurt as the dependent variable and two independent variables “height gap” and
BMI percentile. The adjusted coefficient of determination (adj R2) between the
onset age of the pubertal growth spurt and the two independent variables was 0.20 (Cracow
girls) and 0.22 (Cracow boys). The correlation found in the Israeli group in the previous
study is much higher, probably because the Israeli group, unlike the Polish groups, included
selected children (from a consultation clinic) rather than a random normal population as in
the Polish groups. As the two groups of Polish children measured at different periods
(1961-1972 in Wroclaw, 1980-1988 in Cracow) were quite similar, the author concluded that the
association between the independent parameters “height gap” and BMI percentile and the
dependent parameter age of onset of puberty, found in the two studies, may represent a
universal phenomenon.
Raja Chakraborty, Priyanka Bala and Kaushik Bose studied age at menarche and anthropometry in
Indian school girls from two secondary schools of North 24 Parganas district in West Bengal
State, India. 94 out of 208 adolescent girls were pre-menarcheal and 114 were post-menarcheal.
They all belonged to low socio-economic status. Menarcheal status (yes/no), and age at
menarche (AAM) were recorded and body height, weight, sitting height, leg length, thigh
length, knee height, lower leg length, head length and head breadth were measured. The
chronological age range was 10.2-14.7 with a mean AAM of 12.3 (SD 0.5) and a median of 11.0
years. There was no significant difference in mean age between the pre- and post-menarcheal
girls, and between early and the late menarcheal girls. The post menarcheal girls had
significantly higher values of height, sitting height, leg length, thigh length, knee height
and lower leg length (tibial length). However, the values of these measures as ratios of
height did not differ significantly between the pre- and the post menarcheal girls. The head
length and breadth also did not show any difference. Post-menarcheal girls had slightly but
significantly higher elbow breadth, and higher values of body weight, BMI, MUAC and sum of the
skin fold thicknesses. Early and late menarcheal girls differed in height, knee height, lower
leg length and lower leg length-to-height ratio, with lower values in the early menarcheal
girls. The greatest difference was seen in the lower leg length. Previous studies have found
that age at menarche is associated with stature, primarily via leg length (total). The
leg-length-to-sitting-height ratio has been suggested to be a marker of pre-pubertal
nutritional status and the age at pubertal onset. We presumed that an early menarche had put a
higher allostatic load during puberty. This load was perhaps particularly high among the
participants belonging to low socio-economic conditions. This higher allostatic load might
have caused a higher developmental stress that led to developmental trade-offs between
energetically costly functions of growth, particularly during reproductive maturity. The
negative effect of this tradeoff was more effective on the lower limb length which is more
plastic than head-trunk height. The effect of energy rationing for attaining early menarche,
perhaps, was reflected in height through shorter tibial length in present group of
children.
Sylvia Kirchengast discussed delayed motherhood – a current trend and its associations with
newborn size and delivery mode. A significant postponement of reproduction, indicated by an
increasing average maternal age at first birth, is found in many parts of the world. In
Austria, the average age at first birth increased from 23.3 years in 1980 to 29.8 years in
2018. From a biomedical viewpoint, however delaying motherhood is a risky strategy because an
advanced maternal age increases the risk of spontaneous abortions, stillbirths, ectopic
pregnancies, preterm birth or chromosomal abnormalities. In the present study course of
pregnancy and pregnancy outcome of 28,881 singleton births taking place in Vienna, Austria
were analyzed. With increasing maternal age, the prevalence of preterm birth (<36 weeks)
increased significantly. Among women experiencing term births, with increasing maternal age
the prevalence of breech presentation, planned as well as emergency caesarean section, and low
birth weight (<2500g) increased significantly. Consequently, delaying motherhood could be
identified as a risk factor. On the other hand, a global increase of age at first birth might
reduce population growth and in this way may be an appropriate strategy.
Janina Tutkuviene, Egle Marija Jakimaviciene and Ramune Cepuliene analyzed negative outcomes
of the development in uterus: global geographic, climatic and socioeconomic indicators versus
individual maternal factors related to low birth weight (LBW), prematurity and stillbirth
rate. Preterm neonates have higher risk for short-term and long-term morbidities (Chawanpaiboon et al. 2019). Stillbirths had a declining
trend in many countries recently, however, the total stillbirth rate remains very high in some
parts of the world (i.e. South Asia and sub-Saharan Africa (Saleem et al. 2018), (Sharma et al. 2019).
Data on LBW newborns, prematurity and stillbirth rate were analyzed for the 1995-2015 period
from Lithuanian Medical Data of Births. Lithuanian indices were compared to analogous data
from the other 57 countries. Different environmental, demographic and socio-economic
indicators for those countries were drawn out from officially available websites, and factor
analysis (principal component) was performed. In Lithuania, LBW fluctuated between 4,2-5,0%;
the prevalence of prematurity – 4.8-6.0%; the prevalence of stillbirths – 0.46-0.72%. During
the last few decades, LBW, prematurity and stillbirth rates in Lithuania were among the lowest
in the world. Advanced age of the mother at pregnancy, lower educational level, unmarried
status, smoking and alcohol consumption were the risk factors for the stillbirths in Lithuania
(Table 1).
Table 1 Maternal sociodemographic data (stillbirths vs. general population of newborns in
Lithuania)
| Sociodemographic index |
Stillbirths |
General population |
p |
| Maternal age |
|
|
|
| ≤19
years |
6.6% |
5.5% |
p>0.05 |
| 20-34
years |
72.2% |
81.0% |
p<0.001 |
| ≥35
years |
21.3% |
13.5% |
p<0.001 |
| Education |
|
|
|
| Primary |
3.55% |
2.7% |
p>0.05 |
| Basic or
secondary |
57.9% |
47.6% |
p<0.001 |
| College |
16.2% |
15.6% |
p>0.05 |
| University |
21.5% |
33.6% |
p<0.001 |
| Familial
status |
|
|
|
| Married |
67.5% |
74.7% |
p<0.05 |
| Unmarried |
23.8% |
17.9% |
p<0.05 |
| Divorced |
4.2% |
2.0% |
p>0.05 |
| In
partnership |
4.4% |
4.4% |
p>0.05 |
Factor analysis showed that the prevalence of stillbirths was strongly related to the main
socioeconomic indicators of the country or region (in particular, Inequality-adjusted Human
Development Index, gross domestic product per capita), food (in particular, meat, eggs, sugar)
consumption, also to life expectancy and fertility rate. However, LBW and prematurity
(together with the population density and a few geographic/climatic factors) were under the
influence of other separate factors.
Daniel Franken showed data on anthropometric history of Brazil, 1850-1950. Trends in human
welfare in Brazil have remained shrouded by a dearth of historical evidence. Although
quantitative historians have revealed the efficacy of the First Republic (1889-1930) in
fomenting economic progress, the extent to which Brazil’s early economic growth fostered
improvements in health remains unclear. This paper fills this void in scholarship by relying
on hitherto untapped archival sources with data on human stature. The author focused his
analysis on a large (N≈16,000), geographically-comprehensive series compiled from military
conscription files, supplemented by an ancillary dataset drawn from passport records
(N≈6,000). He documented inferior heights in the North and Northeast that predated the advent
of industrialization. At the national level, the findings revealed an increase in stature of
over 2.5 centimeters between soldiers born in the 1880s and those born in the 1910s. It is
suggested that in the South and Southeast, increased real income and public-health
interventions explain the earlier upward trend in heights, while rural sanitary reforms were
most important in the North and Northeast, where heights remained stagnant until the 1910
decade and diseases such as hookworm and malaria were most rampant.
Bárbara Navazo compared Frame Indices (FI) of two cross-sectional cohorts of school children
from Argentina with the European reference (ER) (Navazo
et al. 2020), (Mumm et al. 2018). The Frame
Index is associated with the relative skeletal mass on body composition and has been used as a
measurement of external skeletal robustness in both, current and past populations. It is
calculated as follows: Frame Index (FI) = [(elbow breadth/height) × 100]. The Cohort 1=C1 was
studied in 2001-2006 and the Cohort 2=C2 in 2014-2016 and included boys and girls, aged 6 to
14 years, from Puerto Madryn (Chubut, Argentina). FI has been used as a measurement of
external skeletal robustness. Centile (P) from C1 and C2 were calculated combining the
LMS-method and its extension and the values were compared between them and with ER. FI showed
a negative secular trend between C1 (2001-2006) and C2 (2014-2016) in the Puerto Madryn school
children. However, in boys FI of the ER were higher than C1 – in some ages – and in all cases
also of C2. In girls, FI values of the ER were lower than C1 and higher than C2. The negative
secular trend in external skeletal robustness of the Puerto Madryn school children could be
caused by low physical activity of the more recent cohort of children. She highlighted the
importance of daily physical activity both at schools and gyms and conditions that stimulate
open-air recreational activities (in squares, parks, etc.), to maximize bone mass and prevent
future osteoporosis and bone fractures.
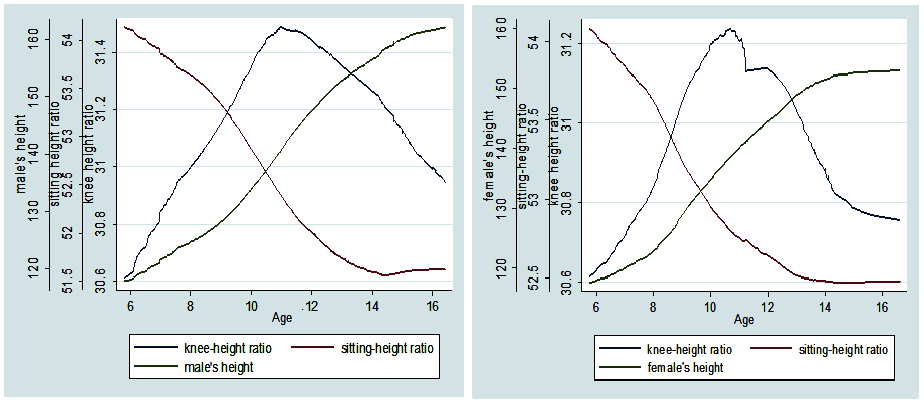
Figure 3 Annang Giri Moelyo presented knee height and knee height ratios among school
children in Surakarta, Indonesia, and analyzed increment of height, knee height and
sitting height, and growth patterns of knee height ratio and height.
Data on sex, age, and ethnicity were obtained during a cross sectional study in 633 (328
males, 305 females) healthy children of one elementary and one junior high school in
Surakarta, September 2017 to September 2018. There were approximately 5% Chinese and 75%
Javanese participants. Height, weight, arm span, sitting height and knee height were measured
three times. Linear regression analysis was used to predict height from knee height, armspan
and sitting height. Non-parametric analysis through lowess (locally weighted scatterplot
smoothing) were used to analyze growth increment and growth pattern of height, knee height
ratio and sitting height-to-height ratio. Means of height-for-age z-score
(haz) and body mass index-for-age (bmi-z) were ‑0.66±1.03 and 0.48±1.52; and the obesity
prevalence in males and females were 23.5% and 13.1%. The equations for prediction of height
were {Height = 2.40*knee (cm) + 1.36*age (yrs) + 20.31} (male) and {Height = 2.48*knee (cm) +
1.15*age (yrs) + 19.58} (female) (adj.R2=0.97). The knee-height ratio increased
earlier than the sitting height/height ratio in both male and female during pubertal period
(Figure 3). The changes in knee height ratios in
female and in obese subjects are steeper and more narrow than in male and in non-obese
subjects.
Takashi Satake presented secular trends in height and body proportion (Lower segment-Upper
segment Ratio: LUR which was calculated as lower limb length was calculated as lower limb
length (height-sitting height) divided by sitting height of Japanese youth aged 17 years from
1949 to 2015. The data used in this study were Japanese averages of height and sitting height
aged at 17+ years of age from the School Health Statistics report from 1949 to 2015. First, we
plotted height, sitting height and lower limb length against the years, and also plotted lower
limb length against sitting height on the Body Proportion Chart (BPC) (Satake and Hattori 2013). The heights were stagnating from 1990s and then
decreased slightly in both sexes. The sitting heights had been increasing since 1949. In
contrast to usual height charts, the BPC revealed interesting features. There were two
critical points at 1959 and 1995 for boys, 1963 and 1998 for girls, respectively in the
secular trend on the BPC and three phases were clearly distinguished for both sexes,
respectively. I: Earlier period: Sitting height and lower limb length grew both with height
increasing. II: Middle period: Lower limb length grew more than sitting height with height
increasing. III: Recent period: LUR decreased, that is, lower limb length did not increase but
sitting height had continued to increase slightly with stagnated height. With improving
environmental and living conditions, both sitting height and lower limb length increased. When
environmental conditions stagnated, total body height did not further increase, but body
proportions still changed. We confirmed secular trends in height and also in body proportion.
Slawomir Koziel discussed structure and biology of schoolboy peer groups to establish
biological and psychological parameters of boys situated at different positions in peer group
hierarchies. Adolescence seems to be a critical period for shaping self-identity and autonomy,
socialization and enhanced interaction with other individuals in peer group. In this period of
development, the group structure is forming and group hierarchy established. 296 boys aged
between 14-16 years were selected from four randomly selected gymnasiums (middle school)
attending to 21 different classes. Height and weight were measured by trained staff and BMI
was calculated, standardized on age and expressed in z-scores. All
participants did self-assessments of the stage of development secondary sex characteristics:
pubes, abdominal, armpit, chest and face hairs. Using Principal Component Analysis, the scores
of first PC were standardized on age and used in further calculation, and served as an
expression of the general tempo of maturation. Anger, adverseness, physical and verbal
aggression were assessed based on Buss-Perry’s Aggression Questionnaire. The classic
socio-metric method developed by J.L. Moreno (Moreno
1955) was used to establish a position in the peer group. Four positions were
defined: a leader, a grey eminency, a scapegoat and an invisible person. Leaders and invisible
persons were the tallest, whereas scapegoats were the shortest. Grey eminencies and leaders
also matured earlier, whereas scapegoats were the latest maturers. No relationships were found
between position and BMI and aggression level. We concluded that height and tempo of
maturation significantly affect a position in a class, the tallest individual has a greater
chance to be a leader, where as the shortest one – a scapegoat, and early maturers have a
greater chance to become a grey eminence, whereas late maturers remain scapegoats. Also,
positive feedbacks may be considered: leadership among adolescent boys might accelerate growth
of leaders and the position of scapegoats could restrain growth in stature due to stress. It
remains to be elucidated to what extent reverse causality interferes with social position,
adolescent growth and developmental tempo.
References
Addo, O. Y./Himes, J. H./Zemel, B. S. (2017).
Reference ranges for midupper arm circumference, upper arm muscle area, and upper arm
fat area in US children and adolescents aged 1-20 y. The American Journal of Clinical
Nutrition 105 (1), 111–120. https://doi.org/10.3945/ajcn.116.142190.
Beck, A. T./Brown, G. K./Steer, R. A. (1996).
Manual for the Beck Depression Inventory-II. San Antonio, TX, Psychological
Corporation.
Chawanpaiboon, S./Vogel, J. P./Moller,
A.-B./Lumbiganon, P./Petzold, M./Hogan, D./Landoulsi, S./Jampathong, N./Kongwattanakul,
K./Laopaiboon, M./Lewis, C./Rattanakanokchai, S./Teng, D. N./Thinkhamrop,
J./Watananirun, K./Zhang, J./Zhou, W./Gülmezoglu, A. M. (2019). Global, regional, and
national estimates of levels of preterm birth in 2014: a systematic review and modelling
analysis. The Lancet Global Health 7 (1), e37-e46. https://doi.org/10.1016/s2214-109x(18)30451-0.
Cole, T. J./Lobstein, T. (2012). Extended
international (IOTF) body mass index cut-offs for thinness, overweight and obesity.
Pediatric Obesity 7 (4), 284–294. https://doi.org/10.1111/j.2047-6310.2012.00064.x.
Feizi, S./Marbach, D./Médard, M./Kellis, M.
(2013). Network deconvolution as a general method to distinguish direct dependencies in
networks. Nature Biotechnology 31 (8), 726–733. https://doi.org/10.1038/nbt.2635.
Groth, D./Scheffler, C./Hermanussen, M. (2019).
Body height in stunted Indonesian children depends directly on parental education and
not via a nutrition mediated pathway - evidence from tracing association chains by St.
Nicolas House analysis. Anthropologischer Anzeiger 76 (5), 445–451. https://doi.org/10.1127/anthranz/2019/1027.
Karlberg, J. (1989). On the construction of the
infancy-childhood-puberty growth standard. Acta paediatrica Scandinavica. Supplement
356, 26–37. https://doi.org/10.1111/j.1651-2227.1989.tb11237.x.
Lebedeva, L. S. (2019). About the factors
influencing the geographical differentiation of body height among Russian population.
Vestnik Moskovskogo universiteta. Seriia V, Geografiia (4), 24–32.
Limony, Y./Koziel, S./Friger, M. (2019).
Association between the onset age of puberty and parental height. PloS One 14 (1),
e0211334. https://doi.org/10.1371/journal.pone.0211334.
Martin, L./Dorjee, B./Groth, D./Scheffler, C.
(2020). Positive influence of parental education on growth of children - statistical
analysis of correlation between social and nutritional factors on children's height
using the St. Nicolas House Analysis. Anthropologischer Anzeiger 77 (5), 375–387.
https://doi.org/10.1127/anthranz/2020/1177.
Moreno, J. L. (1955). The Sociometric School and
the Science of Man. Sociometry 18 (4), 15. https://doi.org/10.2307/2785839.
Muggeo, V. M.R. (2017). Interval estimation for
the breakpoint in segmented regression: a smoothed score-based approach. Australian
& New Zealand Journal of Statistics 59 (3), 311–322. https://doi.org/10.1111/anzs.12200.
Mumm, R./Godina, E./Koziel, S./Musalek, M./Sedlak,
P./Wittwer-Backofen, U./Hesse, V./Dasgupta, P./Henneberg, M./Scheffler, C. (2018).
External skeletal robusticity of children and adolescents - European references from
birth to adulthood and international comparisons. Anthropologischer Anzeiger 74 (5),
383–391. https://doi.org/10.1127/anthranz/2018/0826.
Navazo, B./Oyhenart, E./Dahinten, S./Mumm,
R./Scheffler, C. (2020). Decrease of external skeletal robustness (Frame Index) between
two cohorts of school children living in Puerto Madryn, Argentina at the beginning of
the 21st century. Anthropologischer Anzeiger 77 (5), 405–413. https://doi.org/10.1127/anthranz/2020/1182.
Saleem, S./Tikmani, S. S./McClure, E. M./Moore, J.
L./Azam, S. I/Dhaded, S. M./Goudar, S. S./Garces, A./Figueroa, L./Marete, I./Tenge,
C./Esamai, F./Patel, A. B./Ali, S. A./Naqvi, F./Mwenchanya, M./Chomba, E./Carlo, W.
A./Derman, R. J./Hibberd, P. L./Bucher, S./Liechty, E: A./Krebs, N./Michael Hambidge,
K./Wallace, D. D./Koso-Thomas, M./Miodovnik, M./Goldenberg, R. L. (2018). Trends and
determinants of stillbirth in developing countries: results from the Global Network's
population-based birth registry. Reproductive Health 15 (Suppl 1), 100. https://doi.org/10.1186/s12978-018-0526-3.
Satake, T./Hattori, K. (2013). Body proportion
chart, 264–265.
Scheffler, C./Hermanussen, M./Bogin, B./Liana, D.
S./Taolin, F./Cempaka, P. M. V. P./Irawan, M./Ibbibah, L. F./Mappapa, N. K./Payong, M.
K. E./Homalessy, A. V./Takalapeta, A./Apriyanti, S./Manoeroe, M. G./Dupe, F. R./Ratri,
R. R. K./Touw, S. Y./K, P. V./Murtani, B. J./Nunuhitu, R./Puspitasari, R./Riandra, I.
K./Liwan, A. S./Amandari, P./Permatasari, A. A. I./Julia, M./Batubara, J./Pulungan, A.
(2020). Stunting is not a synonym of malnutrition. European Journal of Clinical
Nutrition 74 (3), 377–386. https://doi.org/10.1038/s41430-019-0439-4.
Schilitz, A. (2001). Körperliche Entwicklung und
Körperzusammensetzung von Brandenburger Schulkindern im Geschlechter- und
Altersgruppenvergleich. Aachen, Shaker.
Sharma, B./Prasad, G./Aggarwal, N./Siwatch,
S./Suri, V./Kakkar, N. (2019). Aetiology and trends of rates of stillbirth in a tertiary
care hospital in the north of India over 10 years: a retrospective study. BJOG : An
International Journal of Obstetrics and Gynaecology 126 Suppl 4, 14–20. https://doi.org/10.1111/1471-0528.15850.
Speed, M. S./Jefsen, O. H./Børglum, A. D./Speed,
D./Østergaard, S. D. (2019). Investigating the association between body fat and
depression via Mendelian randomization. Translational psychiatry 9 (1), 184. https://doi.org/10.1038/s41398-019-0516-4.